7
Heteroatom‐Doped, Three‐Dimensional, Carbon‐Based Catalysts for Energy Conversion and Storage by Metal‐Free Electrocatalysis
Rajib Paul1, Ajit Roy2, and Liming Dai1,3
1Case Western Reserve University, Department of Macromolecular Science and Engineering, 2100 Adelbert Road, Cleveland, OH, 44106, USA
2Materials and Manufacturing Directorate, Air Force Research Laboratory, 2941 Hobson Way, Wright‐Patterson AFB, OH, 45433, USA
3University of New South Wales, UNSW‐CWRU International Joint Laboratory, School of Chemical Engineering, High St, Kensington, Sydney, NSW, 2052, Australia
7.1 Introduction
The ever‐increasing human population and galloping dependency on advanced electronic devices have led to a seminal growth in global energy consumption [1]. Consequently, advancement in energy conversion and storage technologies are essential. Conventional fossil fuels that cover transportation and industrial sectors supply almost 90% of global energy consumption. The energy conversion through combustion of fossil fuels and other chemical energy components has been a major worldwide concern of environmental pollution [2, 3]. As an estimation, there was 17 TW worldwide energy consumption in 2013, which is expected to be at least doubled by 2050 [4]. Therefore, green and renewable energy sources are essential to address the challenges of fossil fuel consumption [5–7]. The clean and sustainable energy sources, including wind, geothermal, hydropower, and solar, all have limitations related to either their cost or technological drawbacks and application difficulties. Owing to these concerns, intense research attempts are being performed on developing highly efficient and environment‐friendly energy conversion and storage technologies, such as fuel cells, metal–air batteries, and water splitting. These technologies are fundamentally operated through various electrocatalyses [8–10].
Recently, oxygen reduction reaction (ORR), oxygen evolution reaction (OER), hydrogen evolution reaction (HER), carbon dioxide reduction reaction (CO2RR), hydrogen peroxide reduction reaction (HPRR), and methanol/ethanol oxidation reaction (MOR/EOR) have attracted intense research attention for clean and renewable electrochemical energy storage and conversion applications. ORR is related to the fuel cells, whereas OER is crucial for metal–air batteries. The electrochemical or photoelectrochemical water‐splitting‐based hydrogen fuel generation is dictated by HER. The efficiency of these energy conversion techniques depends on the mechanism of catalytic activities of these reactions. The basic mechanism of different redox reactions could be understood by the electrochemical potential, nature of electrolyte, and the interfacial properties between electrodes and electrolytes. Different electrochemical potentials are generally identified through polarization curves, as depicted in Figure 7.1.

Figure 7.1 The polarization curves of various electrochemical reactions.
Source: Zhang et al. 2016 [11]. Reproduced with permission from Royal Society of Chemistry.
For an electrochemical reaction, the standard potential reflects the thermodynamic equilibrium potential for the reaction to take place. Practically, reactions are very unlikely to initiate at the equilibrium potential. The electrochemical reaction proceeds only after overcoming the activation energy barrier. As described in Figure 7.1, the onset potential is the lowest (for the anodic reaction) or the highest (for the cathodic reaction) potential for a reaction to occur at given electrode conditions [11], e.g. the onset potential is where the onset of reduction occurs (Figure 7.1). The overpotential (η) is the driving force for a specific reaction under practical conditions and is defined as the potential difference between the applied potential and the equilibrium potential. Ideally, a catalyst should be able to perform electrochemical reactions just above the equilibrium potential, with zero overpotential. But practically, this does not happen because of the binding energies of intermediates. Therefore, a minimal overpotential tending toward the equilibrium potential resembles a good electrocatalytic behavior. Under charge transfer limitations, the electrochemical reaction rate is expressed by Butler–Volmer equation as
where j is the current density, j0 is the equilibrium (η = 0) current density, α is anodic or cathodic transfer coefficient, n is the transferred electron number, F is the Faraday constant, R is the gas constant, and T is the temperature. A larger exchange current density (j0) implies a faster reaction rate. The trajectory of Equation 7.1 is presented in Figure 7.2a. The value of j0 can be significantly increased by fabricating anode and/or cathode with nanostructured materials with large active surface area keeping the same geometric area constant because j0 is normalized to mere geometric area. In this context, three‐dimensional (3D) isotropic or anisotropic nanostructured materials would be of interest.

Figure 7.2 Schematic plots for (a) Butler–Volmer equation and (b) Tafel plots with Tafel slopes and exchange current density.
Source: Zhang et al. 2016 [11]. Reproduced with permission from Royal Society of Chemistry.
At an equilibrium region (η∼0), Butler–Volmer equation can be simplified as a linear relationship between current density and overpotential as
However, for regions away from equilibrium (η ≫ 0), only one between cathodic and anodic terms presumes as the reverse reaction decays and Butler–Volmer equation is often replaced by Tafel equation [12], which is a linear relationship between η and log j as
Using Equation (7.3), the value of j0 is evaluated from Tafel plot, as shown in Figure 7.2b. The slope thus obtained, which is also called Tafel slope, is proportional to the anodic or cathodic transfer coefficient (α). The value of α generally reveals the possible reaction pathway and the rate‐determining steps. At overpotentials further away from equilibrium (η ⋙ 0), the reaction rate is only limited to the diffusion rate of the electroactive species or mass transport. Thus, the current density or rate of a reaction is evaluated by the mass transfer and does not change by increasing the overpotential (for example, ORR in Figure 7.1).
However, the current density may be increased eventually with a further increase in the overpotential, indicating the onset of parasitic reactions [13]. In this respect, the rotating disk electrode (RDE) is commonly used to understand the mechanism of reaction controlled by mass transport or diffusion. Using a RDE, the number of electrons transferred during the reaction is determined by Levich equation as
When the reactions are controlled through a combination of kinetics of mass transport and diffusion, the Koutecky–Levich equation comes forward, which is useful in estimating kinetic current density and the transferred electron number. Koutecky–Levich equation can be expressed as
Furthermore, a ring electrode (such as Pt or Au) is generally embedded around the disk electrode in a RDE as a second working electrode. This introduces a rotating ring disk electrode (RRDE), which allows to detect the by‐product of an electrochemical reaction [14, 15].
Therefore, several physical parameters, including the overpotential and exchange current density, are crucial to postmortem the electrocatalytic activity of electrocatalysts. Despite numerous reports of 2D electrocatalysts, 3D nanostructured electrocatalysts are very important for further advancement in this field. The 3D porous carbon framework could provide an ideal backbone support with a large surface area for catalytically active sites, a multidimensional conductive network for efficient electron transport, a large space to accommodate the electrolyte/reactant diffusion, and an excellent mechanical stability.
Among metal‐based catalysts, noble metals (e.g. platinum, iridium, and palladium) and their alloys have been used in electrochemical reactions [16]. Owing to the high cost, limited availability, low selectivity, poor durability, susceptibility to gas poisoning, and adverse environmental effects of metal‐based catalysts, however, soaring efforts are being carried out to replace them with cost‐effective alternatives. As a contemporary alternative, earth‐abundant, transition metal (Fe, Co, Zn, Sn, Ti, W, Mo, and Ni)‐based oxide, carbide, nitride, oxynitride, and carbonitride catalysts are being investigated [16–22]. Unfortunately, the applicability of such non‐precious metal‐ and metal‐oxide‐based catalysts has often been hindered by their low intrinsic conductivities due to interfacial complexity of the hybrid structures as well as their thermodynamic instability. For improving the transport conductivity, these transition metal‐based catalysts are generally supported by carbon‐based nanomaterials, such as graphene, carbon nanotubes, carbon nitride, fullerene, mesoporous carbon, activated carbon, and biomass‐derived carbon [22]. Therefore, despite numerous recent reports, the large‐scale commercial application of such electrocatalysts for renewable electrochemical energy technologies are often impeded [23].
A new class of catalyst based on heteroatom‐doped carbon nanomaterial was introduced in 2009, which could replace platinum to efficiently catalyze ORR in fuel cells [24, 25]. Since then, carbon‐based catalysts have increasingly been utilized as efficient catalysts due to their large surface area, excellent electrical and thermal conductivities, appreciable mechanical properties, and light weight [26]. These new metal‐free catalysts have been demonstrated to be efficient for OER [10, 27] and HER [28, 29] as well. They are also utilized for I−/I3− reduction in dye‐sensitized solar cells [26], CO2 reduction for various hydrocarbon‐based fuel production [27], biosensing as well as environmental parameter monitoring [10], and even for the effective production of commodity chemicals [26, 28, 29]. Recently, heteroatom‐doped, heteroatom‐co‐doped, or tri‐doped carbon nanomaterials were shown to act as efficient metal‐free bifunctional electrocatalysts for the ORR and OER in rechargeable metal–air batteries [22], the ORR and HER in regenerative fuel cells [30], and simultaneously for ORR, OER, and HER [31–33]. The catalytic performance of such heteroatom‐doped, carbon‐based catalysts is often comparable or even superior to noble‐metal‐based catalysts. Such an interesting performance has been attributed to the doping‐induced charge redistribution around the heteroatom dopants, modulation in transport properties, and sometimes synergistic effects in doped carbon materials. Figure 7.3 summarizes the revolution of heteroatom‐doped, carbon‐based, metal‐free catalysts [22].

Figure 7.3 Evolution of carbon‐based, metal‐free catalysts since its discovery in 2009.
Source: Dai 2007 [22]. Reproduced with permission from Elsevier.
Very recently, 3D carbon‐based, metal‐free catalysts for different electrochemical‐reaction‐based energy storage applications are on enormous attention [34–36]. Figure 7.4 presents the structural details of different carbon materials with their schematic and experimentally obtained images. The ideal 3D graphene‐CNT structure has not yet been experimentally realized, although extensive experimental efforts have been made to obtain a structure very close to the ideal 3D isotropic carbon structure, as shown in Figure 7.4 [40, 41]. 3D hierarchical materials are very promising due to the large specific surface areas for reaction, which are crucial for efficient energy storage in three dimensions. However, there are many critical issues to fabricate efficient 3D electrocatalysts. In this chapter, we discuss recent developments on heteroatom‐doped and undoped 3D carbon catalysts for various electrochemical reactions toward efficient energy conversion and storage, along with the elucidation of various factors influencing the overall performance of such 3D metal catalysts, and related existing challenges.

Figure 7.4 (a) Schematic and experimentally visualized structural details of different carbon materials, STM image of C60. (b) SWCNT. (c) Graphene. . (d) SEM image of 3D CNT‐graphene architectures obtained by intercalated growth of VACNTs into thermally expanded HOPG.
Source: Du et al. 2011 [40]. Reproduced with permission from American Chemical Society.
Source: Yu et al. 2011 [39]. Reproduced with permission from Springer Nature
Source: Odom et al. 1998 [38]. Reproduced with permission from Springer Nature.
Source: Pawlak et al. 2012 [37]. Reproduced with permission from IOP.
7.2 3D Carbon Catalysts for Oxygen Reduction Reaction (ORR)
ORR is the most important reaction for biological respiration and technologically crucial in energy‐converting systems, such as fuel cells and metal–air batteries [42–47]. In a fuel cell, conversion of direct and efficient electrochemical energy to electric power is easily attained with no greenhouse gas emission. Other than high‐temperature solid‐oxide fuel cells (SOFCs), polymer electrolyte membrane fuel cells (e.g. proton exchange membrane fuel cells, PEMFC) and direct methanol fuel cells (DMFCs) are well known owing to their lower operation temperature and longer life span, promising for next‐generation lightweight vehicles and portable electronics [48]. For both PEMFC and DMFC, the key component, a Pt‐containing catalyst, is anchored on a porous conductive material (e.g. carbon black) acting as an anode and cathode to catalyze hydrogen oxidation reaction (HOR) and alcohol oxidation reaction (AOR) or ORR, respectively. The sluggish kinetics for HOR or AOR at a low temperature (∼80–100 °C) and a high energy input for ORR often becomes crucial, resulting in a large polarization resistance.
Oxygen reduction is a multistep reaction related to either four‐electron (4e−) path to directly generate H2O (in an acidic medium) and OH− (in an alkaline medium) or two‐electron (2e−) process with H2O2 (in an acidic medium) and HO2− (in an alkaline medium) as the intermediate species, depending on the inherently electrocatalytic properties of catalysts. The detailed reaction mechanisms in different media with thermodynamic electrode potential at standard condition are presented below [49, 50].
ORR in acid media:

ORR in alkaline media:
A higher selectivity of 4e− reduction indicates better electrocatalytic ORR efficiency of a given catalyst.
Among heteroatom‐doped 3D carbon (C; electronegativity, ε = 2.50) catalysts, nitrogen (N; ε = 3.07) doping in different carbon architectures, such as MWCNT/rGO hybrid, rGO‐based aerogels, hydrogels, xerogels, graphene foam, porous carbon (mesoporous and macroporous), carbon capsules, and polymer‐ and MOF‐derived carbon networks, has been reported [42, 51–86]. Carbon nitride (C3N4)‐based carbon composites are also popular in this context [83–87]. Sulfur (S; ε = 2.44)‐doped carbon aerogel and graphene foam have also been examined for ORR applications [88–90]. Co‐doping (among various heteroatoms, such as N,B (ε = 2.01); S,P (ε = 2.06); F (ε = 4.17); and O (ε = 3.50), of carbon structures are often performed to tune the bandgap and electrochemical catalytic activities. S/N [91–100], B/N [101–104], P/N [105–108], and F/N [109] as co‐dopants and N/P/O [110] as a tri‐dopant have recently been used for demonstrating the bifunctional and trifunctional carbon‐based electrocatalysts for energy applications.
The synthesis and fabrication of the above‐mentioned carbon electrodes generally involve the functionalization of carbon structures, followed by electrostatic self‐assembly, lyophilization, and pyrolysis. Pyrolysis is very important for improving the conducting properties of the 3D carbon network structure and for removing undesired chemical agents. Heteroatom doping is generally performed through mixing proper chemical with the carbon nanostructures before pyrolysis or during pyrolysis through feeding different gases at different temperatures. The obtained carbon structures are often processed through activation steps. The activation process is normally performed either by low‐temperature (∼100–200 °C) heating with KOH or H2SO4 solution (called chemical activation) or by pyrolysis at high temperature (∼700–1000 °C) with gases such as HN3, N2, H2, and CO2 (called gas activation). Activation process helps to open up nanopores, clean carbon surfaces by removing unnecessary chemical constituents, and increase active defect sites on the carbon lattice, leading to an improvement in electrocatalytic performance. With an increasing number of publications on the carbon‐based, metal‐free electrocatalysts, the main purpose has remained in increasing the specific surface area, improving the overall electrical conductivity of the obtained 3D structure and uplifting the density of intrinsic active sites. Sometimes, it is misunderstood that a simple agglomeration of 2D carbon nanoflakes can form a 3D electrode [39]. Such anisotropic 3D structure lacks in uniform conduction properties, and the pores are usually blocked due to random stacking of carbon layers. Therefore, a real isotropic 3D carbon hierarchy is still very rare. Many reports with 3D carbon electrodes with some extent of structural order can be found and are described below.
Nitrogen‐doped 3D carbon materials are very well known to have high ORR activity and conductivity together with good performance stability [26, 44]. For instance, N‐doped ordered mesoporous graphitic arrays have been demonstrated to exhibit high catalytic activity, high durability, and excellent methanol tolerance in alkaline solutions [57]. Figure 7.5 illustrates fabrication process for a highly conductive, ultralight (2.5 ± 0.5 mg cm−3), neat, and versatile nitrogen‐doped graphene nanoribbon (GNR) aerogel through hydrothermally unzipping MWCNTs. The obtained aerogel can act as a novel ORR catalyst with superb electrocatalytic activity and better stability than commercial Pt/C catalysts in an alkaline medium. The obtained N‐doped GNRs have shown remarkable ORR performance in acidic solutions [42]. N‐doped carbon nanofiber (N‐CNF)‐based aerogels have also demonstrated excellent ORR electrocatalysis [68]. N‐CNF aerogel was prepared by direct pyrolysis of a cheap, green, and mass‐producible biomass, i.e. bacterial cellulose, followed by NH3 activation.
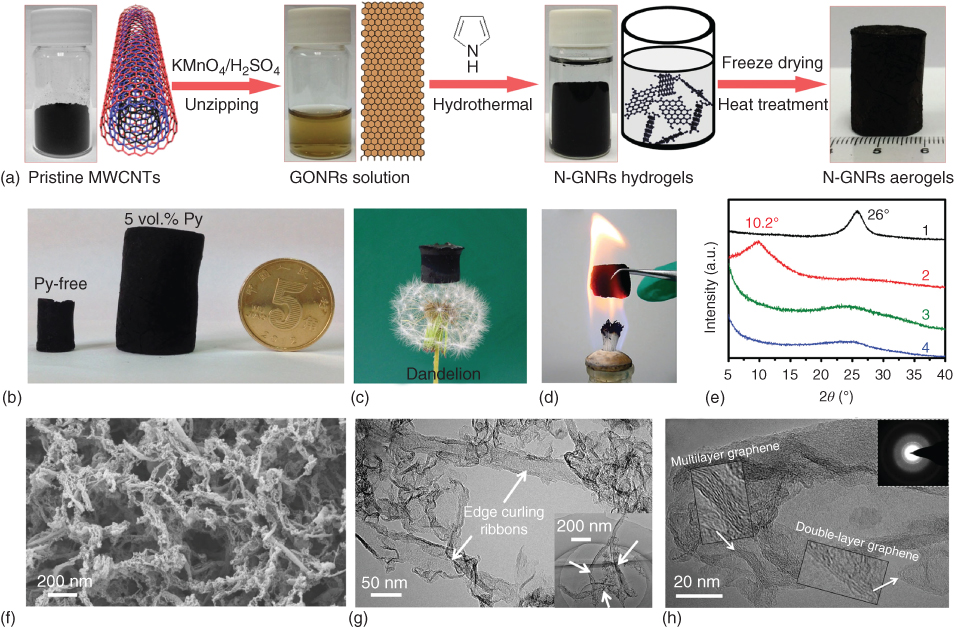
Figure 7.5 (a) Illustration of the synthetic route for N‐GNRs‐A. (b) Photographs of as‐prepared 3D graphene nanoribbon aerogels derived from Py‐free (left) and 5 vol.% Py‐containing (middle) GONRs suspension (10 mg ml−1) after hydrothermal treatment. (c) A monolith of ultra‐light N‐GNRs‐A standing on a dandelion. (d) Photograph of N‐GNRs‐A in a hot flame of an alcohol burner. (e) XRD patterns of (1) pristine MWCNTs, (2) GONRs, (3) GNRs‐A, and (4) N‐GNRs‐A. (f) SEM image of the resulting N‐GNRs‐A. (g, h) Typical TEM and high‐resolution TEM images of the as‐prepared N‐GNRs‐A. Inset in (g) shows three interwoven curly nanoribbons. Inset in (h) is the selected area electron diffraction (SAED) pattern of the aerogel.
Source: Chen et al. 2011 [42]. Reproduced with permission from Wiley‐VCH Verlag GmbH & Co.
Figure 7.6 shows that the N‐CNF aerogel inherits the 3D nanofibrous network of bacterial cellulose and meanwhile possesses high density of N‐containing active sites (5.8 at.%) and large BET surface area (916 m2 g−1). Such N‐CNF aerogel exhibits superior ORR activity (onset potential of 0.85 V versus reversible hydrogen electrode (RHE)), high selectivity (electron transfer number of 3.97 at 0.8 V), and excellent electrochemical stability (97.5% retention after 10 000 potential cycles) in alkaline (0.1 M KOH) media (Figure 7.6). Such performance is better than that of NH3‐treated carbon blacks, carbon nanotubes, and reduced graphene‐oxide‐based aerogels reported as metal‐free catalysts [68]. This N‐CNF aerogel has also demonstrated promising performance in 0.5 M H2SO4 media with 0.83 V onset potential.

Figure 7.6 Synthesis and morphologies of N‐CNF aerogels. (a) Schematic diagram of the synthetic steps. (1) A large‐sized BC pellicle (200 × 230 × 5 mm3, water content ∼99 vol.%) produced by an industry‐scaled microbial fermentation. (2) Photograph, scanning electron microscopy (SEM) image, and schematic illustration of BC aerogels after cutting and freeze‐drying of wet BC pellicles. (3) Black N‐CNF aerogels were obtained finally by heat treatments of BC aerogels two times under N2 and NH3 atmospheres, respectively. The fibrous networks survived after pyrolysis and various types of nitrogen were doped into carbon matrix successfully after NH3 treatment. (b, c) SEM and TEM images of N‐CNF aerogels, respectively, showing the nanofibrous network structure. (d) HRTEM image of an individual N‐CNF. (e) ORR polarization plots of CNF aerogel, N‐CNF aerogel, and Pt/C catalyst. (f) ORR polarization plots for N‐CNF aerogel in O2‐saturated 0.1 M KOH with different speeds. (g) Negative shift of the half‐wave potential (E1/2) of N‐CNF aerogel and Pt/C catalyst with the number of potential cycles under O2.
Source: Liang et al. 2015 [68]. Reproduced with permission from Elsevier.
3D cross‐linking hierarchically porous structure can be obtained through a modified classical carbon aerogel method using NH3 as an activating agent [80]. Figure 7.7 presents the detailed synthesis process and its electrochemical properties. The structure was abbreviated as LHNHPC having specific surface area of 2600 m2 g−1, high content of N dopants (3.12 at.%), and is well compared with benchmark Pt/C catalyst. Comparatively, the LHNHPC exhibited similar electrocatalytic activity toward ORR, superior durability, and excellent methanol tolerance in basic media. Such excellent electrochemical properties of LHNHPC are mainly attributed to the synergistic contribution of its unique hierarchical pore structure, the rich N doping, and the large surface area [80].
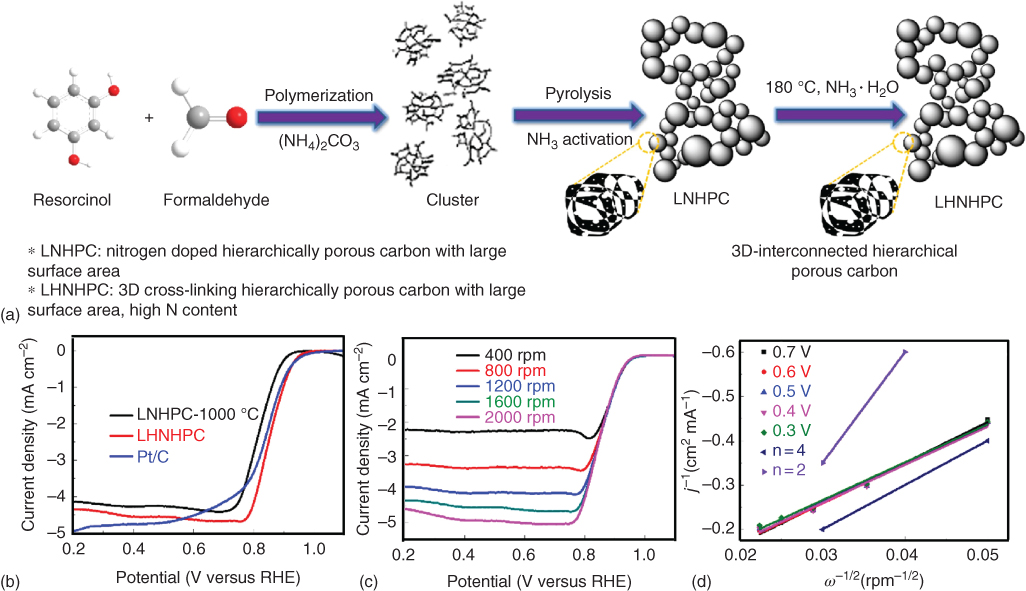
Figure 7.7 (a) The route for stepwise structural evolution from raw materials to LHNHPC. Electrocatalytic ORR results in O2‐saturated 0.1 mol l−1 KOH: (a) RDE polarization curves of LNHPC, LHNHPC, and Pt/C at 10 mV s−1 and 1600 rpm; (b) RDE polarization curves of LHNHPC at different rotating speeds; (c) The Koutecky–Levich plots for LHNHPC obtained from the RDE results.
Source: Wang et al. 2017 [80]. Reproduced with permission from Elsevier.
The important reports on ORR performance using different N‐doped 3D carbon materials are summarized in Table 7.1. Sulfur has very similar electronegativity as carbon, and some researchers have shown superior ORR performance in S‐doped 3D aerogel [88] and graphene foam [89] than their undoped carbon structures (Table 7.1). Such performance was attributed to the thiophene‐like form of S within carbon lattice [89]. The hydrophobicity introduced by sulfur as thiophenic configuration is believed to be crucial for withdrawing oxygen from the electrolyte and its physical adsorption on the surface during ORR [87, 89]. Furthermore, the location of these groups in smaller pores seemed to have some effects on the physical adsorption process. There is also an indication that other bulky sulfur surface groups in configurations with oxygen (sulfoxide, sulfones, and sulfonic acids) located in larger pores (mesopores) attract an electrolyte with dissolved oxygen to the pore system [90]. Therefore, more research is required to explore the S‐doping effect on ORR activities in 3D hierarchical carbon materials.
Table 7.1 Nitrogen‐ or sulfur‐doped 3D carbon catalysts for oxygen reduction reaction (ORR).
| Material | Synthesis method | Chemical content and property | Electrolyte | Onset potential (V versus RHE) and n | Tafel slope (mV dec−1) | Stability | References |
| MWNT‐rGO hybrid | Poly(diallyldimethylammonium) chloride‐functionalized hydrophilic MWNTs and rGO electrostatic self‐assembly |
rGO:pMWNT ∼ 1 : 2. The charge/g: 2.66 C g−1 for rGO, 2.16 C g−1 for pMWNTs, and 62.9 C g−1 for rGO/pMWNT (0.5 : 1) |
0.1 M KOH | −0.23 V, 3.6 | 61% after 20 000 s | [51] | |
| rGO/activated carbon aerogel | GO + activated carbon + ammonium hydroxide, autoclaved and lyophilized for 12 h each | SA ∼ 758.19 m2 g−1 | 0.1 M KOH | 0.83 V, 3.52 | — | [52] | |
| N‐G flower | Co‐pyrolysis of melamine and ferrocene (500–700 °C) | N‐3.62 at.% (600 °C) | 0.1 M NaOH | 0.87 V, 3.96 | [53] | ||
| N graphene foam | Silica spheres, FeCl2·4H2O, dicyandiamide and GO. Pyrolysis at 900 °C | N‐5.07%, SA ∼ 670 m2 g−1 |
0.1 M KOH 0.1 M HClO4 |
0.95 V (Pt/C − 0.96), 3.9 0.83 V, 4 |
98.3 and 95.3% after 5000 cycles | [54] | |
| Hierarchical NG/porous C composite | GO/ethylenediamine, 950 °C | SA ∼ 1510.83 m2 g−1 | 0.1 M KOH | 0.91 V, 3.79 | 70 mV dec−1 (68 for Pt/C) | 18% after 21 600 s | [55] |
| 3D NG | Pyrolysis of GO + polypyrrole, 900 °C | 2–3%, SA ∼ 370 m2 g−1 | 0.1 M KOH | —, 3.9 | Minimum after 2000 cycles | [56] | |
| N–G nanoribbon aerogel | Chemical unzipping of MWCNTs, hydrothermal mixing with pyrrole, pyrolysis | SA ∼ 480–617 m2 g−1, density ∼ 2.5–22 mg cm−3 | 0.1 M KOH | 0.81 V, —, 3.66–3.92 | 78% after 20 000 s | [42] | |
| N–C xerogel | Pyrolysis of organic xerogel in NH3 and pyrolysate | SA ∼ 541 m2 g−1 | 0.5 M H2SO4 | —, 3.5–3.7 | 103 mV dec−1 (pt/C‐72) | [58] | |
| N–C aerogel | Pyrolysis‐900 °C, organic aerogel (synthesized from glucose and 300 mg borax) | N‐2.0–5.5 wt%, SA ∼ 265 m2 g−1 | 0.1 M KOH | 0.5 V | 85% after 200 min | [59] | |
| 3D nanoporous N–G | CVD G growth on nanoporous Ni foam with pyridine at 1000 °C | 5% | 0.08 V, 3.9 | [60] | |||
| 3D flower‐like N–C | Co‐pyrolysis of solid ferrocene and melamine at 500–700 °C | 4.62% | 0.1 M NaOH | Half wave−0.297 V, 3.96 | [53] | ||
| N‐macro/meso C | Macro/mesoporous silica as a hard template and furfuryl alcohol | SA ∼ 1826 m2 g−1 | 0.1 M KOH | 0.127 V negative to Pt/C, 3.2 | 69.6 mV dec−1 | 93.8% after the 45 000 s | [61] |
| Free‐standing nitrogen‐doped carbon nanotubes/carbon nanofiber composites (NCNT/CNFs) | Pyrolysis of pyridine over flexible electrospun carbon nanofiber (CNF) film supported with the nano‐Fe catalyst | 0.1 M KOH | 0.06 V, 3.8 | 94.65% after 10 000 s | [62] | ||
| Nitrogen‐doped carbon foam (CFN) | Template‐free, scalable combustion technique using diethanolamine as N source and ethanol as C | 0.65% N | 0.1 M KOH | 0.92 V, 3.9 | 94.7% after 60 000 cycles | [63] | |
| N–C xerogel | Sol–gel with resorcinol (R) and formaldehyde followed by the subsequent pyrolysis in ammonia atmosphere and after heating at 800 C | 5% N | 0.1 M NaOH | 0.96 V, 3.7 | 97.7% after 1000 cycles | [64] | |
| N–G foams | Silica spheres + GO + N precursors (cyanamide, melamine, and urea) −900 °C | 3.15, SA ∼ 918.7 m2 g−1 |
0.1 M KOH 0.1 M HClO4 |
1.03, 3.9 0.81, 3.8 |
∼97% after 5000 cycles | [65] | |
| 3D N–G | GO in ethanol + 3‐aminopropyltriethoxysilane + 900 °C | 2.92%, 913 m2 g−1 | 0.1 M KOH | 0.973, 3.7 | 100% after 800 s | [66] | |
| N‐macro/mesoporous C | Melamine, resorcinol, hexamethylenetetramine, and colloidal silica‐autoclave (120 °C) pyrolysis 600–900 °C | 3.48%, 845 m2 g−1 | 0.1 M KOH | 0.91 V, 4 | Small change after 4000 cycles | [67] | |
| N–C nanofiber aerogel | Dry bacterial‐cellulose‐derived aerogel pyrolyzed in N2 at 800 °C CNF aerogels. Then heating in NH3 at 700–900 °C | 5.8%, SA ∼ 916 m2 g−1 |
0.1 M KOH 0.5 M H2SO4 |
0.85 V, 3.96 0.83 V |
97.5% after 10 000 cycles | [68] | |
| N–C nanofiber aerogels | Ultrathin‐tellurium‐nanowire‐templated hydrothermal carbonization of glucosamine hydrochloride at 900 °C and CO2 activation at 1000 °C | N‐1.64%, 1324 m2 g−1 | 0.1 M KOH | −0.23 V, 3.74–4.02 | 87.2% after 15 000 s | [69] | |
| N–C capsules | Glyoxal dispersed in ethanol and melamine, pyrolysis at 800 °C | N‐13% | 0.1 M KOH | −0.06 V, 3.7 | 80% after 252 000 s | [70] | |
| N‐holey graphene | GO treated in nitric acid (concentration) to get holey G, which was solvothermally treated with urea | N‐8.6%, SA ∼ 784 m2 g−1 | 0.1 M KOH | −0.08 V, 3.85 | 90% after 10 000 s | [71] | |
| Polymer‐derived 3D N–C network | Self‐assembled polyaniline sealed inside NaCl via recrystallization, pyrolysis | SA ∼ 265.7 m2 g−1, N/C ∼ 3.52–3.85% | 0.1 M KOH | 0.78 V, 3.9 | [72] | ||
| Porous N–C | o‐Phenylenediamine and silica colloid pyrolysis at 900 °C in Ar | SA ∼ 1280 m2 g−1, N ∼ 3.15–9.5 at.% | 0.1 M KOH | ∼0.92 V, 2.62–3.86 | ∼ 98% after 10 000 cycles | [73] | |
| Hierarchical N–C | Sodium alginate and urea pyrolysis | SA ∼ 470.9 m2 g−1, N ∼ 8–2 at.% | 0.1 M KOH | 0.94 V, ∼4 | 68 mV dec−1 | 81% after 20 000 cycles | [74] |
| MOF‐derived N–C | MOF pyrolysis and NH3 activation | SA ∼ 2412 m2 g−1, D ∼ 6.8 nm, N ∼ 4.4–5.5 at.% |
0.1 M KOH 0.5 M H2SO4 |
0.96 V, 3.9–4 0.84 V, |
53 mV dec−1 98 mV dec−1 |
98.33% after 10 000 cycles – |
[75] |
| MOF‐derived, porous N–C | Pyrolysis of Mg‐MOFs at 1000 °C for 1 h | N‐ 1.3–5.7 at.%, SA ∼ 1500 m2 g−1 | 0.1 M KOH | 0.82–0.915 V, 3.6–3.9 | [76] | ||
| MOF derived pyridinic N–C | 2,2o‐bipyridine‐5,5o‐dicarboxylate, AlCl3·6H2O and acetic acid autoclaved at 140 °C and pyrolyzed at 100 °C for 12 h | N ∼ 7.6 at.%, SA – 1180 m2 g−1 | 0.1 M KOH | 0.89 (RHE), 3.82 | 95% after 9000 s | [77] | |
| N‐CNT/rGO from polymer | poly(p‐phenylene vinylene) (PPV)‐precursor adhesion for construction of 3D N‐doped rGO‐PPV‐calcined CNTs | SA ∼ 268 m2 g−1, N – 4.21 at.% | 0.1 M KOH | 0.92 V, 3.99 | 92% after 40 000 s | [78] | |
| Graphene sheets inside CNT voids | Annealing mixture of FeCl3 and cyanamide at 900 °C in Ar | SA ∼ 363.8 m2 g−1, N – 6.6 at.% | 0.1 M KOH | 0.46 V, 3.98 | — | [79] | |
| N‐porous carbon | Resorcinol + formaldehyde + ammonium carbonate – pyrolysis up to 1000 °C in NH3 flow | N – 3.12 at.%, SA ∼ 2986 m2 g−1 | 0.1 M KOH | 0.98 V, 3.75 | 98.6% after 10 000 cycles | [80] | |
| N–C | Polymerization of melamine‐resorcinol‐hexamethylenetetramine, pyrolysis at 900 °C in N2 | N – 3.48 at.%, SA ∼ 845 m2 g−1 | 0.1 M KOH | 0.91 V, ∼4 | 98.7% after 4000 cycles | [67] | |
| N–C (coal tar derived) | Coal tar processing and oxidizing using concentrated acids and pyrolyzed at 900 °C | N – 3.5 wt%, SA ∼ 1985.1 m2 g−1 | 0.1 M KOH | 0.92 V, >3.8 (0.27–0.85 V) | 98.8% after 3000 cycles | [81] | |
| Sponge‐like N–C/graphitic‐C3N4 | C‐chitin/g‐C3N4 solution with NaOH pyrolyzed at 800 °C | N – 13.19 at.% | 0.1 M KOH | 3.9 | 76 mV dec−1 | 86.8% after 50 000 s | [84] |
| Mesoporous C3N4/carbon | Silica microsphere pyrolysis with sucrose – 900 °C, cyanamide at 550 °C | C3N4 | 0.1 M KOH | 150 and 190 mV dec−1 | ∼85% after 60 h | [85] | |
| Porous graphitic C3N4/carbon composite spheres | Melamine and cyanuric acid, and glucose mixed and pyrolyzed at 600 °C | N/C ∼ 0.69, SA ∼ 450 m2 g−1 | 0.1 M KOH | 0.9 V, 3.4 | 80% after 20 000 s | [86] | |
| C3N4 nanosheets and rGO self‐assembly | Pyrolyzation of melamine: g‐C3N4, mixture of g‐C3N4 and GO‐treatment with xenon lamp in methanol | SA ∼ 310 m2 g−1 | 0.1 M KOH | −0.21 V, 3.8 | 93% after 20 000 s | [87] | |
| S–C aerogel/GO composite | C‐aerogel:resorcinol–formaldehyde polymer aerogel, S‐C aerogel: heating C aerogel at 650 and 800 °C in H2S for 3 h, GO and aerogel sonication | S – 2.5%, 412 m2 g−1 | 0.1 M KOH | 0.829 V, 2–3.9 | 70% after 1300 cycles | [88] | |
| S‐graphene foam | Solvothermal with GO and Na2S | S – 0.5%, SA ∼ 66 m2 g−1 | 0.1 M KOH | — | — | ∼100% after 1000 cycles | [89] |
There have been various strategies to incorporate different elements in 3D carbon materials for multifunctional electrocatalysis. Co‐doped carbon electrodes have already demonstrated similar or superior catalytic performance in comparison with metal‐based catalysts. For example, hollow‐structured 3D carbon sphere nanocomposites (N,S‐hcs) doped with nitrogen and sulfur were synthesized through a soft template method and high‐temperature treatment [95]. The N,S‐hcs nanomaterials demonstrated excellent catalytic activity for ORR. Figure 7.8 shows the synthesis and catalytic performance of N,S‐hcs. Co‐doping of mesoporous carbon with N/S and the related large surface area were attributed to the enhanced catalytic activity of the resulting materials. Moreover, the N,S‐hcs electrocatalysts possessed four‐electron oxygen reduction selectivity, long‐term durability, and high resistance to methanol poisoning, all of which represented improvements over the conventional Pt/C electrocatalyst.

Figure 7.8 (a) Schematic illustration of the preparation of N/S‐hcs, (b) LSVs of N,S‐hcs treated at various temperatures, and (c) various samples at a rotation speed of 1600 rpm and a scan rate of 5 mV s−1. (d) LSVs of N,S‐hcs‐900 °C at different rotating speeds and (e) the Koutecky–Levich plots at different potentials.
Source: Wu et al. 2016 [95]. Reproduced with permission from The Royal Society of Chemistry.
Except N/S co‐doping, N/P‐, B/N‐, N/F‐, and P/C3N4‐co‐doped 3D carbon materials have also been fabricated and examined with a purpose to achieve superior ORR catalysts than Pt/C. Table 7.2 enlists all such efforts with their ORR performance. Among various co‐doped 3D carbon catalysts, N/S and N/P co‐doping seem to be comparatively favorable for ORR catalysis. Furthermore, three elemental doping (tri‐doped) in 3D carbon structure has also been studied [32, 33], although very rare, as ORR catalysts. Figure 7.9 shows another such study, in which a scalable method is introduced to obtain N–P–O tri‐doped freestanding 3D graphene foam using one‐pot red phosphorus‐assisted technique. In particular, the solid carbon precursor was gradually exfoliated through the slowly released gases (e.g. pH3, H2, and CO2) and metallic K during the reaction [110]. As a result, a large amount of nanopore formation and compactness in 3D carbon structure were achieved.
Table 7.2 Co‐doped and tri‐doped carbon‐based 3D catalysts for oxygen reduction reaction.
| Material | Synthesis method | Chemical content and property | Electrolyte | Onset potential (V) and n | Tafel slope (mV dec−1) | Stability | References |
| N/S‐co‐doped C | |||||||
| N/S‐G frameworks | Graphene oxide and ammonium thiocyanate/autoclave (180 °C) | N,S 12.3% and 18.4% | 0.1 M KOH | 0.27 (Ag/AgCl, 3 M), 3.9 | 85.2% after 20 000 s | [91] | |
| (N and S)‐co‐doped micro/mesoporous carbon foams | Via thermal reaction between sulfur sphere core and polyaniline shell without any templates or toxic gases at high temperature (1000 °C) | N,S ∼ 0.58, 1 at.% | 0.1 M KOH | 0.051 V, 3.67 | 76.5% after 20 000 s | [92] | |
| N/S C with macroporosity | Monodispersed silica spheres + 1‐methyl‐3‐propagylimidazolium bromide] [bis(trifluoromethylsulfonyl) imide + pyrolysis in N2 at different temps, SiO2 remove in HF |
4.4%, 2.6%, 1.1%, and 1.0% at 800, 900, 1000, and 1100 °C SA ∼ 1146.6 m2 g−1 (1100 °C) |
0.1 M KOH | −0.11 (Hg/HgO), 3.4–3.8 in −0.3 to −0.7 V range | 95% after 10 000 s | [93] | |
| Porous S/N–C from honeysuckles | Honeysuckle pyrolysis in N2 at 600–900 °C | S – 0.46%, N – 1.75, SA ∼ 246 m2 g−1 | 0.1 M KOH | 0.027 (Hg/HgO), 3.6 | Good stability after 1000 cycles | [94] | |
| N/S‐doped hollow C sphere | Triton X‐100, pyrrole, aniline, ammonium persulfate: pyrolysis | N ∼ 4.2% (wt.), S ∼ 3.8% (wt.) | 0.1 M KOH | 0.93 V, 3.9 | 90% after 20 000 s | [95] | |
| S/N–C aerogel | Glucose and ovalbumin heated in autoclave at 180 C for 5.5 h with S source: S‐(2‐thienyl)‐L‐cysteine (TC) or 2‐thienyl‐carboxaldehyde (TCA), N source: pyrolysis in N2 at 900 °C | N – 3.3%, S – 0.5%. SA ∼ 224.5 m2 g−1 |
0.1 M KOH 0.1 M HClO4 |
−0.13 V (Ag/AgCl), 2–4 >0.2 V (Ag/AgCl), 2–4 |
89% and ∼75% after 12 000 s | [96] | |
| N/S‐porous carbon | Iron and polyquaternium‐2 dispersed onto SiO2 spheres followed by coagulation, pyrolysis, SiO2 removal, and H2SO4 leaching | N ∼ 3.9% (at.), S ∼ 0.76% (at.); SA ∼ 1201 m2 g−1, Pore d ∼ 1–28 nm |
0.1 M KOH 0.5 M H2SO4 |
0.95 (SHE), 3.97 0.8 (SHE), 3.97–3.99 |
100% and 95.2% after 5000 cycles | [97] | |
| N/S graphene | Self‐assembled pyrrole polymerized on graphene oxide template, pyrolysis | ∼9.05% (at.), S ∼ 1.65% (at.) |
0.1 M KOH 0.5 M H2SO4 |
0.338 (Ag/AgCl), 4 0.73 V, 3.92 |
78.2, 77.4% after 30 000 s | [98] | |
| N/S‐porous C/Pt | Ionic liquid (1‐butyl‐3‐methylimidazolium bis(trifluoro methylsulfonyl)imide) (C10H15F6N3O4S2) + KCl + ZnCl2 pyrolysis at 850 °C | N, S ∼ 7.03, 1.68 at.%, SA ∼ 1424 m2 g−1 | 0.5 M H2SO4 | 0.85 (SCE), 4 | ∼100% after 126 000 s | [99] | |
| N/S–C nanowire aerogel | Hydrothermal synthesis using D‐(+)‐glucosamine hydrochloride and thiourea, pyrolysis at 900 °C | N – 6.38%, S – 0.84 at.%, SA ∼ 870 m2 g−1 | 0.1 M KOH | 0.905 V, 4.3 | 91% after 20 000 s | [100] | |
| B/N‐co‐doped C | |||||||
| N‐, B‐, B/N‐doped 3D G networks | Ni foam template and electrochemical doping | 0.1 M KOH | −3.7 (Ag/AgCl), 3.6 and 3.8 respectively | 85%, 70%, and 82% after 3000 s | [101] | ||
| Hydrogel: B/N‐doped porous C network | Pyrolysis of agarose hydrogel containing TBE buffer (Tris base, boric acid and ethylenediaminetetra acetic acid) followed by chemical activation (KOH) | B/C ∼ 0.1%, N/C ∼ 0.7%, SA ∼ 2666 m2 g−1 | 0.1 M KOH | −0.18 (Ag/AgCl), 3.64 | 95.3% after 10 000 cycles | [102] | |
| B/N‐doped graphene aerogel | GO treated with urea and chitosan; in second step, the product was mixed with boric acid and pyrolyzed at 1000 °C | Pore diameter ∼ 88.3–185.6 nm, SA ∼ 545.7 m2 g−1, | 0.1 M KOH | −0.07 (SCE), 3.87 | 73 mV dec−1 | 95% after 10 000 s | [103] |
| h‐B/N rGO composite | rGO/BN by hydrothermal method, annealing at 750 °C in N2 | hBN ∼ 5 wt% | 0.1 M KOH | 0.798 (Ag/AgCl, Sat.), 3.8 | ∼95% after 10 000 cycles | [104] | |
| N/P‐co‐doped C | |||||||
| N/P‐porous C | Co‐pyrolyzing N and P containing precursors and poly(vinyl alcohol)/polystyrene (PVA/PS) hydrogel composites as in situ templates | 1083 m2 g−1 | 0.1 M KOH | 0.946 (RHE), 3.9–4 | [105] | ||
| N/P–G nanoribbons/CNT composites | Partially unzipped CNTs and 1.0 g of ammonium dihydrogen phosphate (NH4H2PO4) was first grounded into fine powder in a mortar and then annealed in a tube furnace at a heating rate of 10 °C min−1 for 2 h in N2 at 900 °C |
N – 0.94% P – 2.56% |
0.1 M KOH | 0.90 (RHE), 3.97 | 46.7 mV dec−1 | ∼96% after 600 s | [106] |
| N/P‐porous carbon | Melamine + amino trimethylene phosphonic acid + carbon quantum dots, pyrolyzed up to 1000 °C in Ar for 1 h | N – 3.48, P – 0.91 at. %, SA ∼ 743 m2 g−1 (900 °C) |
0.1 M KOH 0.5 M H2SO4 |
0.92 (RHE), 3.89 0.74 (RHE), 3.64 |
84.2% 73.6% after 12 000 s |
[107] | |
| P/C3N4 nanosheets and –NH2 functionalized carbon black composite | Nitrilotris(methylene)triphosphonic acid with dicyandiamide‐thermal polycondensation at 600 °C – addition of NH2‐CB and freeze‐drying | N – 42.72, O – 6.03, and P – 4.53%, SA ∼ 286 m2 g−1 | 0.1 M KOH | 0.87 (Hg/HgO), 3.83 | 89 mV dec−1 | ∼94% after 3000 cycles | [108] |
| N/F‐co‐doped C | |||||||
| N/F–C aerogel | Hydrothermal carbonization of glucose and ammonium fluoride up to 1000 °C in N2 | N – 1.8, F – 0.04 at. %, SA – 768.4 m2 g−1 | 0.1 M KOH | 0.912 (RHE), 3.7 | 70 mV dec−1 | 95% after 20 000 s | [109] |
| N/P/O‐tri‐doped C | |||||||
| N/P/O–G | Ball‐milled Artemia cyst shells and red P mixture: KOH activation and pyrolysis at 850 °C | O,N,P – 9.12, 1.19 and 1.02 at.% respectively SA ∼ 1406 m2 g−1 | 0.1 M KOH | 0.928 (RHE), 3.83 | 92% after 10 000 s | [110] | |
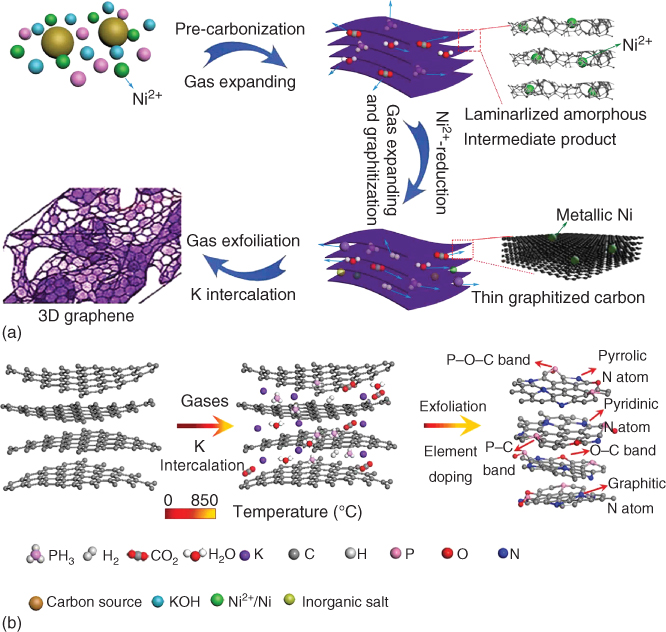
Figure 7.9 Illustration of the growth mechanism of 3D‐HPG: (a) phase evolution process and (b) illustration of gas exfoliation and K intercalation.
Source: Zhao et al. 2016 [110]. Reproduced with permission from Elsevier.
The as‐fabricated 3D hierarchical porous graphene (3D‐HPG) was almost isotropic in nature having pores ranging from 50 nm to 1 μm. The 3D‐HPG was also utilized as the supercapacitor electrode and a metal‐free catalyst for ORR, offering ultrahigh‐specific capacitance of 426 F g−1 (424 F cm−3), as well as excellent ORR catalytic performance in alkaline electrolyte with 0.93 V onset potential and 92% current density retention even after 10 000 s of reaction, whereas Pt/C had only 81% retention [110]. Furthermore, the assembled all‐solid‐state cell exhibited both high gravimetric (25.3 Wh kg−1) and volumetric (25.2 Wh l−1) energy density, which are among the highest values of the state‐of‐the‐art carbon‐only supercapacitors. Density functional theory (DFT) calculations indicated that N–P–O tri‐doping could significantly enhance the charge delocalization with benefited electrochemical activity.
It should be mentioned that pure carbon nanocages without any apparent dopants or physically adsorbed polyelectrolyte have performed good ORR performance. DFT calculations indicated that the high ORR activities intrinsically associated with the pentagon and zigzag edge defects [111]. Utilizing this concept, ORR catalyst based on graphene quantum dots supported by GNRs was developed through a one‐step reduction reaction, with ORR performance comparable or even better than that of a Pt/C electrode [112]. Such electrocatalytic performance has been attributed to the presence of surface and edge defects at the interfaces and edges of quantum dots and GNRs, together with efficient charge transfer through the intimate interfaces between quantum dots and GNRs. Such quantum defect and interface‐based strategy can also be adapted for 3D carbon structures without and with heteroatom doping to develop defect‐induced ORR catalysis with detailed mechanistic studies. In this context, 3D carbon materials derived from biomass (e.g. shrimp‐shell, chitin, and keratin) [113–116] and food‐grade (D‐glucose) [117] component have also been demonstrated to exhibit efficient ORR activities in microbial fuel cells [118].
7.3 Carbon‐Based 3D Electrocatalysts for Oxygen Evolution Reaction (OER)
OER produces molecular oxygen through several proton/electron‐coupled steps [119, 120], and is pH sensitive. In acidic and neutral electrolytes, two water molecules (H2O) are oxidized into four protons (H+) and oxygen molecule (O2), whereas, for basic solution, hydroxyl groups (OH−) are oxidized into H2O and O2. The equilibrium half‐cell potentials (![]() ) at 1 atm and 25 °C for OER are shown below [121]:
) at 1 atm and 25 °C for OER are shown below [121]:
- OER in alkaline solution:

- OER in acidic solution:

To avoid the pH influence on the applied potential and to maintain the working voltage around 1.23 V, reversible hydrogen electrode (RHE) is generally used as a reference [121]. The evolution of O2 molecule needs transfer of four electrons, and favorable kinetics for OER process takes place in multistep reactions with single‐electron transfer at each step. Clearly, accumulation of energy at each step triggers sluggishness in OER kinetics, resulting in a large overpotential. Therefore, highly active OER electrocatalyst is required to overcome the energy barrier [122, 123]. For an ideal OER catalyst, related overpotential must be low with high catalytic stability, low cost, and earth‐abundance for large‐scale commercialization.
Table 7.3 summarizes heteroatom‐doped 3D carbon materials and their OER performance. Apart from N‐doped porous carbon [27] and C3N4/CNT composite catalysts [124], N/O‐co‐doped hydrogel [125] demonstrated a lower onset potential (1.28 V) for OER in 0.1 M KOH electrolyte, although N‐doped porous carbon exhibited a better OER catalytic stability [27]. In an acid medium (0.5 M H2SO4), N/O hydrogel showed better OER performance as compared with commercial IrO2 electrode [125]. S/N‐co‐doped foam and rGO/CNT composite electrodes have also performed efficient OER in an alkaline medium (0.1 M KOH) even with a very low doping amount (0.5–1.26 at.%) due to synergistic effect, modification in electronic configuration in the catalysts, and modulation in conducting properties [126, 127]. However, the catalytic stability in S/N‐doped electrodes is worse as compared with N‐ or N/O‐doped, carbon‐based catalysts. In this context, P/N‐ [128] or P/C3N4 [129]‐co‐doped 3D carbon catalysts have demonstrated excellent OER stability (>93% current density retention) for up to 30 h continuous operation in an alkaline medium (0.1–1 M KOH). In particular, hierarchically porous P‐ and N‐co‐doped carbon nanofibers were prepared by directly growing polymer nanowires on conductive carbon paper through an electrochemically induced polymerization process in the presence of aniline monomer and phosphonic acid, followed by carbonization, as shown in Figure 7.10 [128]. The resultant carbon catalyst exhibited robust stability (little activity attenuation after 12 h continuous operation) and high activity with a low overpotential (310 mV at 10 mA cm−2) toward electrocatalytic oxygen production, comparable with that of the precious iridium oxide (IrO2) benchmark [128]. Experimental measurements revealed that dual doping of N and P led to an increased active surface area and abundant active sites in comparison with the single‐doped and pristine carbon counterparts. Density functional theory calculations indicated that N and P dopants could coactivate the adjacent C atoms, inducing synergistically enhanced activity toward OER, as shown in Figures 7.10f–g [128]. The catalytic performances could be theoretically examined by calculating the free energy diagrams based on experimentally evidenced 4e− transferring processes at different electrode potentials (Figure 7.10h). This implies that co‐doping of N and P into the carbon framework can significantly reduce the overall free energy relative to the single‐doped and pristine carbons. When the applied potential (U) is set to 0 V, the first three steps, corresponding to the electron transfer for adsorbing HO*, O*, and OOH*, respectively, are endothermic reactions, whereas the fourth step relating to desorption of O2 is exothermic. The third electron transfer step with the highest reaction energy barrier is the rate‐determining step. However, when the potential is increased to 0.907 V (0.505 V in overpotential, Figures 7.10h,i), all the elementary reaction pathways become downhill and exothermic, and thus, OER can occur spontaneously. The OER overpotential is remarkably decreased via co‐doping, signifying that OER activity can be improved overall by N,P co‐doped [128].
Table 7.3 Heteroatom‐doped, carbon‐based 3D catalysts for oxygen evolution reaction (OER).
| Material | Method | Content and property | Electrolyte | Onset potential (RHE) and n | Potential at 10 mA cm−2 (RHE) and Tafel slope (mV dec−1) | Stability | References |
| N‐porous C | Pyrolysis of GO and dimethyl sulfoxide mixture at 700 °C | N – 4.1 at.%, SA ∼ 560 m2 g−1 | 0.1 M KOH | 1.52 V, 3.9 | 1.61 V | ∼100% after 20 cycles | [27] |
| C3N4/CNT | Low‐temperature self‐assembly of g‐C3N4 sheets and CNTs | SA ∼ 149 m2 g−1, N – 23.7 wt% | 0.1 M KOH | 1.53 V, 4 | 1.6 V, 83 | 86.7% after 10 h | [124] |
| N/O–C hydrogel | Via layer‐by‐layer assembly of rGO and CNTs, autoclaved N‐doping with ammonia | N/C – 9.9%, SA ∼ 519 m2 g−1 |
0.1 M KOH 0.5 M H2SO4 |
1.28 V, 4 Better than IrO2 |
1.7 V, 141 Better than IrO2 |
∼80% after 200 cycles | [125] |
| S/N–C foam | Exfoliated graphite by acid + thiourea, autoclaved at 180 °C for 12 h | N, S ∼ 1.18 and 0.51 at.% | 0.1 M KOH | 1.55 V, | 0.38 V, 98 | 77% after 16 h | [126] |
| S/N‐G/CNTs | GO + CNT treated with urea and thiourea, autoclaved at 180 °C for 12 h | N – 0.71, O – 3.1, S – 1.26 at. % | 0.1 M KOH | 1.57 V, 4 | 1.89 V, 103 | — | [127] |
| N/P‐doped active C fiber | Calcined and acid‐treated C paper + electrochemically hydrogel growth in aniline and ethylene diphosphonic acid, pyrolysis at 700 °C for 2 h | SA ∼ 473 m2 g−1 | 1 M KOH | 1.51 V, 4 | 1.54 V, 87.4 | 93.4% after 12 h (IrO2 ∼ 72.9%) | [128] |
| P/C3N4‐C fiber | Hydrothermal treatment of c‐paper in melamine + ethylene diphosphonic acid, pyrolyzed at 550 °C | N – 13.2 wt%, P – 0.9 wt% | 0.1 M KOH | 1.53 V | 1.63 V, 61.6 | 93.4% after 30 h | [129] |

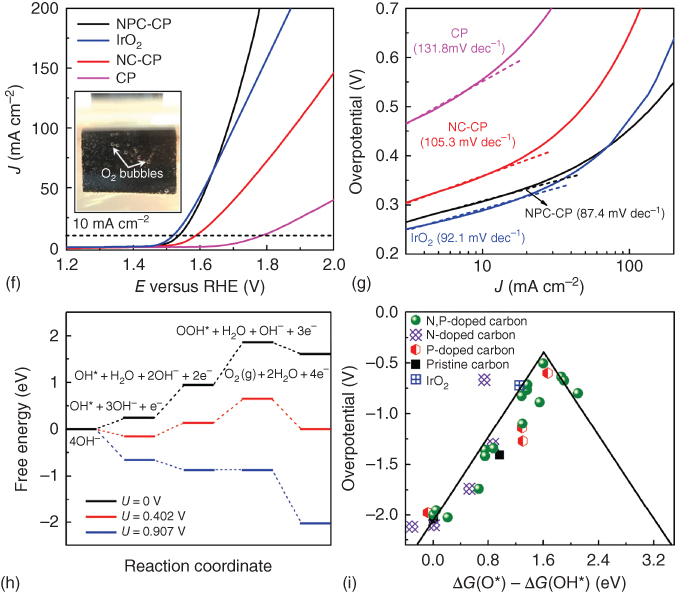
Figure 7.10 (a) Schematic illustration of direct growth of N‐ and P‐doped carbon nanofibers on carbon paper, (b,c) SEM, and (d,e) TEM images of NPC‐CP, inset in panel (d) shows the corresponding SAED pattern. (f) OER curves and (g) Tafel plots of NPC‐CP, NC‐CP, IrO2, and pristine CP in O2‐satuated 1 M KOH (scan rate: 2 mV s−1). (h) Calculated free energy diagrams for the OER pathway on N,P‐doped carbon at three different potentials: 0 V, 0.402 V (equilibrium potential), and 0.907 V. (i) Volcano plots of OER overpotential versus the difference between the adsorption energy of O* and OH*, that is ΔG(O*) − ΔG(OH*), for the simulated carbon structures.
Source: Zhu et al. 2017 [128]. Reproduced with permission from Wiley‐VCH Verlag GmbH & Co.
Multifunctional electrocatalysts have attracted focused research attention due to inherent cost reduction using same catalyst for various redox reactions. In this context, bifunctional 3D carbon catalysts with ORR and OER activities have been summarized in Table 7.4. Chemically and electrochemically synthesized N‐, P‐, C3N4‐, B‐doped and N‐C3N4, P/C3N4‐, P/S‐, B/N‐, N/S‐co‐doped carbon 3D electrodes have demonstrated electrocatalytic activities for both ORR and OER (Table 7.4) [47, 58, 84, 129–138]. Along with recent attempts for conversion of metal–organic frameworks, metal‐based coordination compounds have also been researched for producing 3D carbon networks. In this context, a 3D interconnected hollow N‐doped graphene shells, consisting of three to four layers with small, uniform mesopores of c. 4 nm, were obtained from Ni(II) molecular coordination compound, as shown in Figure 7.11 [130]. The resultant 3D mesoporous graphene material exhibited superior bifunctional electrocatalytic activity and durability in ORR and OER, comparable with that of noble metal catalysts such as Pt/C and Ir/C [130]. Such high bifunctional activity of the 3D mesoporous graphene material was attributable to its very large surface area, numerous defect sites associated with its highly curved structure (Table 7.4). In addition, the presence of N and Ni species in the carbon framework might have also contributed to the high catalytic activity, showing promises for use in regenerative fuel cells as well as rechargeable metal–air batteries [130].
Table 7.4 Heteroatom‐doped, carbon‐based 3D catalysts for bifunctional activities toward oxygen reduction (ORR) and evolution reaction (OER).
| Material | Method | Content and property | Electrolyte | Onset potential (V versus RHE) and n | V at 10 mA cm−2 (V) and Tafel slope (mV dec−1) | Stability | References |
| 3D mesoporous N graphene | Thermal conversion of Ni2[ETDA] coordination complex at 1000 °C in N2 | Mesopores ∼ 4 nm, SA ∼ 555 m2 g−1 | 0.1 M KOH |
OR 0.85 V OE 1.45 V |
ER 1.56 V | [130] | |
| N–G/CNT hybrids | CVD with FeMoMgAl flakes as catalyst and ethylene/ammonia as carbon/nitrogen feedstocks | N – 0.53 at.%, SA – 812.9 m2 g−1 | 0.1 M KOH | OR 0.88 V, 3.3; OE 1.51 V | OE 1.63 V, 83 | 92.1% after 16 000 S | [58] |
| O–C fiber (surface exfoliated) | In situ exfoliation of edge/defect‐rich and O‐doped graphene on the surface of carbon fibers | O – 13.9% | 0.1 M KOH | OR 0.76 V, 3.5; OE 1.58 V | OE 1.68 V, — | Stable over 40 000 s | [131] |
| N‐CNT/G composite | Ethylene diamine‐aided CVD‐NCNT growth on rGO | N – 3.9%, SA – 175.3 m2 g−1 | 0.1 M KOH | OR 0.97 V, 4; OE 1.52 V, — | OE 1.67 V, — | — | [132] |
| N‐ mesoporous C‐nanosheet/CNT hybrid (N‐MCN/CNTs) | Hydrothermal treatment of urea (2 g) and glucose (100 mg) with MWCNTs, pyrolysis at 800 °C in Ar | N – 10.7, O – 4.2 at.%, SA – 594.1 m2 g−1 | 0.1 M KOH |
OR 0.95 V,4; OE 1.5 V |
OR, —, 79 OE 1.55 V, 55 |
RR‐92.5% (7 h), ER‐100% (14 h) | [133] |
| N–C microtube sponge (flexible) | Pyrolyzing facial cotton (100% cotton, 1000 °C under NH3 for 1 h). | SA ∼ 2358 m2 g−1, C, N, O – 93.2, 2, and 4.8 at.% | 0.1 M KOH |
OR 0.89 V, 4 OE 1.5 V |
OE – 1.52 V, 246 |
72.9% after 100 h (Pt/C ∼ 50%) | [134] |
| N‐doped carbon nanonets, g‐N‐MM‐Cnet | TTIP/P123/HCl/H2O/ethanol in the mixture + dicyandiamide | SA ∼ 1947 m2 g−1 |
0.1 M KOH 0.5 M H2SO4 |
OR 0.96 V, 3.9 OE 0.37 V |
–, 70 1.6 V, 26 |
[135] | |
| N–C/C3N4 | Chitin + NaOH + urea + g‐C3N4‐stirring, drying, pyrolysis at 800 °C in Ar | N – 13.19 at.%, SA ∼ 87.19 m2 g−1 | 0.1 M KOH |
OR 0.86 V, 3.9 OE 1.64 V, — |
–, 76 1.68 V, − |
89.9% 86.8% after 50 000 s |
[84] |
| P/C3N4 nitride nano‐flowers‐on flexible carbon fiber paper | P‐g‐C3N4 (P‐g‐C3N4) directly grown on CFP (PCN–CFP) by pyrolysis at 550 °C | 0.1 M KOH |
OR 0.94 V, — OE 1.53 V |
— 122.3 | [129] | ||
| P/S C3N4 sponge sandwich with C nanocrystals | Pyrolysis at 500 °C, freeze‐drying | N – 41.36, P – 1.68, and S – 1.59%, SA – 1474 m2 g−1 | 0.1 M KOH |
OR 0.97 V/4 OE 1.26 V |
—, 61 (Pt/C 78) 1.56, 64 |
97.4% after 8000 s | [47] |
| Heteroatom‐doped graphene “Idli” | Idli made of heteroatom‐doped GO and rice flour, microwave heating, and calcination at 300 °C | SA ∼ 499 m2 g−1 | 0.1 M KOH |
OR −0.02 V, — OE 0.29 V |
—, 49.83 —, 35.71 |
[136] | |
| B/N‐porous C | Silicon sphere + methyl violet + boric acid calcined, and pyrolyzed at 800 °C | N – 7.94, O – 9.48, and B – 1.51 at. % | 0.1 M KOH |
OR 0.92 V, 3.83 OE 1.19 V |
1.23 V |
[137] | |
| N/S‐porous C | Teflon‐assisted etching of silica template and simultaneous pyrolysis of sucrose and trithiocyanuric acid at 1100 °C | N + S – 3.21 and O – 3.15 wt %, SA ∼ 830 m2 g−1 |
0.1 M KOH 0.1 M HClO4 0.1 M KOH |
OR 0.94 V, 3.86–3.96 0.88 V, 3.89–3.96 OE 1.66 V |
1.69 V |
[138] |
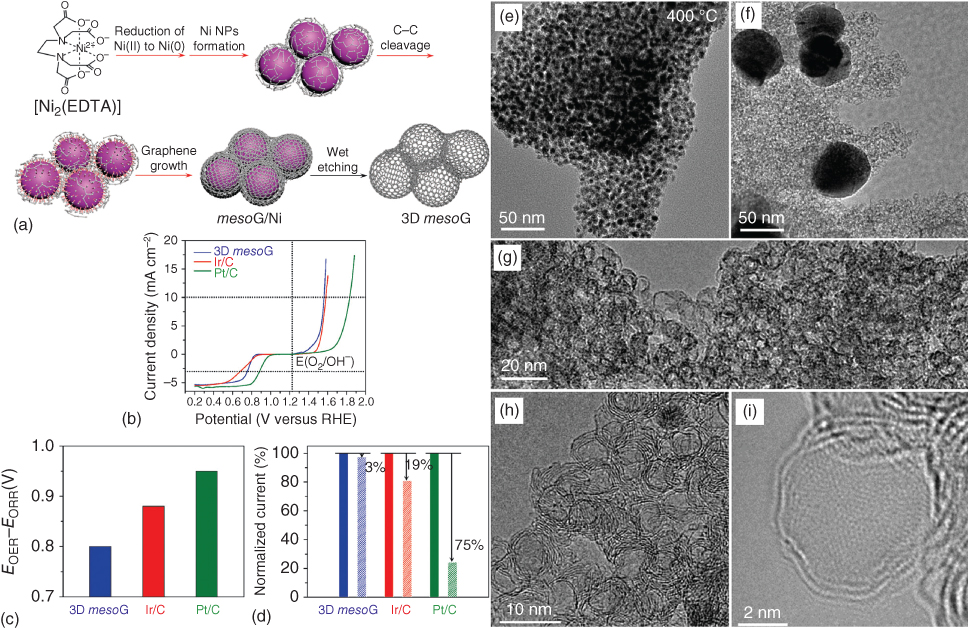
Figure 7.11 (a) Schematic representation of the thermal conversion of [Ni2(EDTA)] into 3D mesoporous graphene, 3D mesoG. The processes indicated by red arrows occurred during the one‐step heat treatment of [Ni2(EDTA)]. (b) Electrocatalytic polarization curves showing ORR and OER activities of 3D mesoG, Ir/C, and Pt/C catalysts. (c) Bar graph showing the potential differences to drive 10 mA cm−2 for the OER and 3 mA cm−2 for the ORR. (d) Changes in relative current densities of 3D mesoG, Ir/C, and Pt/C catalysts for the OER before and after cycling tests. TEM image of (e) mesoG/Ni during the thermal conversion at 400 °C, (f) mesoG/Ni after heat treatment at 1000 °C, and (g–i) 3D mesoG at various magnifications.
Source: Lee et al. 2015 [130]. Reproduced with permission from The Royal Society of Chemistry.
N‐doped mesoporous carbon nanosheet and MWCNT hybrid composite can be synthesized through hydrothermal method by the pyrolysis of glucose, urea, and CNTs for developing efficient bifunctional catalysts, as shown in Figure 7.12 [133]. The resulting hybrids exhibited remarkable OER activities with a low onset potential (1.50 V versus RHE) and an overpotential of only 320 mV at 10 mA cm−2 in an alkaline medium (0.1 M KOH). The N‐MCN/CNT hybrids exhibited comparable catalytic performance, but better durability, compared with those of the Pt/C (20 wt%) catalyst for ORR. The demonstrated ultrahigh catalytic performance of the hybrids could originate from the large specific surface area (594.1 m2 g−1), high N content (10.7 at.%), and mesoporous structure for a full exposure of active sites, an improved capability for mass/electron transport, an easy adsorption/release of oxygen gas bubbles, and a high structural stability [133].
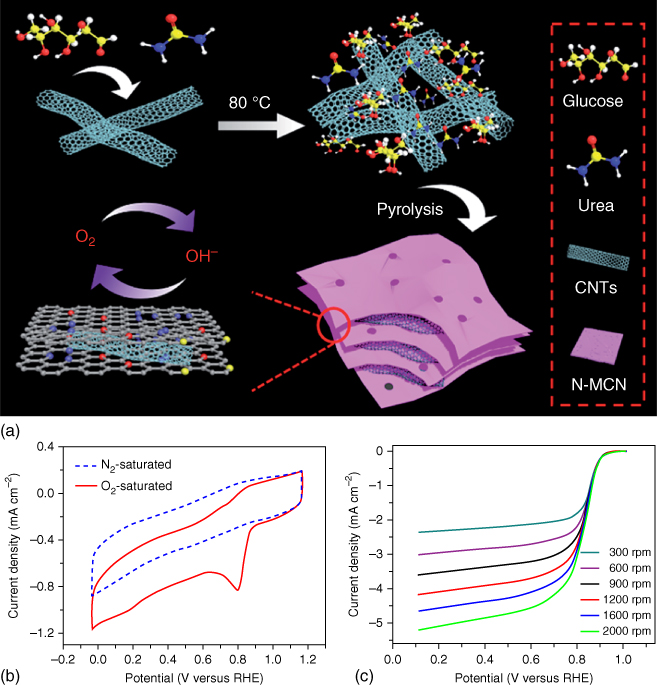


Figure 7.12 (a) Schematic for the synthesis of N‐MCN/CNTs and the corresponding structural model. (b) CVs of N‐MCN/CNTs at a scan rate of 50 mV s−1 in N2‐ or O2‐saturated 0.1 M KOH solution. (c) LSVs of N‐MCN/CNTs at the rotation rate of 300–2000 rpm. (d) Koutecky–Levich plots of N‐MCN/CNTs at the potentials of 0.20, 0.30, 0.40, 0.50, 0.60, and 0.70 V. (e) LSV comparison of N‐MCN/CNTs and Pt/C in an O2‐saturated 0.1 M KOH solution at a rotation rate of 1600 rpm. (f) LSVs for GCE and N‐MCN/CNTs at different mass loadings in O2‐saturated 0.1 M KOH solution. (g) LSVs of all catalysts. (h) Comparison of the overpotentials at 10 mA cm−2 of the catalysts. (i) Tafel plots of the above catalysts. (j) CP and CA plots of the N‐MCN/CNTs in O2‐saturated 0.1 M KOH solution. (k) LSVs of the N‐MCN/CNTs before and after 2000 cycles (inset (k) TEM of N‐MCN/CNTs after the stability test). (l) CP and CA plots of mixed N‐MCN + CNTs in O2‐saturated 0.1 M KOH solution. (m) CP and CA plots of IrO2 in O2‐saturated 0.1 M KOH solution.
Source: Li et al. 2016 [133]. Reproduced with permission from The Royal Society of Chemistry.
As can be seen above, C3N4‐based electrode performs well for both ORR and OER activities mostly in alkaline media (KOH). Heteroatom doping of C3N4 can further enhance the catalytic activities. Particularly, P‐doped C3N4 nanoflowers supported by a carbon fiber paper showed an ORR onset potential of −0.94 V and OER onset potential of 1.53 V [129]. Furthermore, P/S‐co‐doped C3N4 sponge sandwiched with C nanocrystals (P,S‐CNS) exhibited a high surface area (1474 m2 g−1) and superior ORR and OER bifunctional catalytic activities than those of Pt/C and RuO2, respectively, in terms of the limiting current density and onset potential (Figures 7.13 and 7.14) [47]. The resultant electrode exhibited an excellent suitability and durability as the oxygen cathode for primary and rechargeable Zn–air batteries. The resulting primary Zn–air battery showed a high open‐circuit voltage of 1.51 V, a high discharge peak power density of 198 mW cm−2, a specific capacity of 830 mAh g−1, and a better durability for 210 h after mechanical recharging. A small charge‐discharge voltage polarization of 0.80 V at 25 mA cm−2, good reversibility, and stability have also been observed for rechargeable Zn–air batteries in three‐electrode system. DFT analyses indicate that the excellent electrocatalytic performance of P,S‐CNS was attributable to the co‐doping‐induced efficient mass/charge transport and high conductivity of the C3N4/C composite, as indicated by energy diagrams in Figure 7.14 [47].
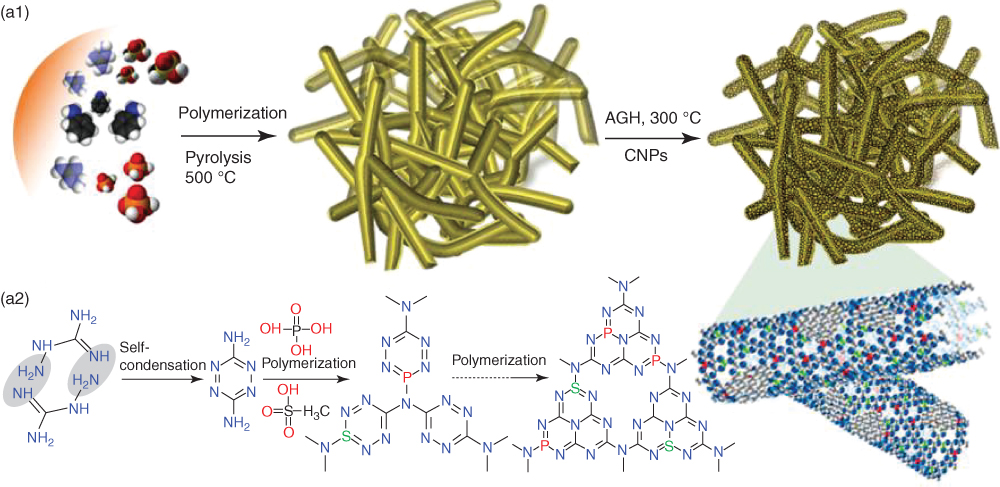

Figure 7.13 (a1) Schematics showing the synthesis of P,S‐CNS catalysts and (a2) the reaction mechanism for the formation of the C–N polymeric complex. (b) Photographs of as‐synthesized cylindrical sponge‐like P,S‐CNS structure. (c, d) SEM, (e) TEM, and (f) HRTEM images of P,SCNS catalyst (inset show enlarged view). (g) Corresponding FFT pattern of the crystallite in the inset of (f). (h) TEM and the elemental maps of C, N, P, and S of P,S‐CNS (scale, 300 nm).
Source: Shinde et al. 2017 [47]. Reproduced with permission from American Chemical Society.
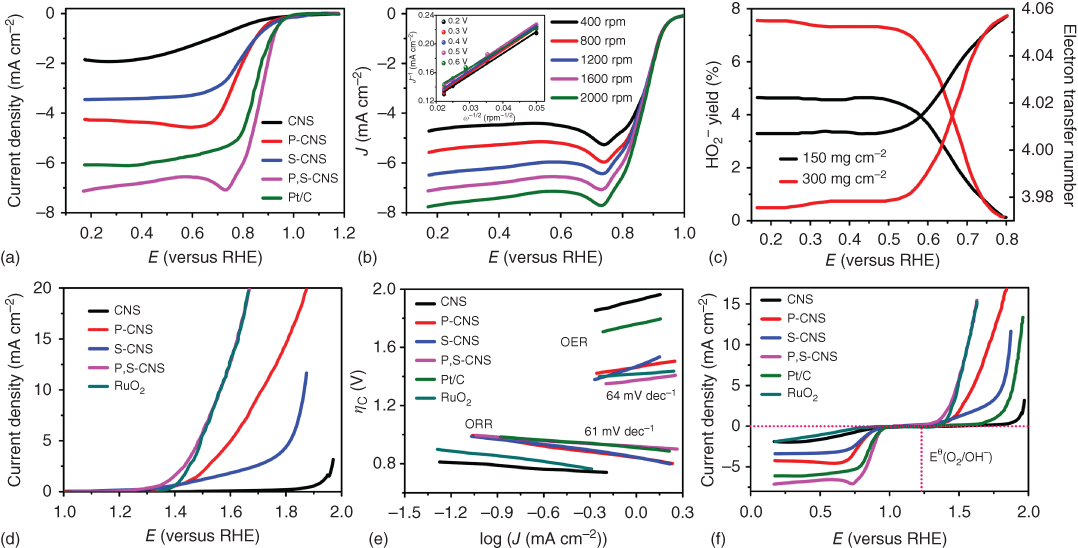

Figure 7.14 (a) LSV plots of ORR in O2‐saturated 0.1 M KOH electrolyte at 1600 rpm for different catalysts. (b) LSV curves of P,S‐CNS of ORR on various rotation speeds; the inset shows corresponding K–L plots on various voltages. (c) The HO2‐yield generated by ORR and calculated electron transfer number for P,S‐CNS catalysts. (d) LSV plots of the OER in 0.1 M KOH at 1600 rpm for different catalysts. (e) Tafel slopes for the ORR and OER. (f) LSV plots of the ORR and OER for different catalysts (scan rate, 5 mV s−1; electrolyte in 0.1 M KOH; rotation speed, 1600 rpm). Volcano plots of (g) OER and (h) ORR for P‐CNS, S‐CNS, and P,S‐CNS catalysts (overpotential η against difference between the adsorption energy of O* and OH* and adsorption energy of OH*). Standard free energy diagrams of P,S‐CNS for (i) OER pathway and (j) ORR pathway at equilibrium and different overpotentials.
Source: Shinde et al. 2017 [47]. Reproduced with permission from American Chemical Society.
The recent development of flexible and wearable electronics requires flexible power sources. However, flexible electrode fabrication for ORR and OER applications is still a big challenge. In this regard, the successful fabrication of a flexible, large‐area 3D porous N‐doped carbon microtube (NCMT) sponge via a simple and low‐cost process by pyrolyzing cotton is promising [134]. Due to its unique structure with a micron‐scale hollow core and well‐graphitized and interconnected porous walls, the NCMT sponge exhibited incomparable electrocatalytic activity for the ORR and OER with a small potential difference of 0.63 V between the OER current density at 10 mA cm−2 and the ORR current density at 3 mA cm−2 [134].
7.4 Carbon‐Based 3D Electrocatalysts for Hydrogen Evolutions Reaction (HER)
Despite its excellence as an emission‐free fuel, hydrogen is primarily produced from steam reforming of natural gas – a process that produces carbon dioxide emissions. In contrast, electrochemical reduction of water can produce H2 via HER with no harmful emission. However, Pt is required as the most active electrocatalyst for HER, and the high cost of Pt has hindered the large‐scale production of H2 from HER. Therefore, it is important to develop low‐cost and highly efficient electrocatalysts for HER, and carbon‐based catalysts have been demonstrated to be a promising alternative. As a result, much effort has been devoted to fabricate 2D carbon‐based HER catalysts [139–142], although 3D carbon architectures for HER activities are emphasized in recent development [143–150]. Nevertheless, certain heteroatom‐doped carbon materials have recently been shown to exhibit high promising catalytic activity and stability toward HER in acidic, basic, and neutral conditions.
Generally speaking, there are different mechanisms, Volmer/Heyrovsky/Tafel, for HER as shown below [141]:
The most sensitive factor, which influences HER rate, is the electrochemical balance between adsorption and desorption known as the Sabatier principle, generally presented by a “volcano plot” [140–142]. In cases where the substrate interaction is too inferior, the Volmer reaction is inhibited. If it is well strong, however, the Tafel/ Heyrovsky reaction is hindered. Therefore, a well‐maintained sorption on the catalyst surface is important and the interfacial property between the catalyst and electrolyte plays a crucial role in regulating the HER process. Therefore, the relative adsorption free energy of the H* intermediate acts as an indicator of the catalytic activity and is normally used to evaluate HER performance for a catalyst. Conway and Tilak [140] proposed a model for inspecting the surface coverage associated with underpotential deposition of hydrogen and formulated the difference in the Tafel slope for various mechanisms.
Table 7.5 summarizes 3D carbon‐based, heteroatom‐doped catalysts for HER [144–150]. N‐doped, plasma‐etched 3D graphene has demonstrated promising HER performance with −0.06 V (versus RHE) onset potential in acid (0.5 M H2SO4) electrolyte medium [146]. C3N4 networks with and without heteroatom doping have also been tested for HER in both acid and alkaline media [147, 148, 150]. In 0.5 M H2SO4 electrolyte, graphitic C3N4 nanoribbon network showed HER onset potential of −0.11 V (versus RHE) (Figures 7.15a–k), whereas P‐doped graphene and C3N4 composite catalyst demonstrated an onset potential of about −0.076 V (versus RHE) [147, 150]. Of particular interest, porous C3N4 nanolayers with nitrogen‐doped graphene sheets demonstrated the lowest onset potential of −0.008 V (versus 0 mV for Pt/C, versus RHE at 0.5 mA cm−2) in 0.5 M H2SO4 electrolyte [148]. The preparation and electrochemical results for this flexible, 3D porous carbon catalyst are given in Figures 7.15l–p [148], which show a high exchange current density of 0.43 mA cm−2, and remarkable durability (negligible activity loss >5000 cycles). Such excellent HER performance could stem from synergistic effects originating from (i) highly exposed active sites generated by introduction of in‐plane pores into C3N4 and exfoliation of C3N4 into nanosheets, (ii) hierarchical porous structure of the hybrid film, and (iii) 3D conductive graphene network [148]. Other 3D carbon HER catalysts include poly(3,4‐dinitrothiophene)/SWCNT composite [145] and N/P‐co‐doped carbon nanofiber network [149], as listed in Table 7.5 along with their analogs.
Table 7.5 Heteroatom‐doped, carbon‐based 3D catalysts for hydrogen evolution reaction (HER).
| Material | Method | Content and property | Electrolyte | Onset potential (V versus RHE) | V at 10 mA cm−2 and Tafel slope (mV dec−1) | Stability | References |
| Microporous graphitic NC framework | Condensation reaction of 1,2,4,5‐benzenetetramine tetrahydrochloride with octaketotetraphenylene aided by ZnCl2 | SA ∼ 928 m2 g−1 | 0.5 M H2SO4 | −0.26 | −0.44, 121 | — | [144] |
| Poly(3,4‐dinitrothiophene)/SWCNT composite | Yamamoto polymerization: SWNT + PDNT (41.9%) mixed into DMF, pyrolyzed at 70 °C, washed in acid | 1 M H2SO4 | −0.04 | −0.12, — | [145] | ||
| N‐doped, plasma‐etched 3D graphene | GO + dopamine hydrothermal treatment, pyrolysis (800 °C), Ar plasma etching for 20–30 min | N – 6.9 at.% |
0.5 M H2SO4 1 M KOH |
−0.06 −0.14 |
−0.13, 66 −0.22, 108 |
both ∼100% after 20 h | [146] |
| gC3N4 nanoribbon network | Autoclave of mixed suspension of g‐C3N4 and GO at 180 °C | ∼23.74 at.% | 0.5 M H2SO4 | −0.11 | −0.27, 54 | ∼130% after 15 h | [147] |
| Porous C3N4@N‐graphene | Cynamide + SiO2 spheres − hydrothermal treatment + GO + NH4OH, hydrazine reduction | N – 4.6 at.%, SA – 58 m2 g−1 | 0.5 M H2SO4 | −0.008 | −0.08, 49.1 | 86.3% after 5000 cycles | [148] |
| N/P–C nanofiber network | Electropolymerizing aniline (as N and C precursor) in the presence of phytic acid, pyrolysis | Electrochemical SA ∼ 325 mF cm−2 | 0.5 M H2SO4 | −0.08 | −0.15, 69 | ∼100% after 2000 cycles | [149] |
| P graphene–C3N4 hybrid | GO + triphenylphosphine, pyrolysis at 900 °C + dicyandiamide lyophilization, pyrolysis at 600 °C | N – 42.12, P – 2.12 at.%, SA – 119 m2 g−1 |
0.5 M H2SO4 0.5 M KOH |
−0.076 −0.62 |
−0.34, 90 — |
97.53% after 8.3 h — |
[150] |
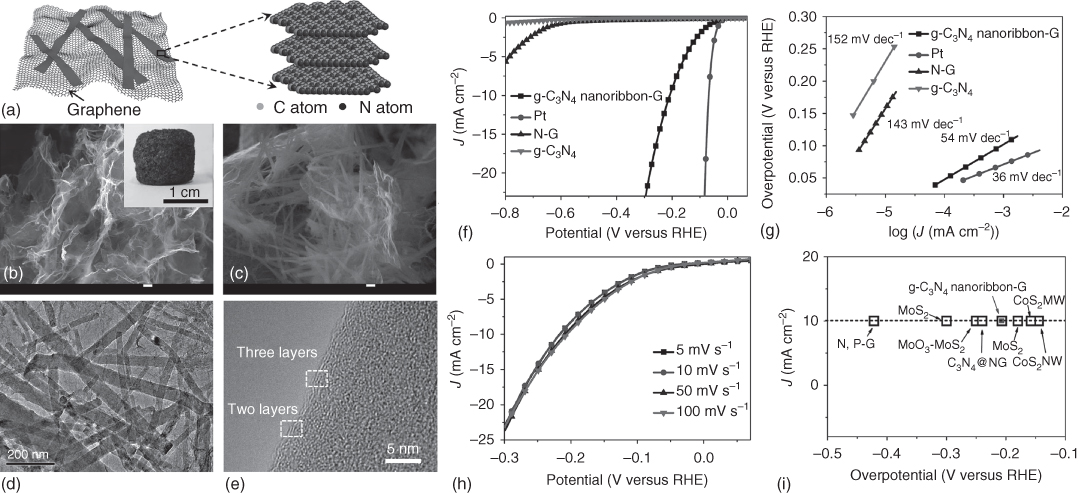
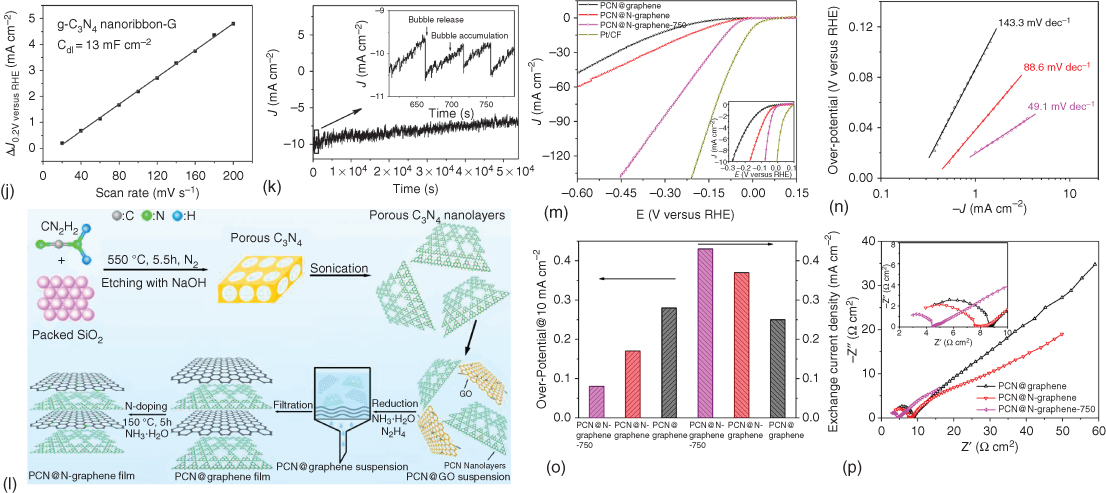
Figure 7.15 (a) g‐C3N4 nanoribbon‐G and a possible structural model of the g‐C3N4 nanoribbon. (b,c) SEM images of the prepared g‐C3N4 nanoribbon‐G. The inset of (b) is a photo of the as‐prepared g‐C3N4 nanoribbon‐G. (d) TEM images of the prepared g‐C3N4 nanoribbon‐G and (e) a typical high‐resolution TEM image of the g‐C3N4 nanoribbon. (f) The HER polarization curves and (g) the corresponding Tafel plots of various catalysts (g‐C3N4 nanoribbon‐G, Pt wire, N‐G, and g‐C3N4, respectively) with a scan rate of 50 mV s−1 in 0.5 M H2SO4. (h) The polarization curves of g‐C3N4 nanoribbon‐G with a scan rate from 5 to 100 mV s−1. (i) The HER current density at 10 mA cm−2 versus overpotential for various catalysts. (j) Plot showing the extraction of the double‐layer capacitance (Cdl) for g‐C3N4 nanoribbon‐G at 0.2 V. (k) Time dependence of the current density at 200 mV versus RHE. (l) Schematic illustration of the preparation process of PCN@N‐graphene film. (m) Polarization curves (inset shows polarization curves with current density below 10 mA cm−2). (n) Tafel plots at low potentials. (o) Overpotential at 10 mA cm−2 versus RHE (left) and exchange current density (right). (p) Electrochemical impedance spectra at −0.2 V versus RHE of PCN@graphene, PCN@N‐graphene, and PCN@N‐graphene‐750 films.
Source: Duan et al. 2015 [148]. Reproduced with permission from American Chemical Society.
Source: Zhao et al. 2014 [147]. Reproduced with permission from Wiley‐VCH Verlag GmbH & Co.
Along with the development of 3D carbon‐based bifunctional electrocatalysts for ORR–OER [10], bifunctional 3D carbon catalysts for ORR–HER or OER–HER have recently been under intensive investigation [151–154], as seen in Table 7.6. It is interesting to notice that activated carbon doped with N through pyrolysis in NH3 environment demonstrated both HER (onset potential −0.34 V versus RHE) and ORR (onset potential 0.882 V versus RHE) activities and stability (above 90%) in either acid or alkaline medium [151]. Compared with the single N‐doped carbon ORR–HER bifunctional catalysts, however, N/P‐co‐doped 3D carbon network, obtained through pyrolysis of GO, melamine and phytic acid supermolecular aggregate at 1000 °C, performed better HER activities with −0.14 V (versus RHE) onset potential in 0.5 M H2SO4 electrolyte, whereas it displayed 0.92 V onset potential versus RHE in 0.1 M KOH electrolyte [30, 153].
Table 7.6 Heteroatom‐doped, carbon‐based 3D catalysts for trifunctional activities toward oxygen reduction (ORR), oxygen evolution (OER), and hydrogen evolution reaction (HER).
| Material | Method | Content and property | Electrolyte | Onset potential (V versus RHE) | V at 10 mA cm−2 and Tafel slope (mV dec−1) | Stability | References |
| N‐activated C | Pyrolysis of activated C in NH3 flow at 500 °C for 3 h followed by calcination at 1050 °C for 2 h | N – 3.73 at.% |
0.5 M H2SO4 0.1 M KOH |
HER−0.34 ORR 0.882 |
0.34, 66 —, 57 |
∼100% and 90.6% after 20 000 s | [151] |
|
S‐C3N4/CNT/C fiber (HER) C3N4/CNT/C fiber (OER) |
Clean cotton cloth dipped into MWCNT suspension, soaking in melamine solution, and heating at 90 °C, calcined in Ar at 550 °C, heating with S powder at 450 °C | SA – 53.7 m2 g−1 |
0.5 M H2SO4 1 M KOH |
HER −0.15 OER 1.52 |
0.236, 81.6 1.6, 45 |
88.3$ after 12 h 89.6% after 14 h |
[152] |
| N/P C network | Melamine–phytic acid supermolecular aggregate + GO, pyrolysis at 1000 °C |
N ∼ 3 and P ∼ 2.2 at.%, SA – 375 m2 g−1 |
0.5 M H2SO4 0.1 M KOH |
HER −0.14 ORR 0.92 |
−0.16, 89 3.5 e |
∼96% after 4 h — |
[153] |
| N/P/O‐porous C | Hydrothermal treatment of acid‐oxidized carbon cloth + aniline + phytic acid + ammonium persulfate, pyrolysis at 1000 °C for 2 h in N2 | N – 0.46, P – 0.32, and O – 16.4 at.% |
1 M KOH 1 M KOH 0.5 M H2SO4 |
HER −0.4 OER 1.64 HER −0.33 OER 1.7 |
−0.45, 154 1.65, 84 −0.39, 109 1.7, 200 |
∼95%, 5 h ∼97%, 5 h ∼80%, 5 h ∼90%, 5 h |
[154] |
Among 3D bifunctional catalysts for HER and OER, carbon fiber/CNT/C3N4 composite and N/P/O‐tri‐doped porous carbon materials are particularly promising [152, 154]. Figure 7.16 shows the synthetic scheme and electrochemical evaluation for homologous carbon‐based, metal‐free electrolyzer composed of C3N4–CNT–CF and S–C3N4–CNT–CF as OER and HER bifunctional catalysts in both basic and acidic media [152]. The well‐designed structure with the hierarchical 3D conductive CNT–CF network improved the charge transport ability and facilitated the electrolyte penetration of the electrodes. The high dispersion and longtime stability of layered C3N4 ensured the excellent OER electrocatalytic activities (1.52 V onset potential versus RHE in 1 M KOH), and subsequent sulfur doping improved the HER performance of the C3N4‐based electrode with −0.15 V onset potential versus RHE in 0.5 M H2SO4 electrolyte [152]. This 3D metal‐free bifunctional carbon catalyst exhibited high catalytic ability, low onset potential, and longtime duration in various pH environments, thus promoting self‐supported metal‐free systems for efficient, low‐cost, and environment‐friendly water splitting [152]. The N/P/O‐tri‐doped, carbon‐based catalyst performed HER and OER activities both in acid (0.5 M H2SO4) and alkaline (1 M KOH) media, as seen in Table 7.6 [154]. Compared with bifunctional electrocatalysts, the development of tri/multifunctional carbon catalysts is still in infancy. However, continued research in this area would be of value.
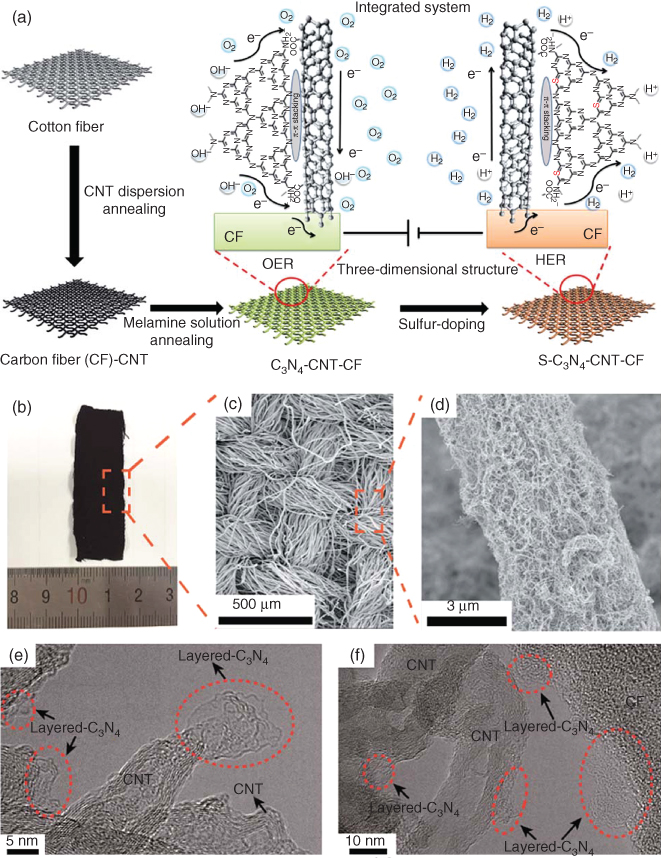

Figure 7.16 (a) Schematic illustration of the synthesis process of the self‐supported, C3N4‐based, metal‐free electrolyzer, (b) digital photograph, (c, d) SEM images, and (e and f) HRTEM images of the C3N4‐CNT‐CF electrode, (g) LSV and (h) Tafel curves of CNT‐CF, C3N4‐CF, C3N4‐CNT‐CF, S‐C3N4‐CNT‐CF, and Pt in 0.5 M H2SO4 at 5 mV s−1; (i) chronopotentiometric response of S‐C3N4‐CNT‐CF in 0.5 M H2SO4; (j) LSV curve of S‐C3N4‐CNT‐CF in 1 M KOH at 5 mV s−1 (inset: the corresponding Tafel slope); (k) LSV curves and (l) corresponding Tafel plots of C3N4, CNT‐CF, and C3N4‐CNT‐CF in 1 M KOH aqueous solution at 5 mV s−1, (m) Nyquist plots of CNT‐CF and C3N4‐CNT‐CF in 1 M KOH with a bias of 1.63 V, inset: the equivalent circuit diagram and (n) the duration test of the C3N4‐CNT‐CF electrode at a potential of 1.63 V.
Source: Peng et al. 2016 [152]. Reproduced with permission from The Royal Society of Chemistry.
7.5 Carbon‐Based 3D Electrocatalysts for Carbon Dioxide Reduction Reaction (CO2RR)
Electrochemical conversion of CO2 into energy‐rich fuels and chemicals has recently attracted intensive research interest. In this reduction process, CO2 is recycled and closed loop of fuel combustion and waste CO2 reduction mitigate greenhouse gas in the atmosphere. At the same time, intermittent electricity generation can be stored in an energy‐dense, portable form in chemical bonds. However, the structural stability of CO2 molecules makes its conversion kinetically challenging, which requires a large overpotential. Therefore, the related electrochemical reduction efficiency strongly depends on the activity and selectivity of the cathodic electrocatalyst. Numerous heterogeneous catalysts have been examined with an emphasis to increase catalytic activity and product selectivity, although the CO2 reduction mechanism remains not fully understood. Figure 7.17 indicates the increasing trend in electrochemical and photoelectrochemical CO2 reduction efforts [155, 156].
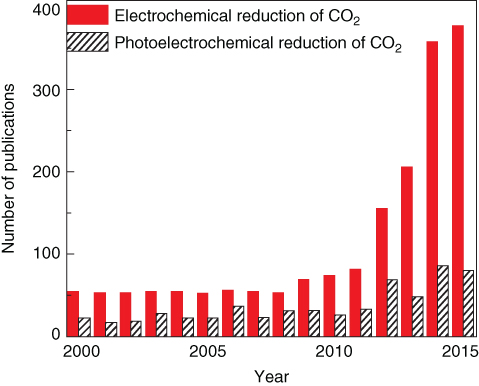
Figure 7.17 Publications per year on photocatalytic and electrochemical reduction of CO2.·The data were extracted from the ISI Web of Science (search: Topic = electrochemical reduction of CO2, photoelectrochemical reduction of CO2).
Source: Kumar et al. 2016 [155]. Reproduced with permission from Elsevier.
The thermodynamic redox potentials for different possible CO2 reduction half reactions leading to different products are given in Table 7.7. These half reaction potentials only reflect the minimum thermodynamic potential to enable the reaction and depend on the electrolyte media as well. However, the reaction kinetics, including the activation energy, reaction rate, and mechanistic pathway cannot be forecast by the thermodynamic potentials alone.
Table 7.7 The electrode potentials for electrochemical CO2 reduction half reactions in aqueous solution at standard experimental conditions.
Source: Kumar et al. 2016 [155]. Reproduced with permission from Elsevier.
| Electrochemical thermodynamic half reaction | Electrode potentials (V versus SHE) under standard conditions |
| CO2(g) + 4H+ + 4e− → C(s) + 2H2O (l) | 0.210 |
| CO2(g) + 2H2O(l) + 4e− → C(s) + 4OH | −0.627 |
| CO2(g) + 2H+ + 2e− → HCOOH(l) | −0.250 |
| CO2(g) + 2H2O(l) + 2e− → HCOO−(aq) + OH− | −1.078 |
| CO2(g) + 2H+ + 2e− → CO(g) + H2O(l) | −0.106 |
| CO2(g) + 2H2O(l) + 2e− → CO(g) + 2OH− | −0.934 |
| CO2(g) + 4H+ + 4e− → CH2O(l) + 4OH− | −0.898 |
| CO2(g) + 6H+ + 6e− → CH3OH(l) + H2O(l) | 0.016 |
| CO2(g) + 5H2O(l) + 6e− → CH3OH(l) + 6OH− | −0.812 |
| CO2(g) + 8H+ + 8e− → CH4(g) + H2O(l) | 0.169 |
| CO2(g) + 6H2O(l) + 8e− → CH4(g) + 8OH− | −0.659 |
| 2CO2(g) + 2H+ + 2e− → H2C2O2(aq) | −0.500 |
| 2CO2(g) + 2e− → C2O42−(aq) | −0.500 |
| 2CO2(g) + 12H+ + 12e− → CH2CH2(g) + 4H2O(l) | 0.064 |
| 2CO2(g) + 8H2O(l) + 12e− → CH2CH2(g) + 12OH− | −0.764 |
| 2CO2(g) + 12H+ + 12e− → CH2CH2OH(l) + 3H2O(l) | 0.084 |
| 2CO2(g) + 9H2O(l) + 12e− → CH2CH2OH(l) + 12OH− | −0.744 |
Generally speaking, CO2 reduction competes with the HER, which also occurs at a comparable thermodynamic potential. Therefore, ideal electrocatalysts for CO2 reduction should minimize the activation barrier for CO2RR relative to HER, driving CO2 reduction selectively at low overpotential with high reaction rates (i.e. currents) [155–158]. The mechanism and relative energy requirement of photocatalytic CO2RR on a semiconductor photocatalyst surface can be well understood, as described in Figure 7.18.
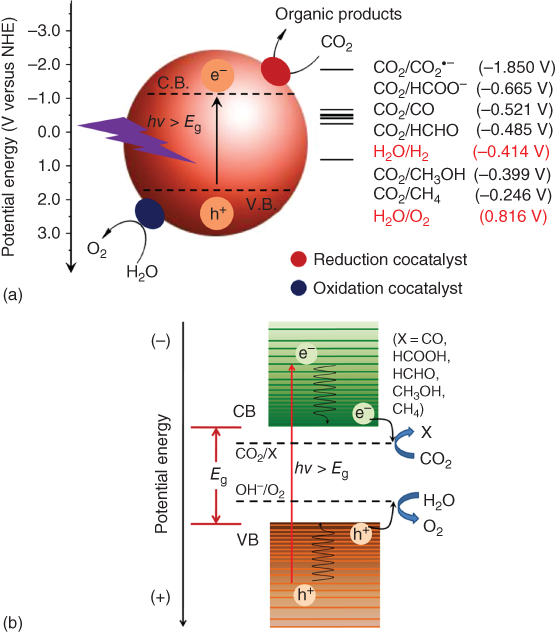
Figure 7.18 (a) Schematic illustration of mechanism and (b) relative energy levels of photocatalytic reduction of CO2 on a semiconductor photocatalyst.
Source: Lingampalli et al. 2017 [156]. Reproduced with permission from American Chemical Society.
In comparison with bulk metal (e.g. Ag) catalysts, carbon nanofibers comprising N‐doped graphitic layers showed more than an order of magnitude higher CO2 reduction current density under identical conditions (Figures 7.19a–g) [31]. It has been demonstrated that CO2RR occurs primarily at reduced carbon sites rather than the electronegative nitrogen atoms in these heteroatom‐doped graphitic catalysts. Another key advantage for the N‐doped carbon nanofibers is its extended stability without significant decay in the catalytic activity even in acidic media, as evidenced by the long‐term performance and unchanged density of pyridinic nitrogen atoms. In another study, N‐doped CNTs exhibited a very low overpotential (0.18 V) for CO2RR with a maximum faradaic efficiency for CO of 80% at −1.05 V versus the cell potential [160] and was stable even after 10 h continued operation. The observed outstanding CO2RR activity was attributed to the high electrical conductivity of N‐doped CNTs, in which the pyridinic‐N atoms increased local active sites and lowered the free energy for CO2 activation due to a lone‐pair of electrons at pyridinic defects [160]. Alternatively, CO2RR can also be performed with boron‐doped graphene [161] or N‐doped CNTs decorated with polyethylenimine macromolecules, which acted as a cocatalyst and reduced CO2 to formate at high current density and selectivity at low overpotentials [162]. N‐doped nanodiamond has even been tried as CO2RR catalyst to produce acetate, preferentially over formate, with an onset potential of −0.36 V versus RHE and up to ∼78% faradaic efficiency [163]. These results indicate the applicability of nonmetallic catalysts for the formation of higher (C2+) carbon products by CO2RR.
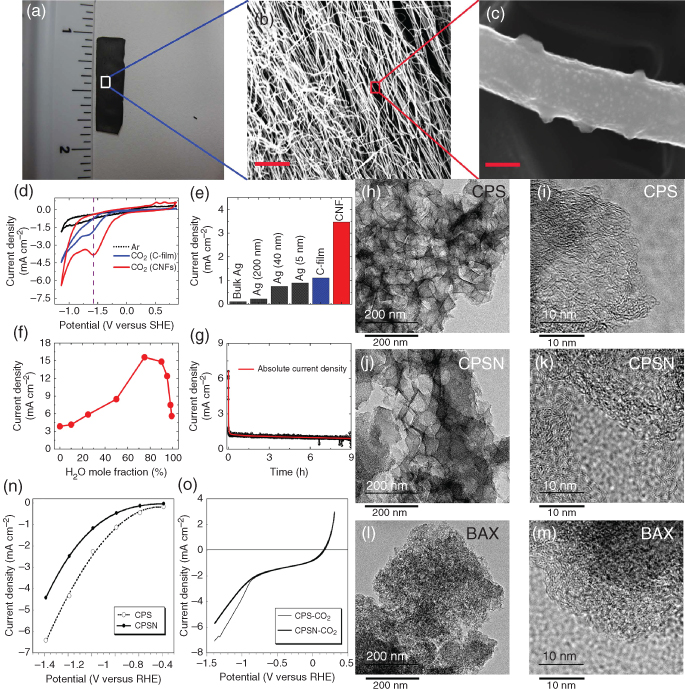
Figure 7.19 (a) Digital image of CNF mat used as catalyst, (b) SEM image of the CNF mat displaying entangled fibers (scale bar, 5 mm), and (c) high‐resolution SEM image on individual fibers (scale bar, 200 nm). Random corrugations are visible at the fiber surface. Catalytic performance of CNFs for CO2 reduction: (d) CVs for CO2 reduction in the Ar‐saturated (black curve) and CO2‐saturated pure EMIM‐BF4 on carbon film electrode (blue curve) and CNFs electrode (red curve), respectively (10 mV s−1). (e) Absolute current density for CO2RR at different electrodes in pure EMIM‐BF4 electrolyte, (f) current density (at the highest CO2RR) for CNFs catalyst with respect to water mole fraction (%) in EMIM‐BF4, (g) chronoamperogram for CNFs catalyst at potential 0.573 V versus SHE in pure EMIM‐BF4 (10 mV s−1). HR‐TEM images of (h, i) S‐doped and (j, k) S,N‐doped polymer‐derived carbons and (l, m) wood‐based activated carbon. (n) Stationary CO2 reduction current densities and (o) LSV of CO2 reduction on CPS and CPSN (conditions: CO2‐saturated 0.1 m KHCO3, 2.5 mg cm−2 catalyst loading).
Source: Li et al. 2016 [159]. Reproduced with permission from Wiley‐VCH Verlag GmbH & Co.
Source: Kumar et al. 2013 [31]. Reproduced with permission from Macmillan Pub. Ltd.
Furthermore, S‐doped (CPS) and S,N‐co‐doped polymer‐derived 3D carbon (CPSN) catalysts were also examined for CO2RR in aqueous solutions, in which CPSN showed better catalytic performance compared with CPS for the formation of CO (11.3%) and CH4 (0.18%) at a potential of −0.99 V (versus RHE) (Figures 7.19h–o) [159]. It was revealed that the better catalytic activity of CPSN is due to increase in active sites (nitrogen‐based) and the basic surface. It has been proposed that the pyridinic group (negative charge) facilitated electron transfer for conversion of CO2 to COOH intermediate, which underwent further reduction to form CO [159]. As far as the published work on CO2RR is concerned, it would be unfair to comment that not much has yet been achieved in this area. There remains, however, much work to do.
7.6 Carbon‐Based 3D Electrocatalysts for H2O2 Reduction (HPRR)
Hydrogen peroxide (H2O2) is becoming significant due to its potential applications in various sectors, including analytical chemistry, biomedical sensing, and energy conversion. Despite few reports, proper understanding and development of efficient carbon‐based catalysts for HPRR are still at nascent stage [164–169]. So far, the catalysts developed for HPRR are mainly focused on nitrogen‐doped and/or N/S‐co‐doped graphene materials [164, 168, 169]. Figure 7.20 shows the morphology and electrochemical performance for a metal‐free “graphene alloy” developed from reduced graphene oxide (NS‐rGO) co‐doped with N/S via a simple one‐step thermal annealing procedure using a mixture of 5‐amino‐2‐mercapto‐1,3,4‐thiadiazole (AMT) and GO [169]. The obtained metal‐free NS‐rGO composite showed better electrocatalytic activity toward the HPRR compared with rGO. The enhanced performance was attributed to the synergistic effect of N and S co‐doping and high electrical conductivity [169]. The DFT investigation on N graphene for HPRR has revealed that adsorption of H2O2 on the N graphene and pristine graphene surface was classified as physisorption and occurred through a weak interaction without the formation of a chemical bond [168]. When H+ was introduced into the system, a series of electron transformation processes for the H2O2 reduction reaction occurred spontaneously, including the breakage of the OO bond, the formation of an OC chemical bond between oxygen and graphene, and the creation of water molecules. The calculations of the relative energy for each of the reaction steps and the value of the onset potential for H2O2 reduction reaction suggested that the reactivity of the pristine and N‐doped graphene has the following order: pyridinic‐N graphene > pyrrolic‐N graphene > graphitic‐N graphene > pristine graphene [168]. Figure 7.20f shows the relative energy levels and configurations of the reaction intermediates for HPRR onto N graphene. The overall HPRR can be expressed by the following equation [168]: H2O2 + 2H+ + 2e− → 2H2O (1.763 V versus SCE).

Figure 7.20 SEM images of (a) rGO and (b) and NS‐rGO. (c) CV curves of 5.0 mM H2O2 obtained at GCE, rGO/GCE, and NS‐rGO/GCE in N2‐saturated 0.1 M PBS (pH 7.0) with a scan rate of 50 mV s−1 (scale bar, 5 mm), (d) CV curves of 5 mM H2O2 in 0.1 M PBS (pH 7.0) solution for different volumes of the dropped suspension (5, 7.5, 10, and 11.25 μl). (e) Plot of cathodic peak current of H2O2 versus volume of the dropped suspension. (f) Illustration of the relative energy and configurations for the reaction intermediates (showing only part of the N graphene) in reaction paths I and II of the H2O2 reduction process on the pyridinic‐N‐doped graphene surface. The indicated values are the relative energies for each step of the reaction system.
Source: Wu et al. 2013 [168]. Reproduced with permission from The Royal Society of Chemistry.
Source: Zhang et al. 2017 [169]. Reproduced with permission from Elsevier.
7.7 Conclusions and Perspectives
As can be seen from the above discussions, various heteroatom‐doped or co‐doped or even tri‐doped carbon‐based, 3D catalysts with excellent electrocatalytic properties have been developed to replace noble or non‐precious metal‐based electrocatalysts for various redox reactions important to energy conversion and storage, such as ORR, OER, HER, CO2RR, and HPRR. Heteroatom‐doping‐induced enhancement in electrochemical efficiency of these catalysts can be attributed to doping‐induced synergistic effects, improvement in conducting and transport properties, modulation in electronic band structure, charge transfer, and also improvement in interfacial interaction between the catalyst surface and electrolyte/reactant molecules. Most of the reported carbon‐based 3D catalysts are simple agglomeration/composite of 2D carbon allotropes, including graphene oxide, graphene flakes, CNT/buckypapers, carbon fiber, nanoribbons, and onion‐like carbons, without structural continuity and mechanical stability. In this respect, isotropic 3D carbon structures with hierarchically porous architectures are attractive for electrocatalytic applications, although they are difficult to make. The 3D porous carbon framework could not only provide an ideal backbone support with a large surface area for catalytically active sites and a multidimensional conductive network for efficient electron transport but also provide a large space to accommodate the electrolyte/reactant diffusion and an excellent mechanical stability. Templated chemical vapor deposition or metal‐oxide framework (MOF)‐derived 3D carbon materials could perform attractive electrochemical activities; however, their abundant structural interfaces increase the overall resistance within the fabricated 3D carbon catalyst electrodes and the related mechanical reliability is often poor. Therefore, much more research effort is required to design and develop cost‐effective 3D carbon‐based electrocatalysts with well‐defined structures and properties toward a commercial success for clean and renewable energy technologies, which has long been hindered by the production cost, scarcity of precious and even non‐precious metal catalysts, and the intrinsically associated environmental concerns. With all the high‐performance carbon‐based, metal‐free electrocatalysts already reviewed in this chapter, and many more to be developed, we are confident about their widespread applications for energy conversion and storage in near future with commercial success.
Acknowledgments
We thank our colleagues for their contributions to the work cited. We are also grateful for financial support from NSF (CMMI‐1400274, DOD‐AFOSR‐MURI (FA9550‐12‐1‐0037), NASA (NNX16AD48A, NNC16CA42C), Key Program of National Natural Science Foundation of China (51732002, 51433005), and The National Key Research and Development Program of China (2017YFA0206500).
References
- 1. Zhu, Y., Zhou, W., Yu, J. et al. (2016). Chem. Mater. 28: 1691–1697.
- 2. Nakayama, M., Fujii, Y., Fujimoto, K. et al. (2016). RSC Adv. 6: 23377.
- 3. Yeo, B.S. and Bell, A.T. (2011). J. Am. Chem. Soc. 133: 5587–5593.
- 4. Moniz, S.J.A., Shevlin, S.A., Martin, D.J. et al. (2015). Energy Environ. Sci. 8: 731.
- 5. Solomon, S., Plattner, G.K.G., Knutti, R., and Friedlingstein, P. (2009). Proc. Natl. Acad. Sci. U.S.A. 106: 1704–1709.
- 6. Primio, R.D., Horsfield, B., and Vega, M.G. (2000). Nature 406: 173–176.
- 7. Maeda, K. and Domen, K. (2010). J. Phys. Chem. Lett. 1: 2655–2661.
- 8. Cheng, F.Y. and Chen, J. (2012). Chem. Soc. Rev. 41: 2172–2192.
- 9. Li, Y.G. and Dai, H.J. (2014). Chem. Soc. Rev. 43: 5257–5275.
- 10. Zhang, J., Zhao, Z., Xia, Z., and Dai, L. (2015). Nature Nanotech. 10: 444–452.
- 11. Zhang, J., Li, H., Guo, P. et al. (2016). J. Mater. Chem. A 4: 8497–8511.
- 12. Shinagawa, T., Garcia‐Esparza, A.T., and Takanabe, K. (2015). Sci. Rep. 5: 13801.
- 13. Lavacchi, A., Miller, H., and Vizza, F. (2013). Nanotechnology in Electrocatalysis for Energy, 25–61. New York: Springer.
- 14. Li, Y., Zhou, W., Wang, H. et al. (2012). Nat. Nanotechnol. 7: 394–400.
- 15. Wang, D.W. and Su, D. (2014). Energy Environ. Sci. 7: 576–591.
- 16. Shao, M., Chang, Q., Dodelet, J.P., and Chenitz, R. (2016). Chem. Rev. 116: 3594–3657.
- 17. Ohmori, T., Takahashi, H., Mametsuka, H., and Suzuki, E. (2000). Phys. Chem. Chem. Phys. 2: 3519–3522.
- 18. Kanan, M.W. and Nocera, D.G. (2008). Science 321: 1072–1075.
- 19. Goux, A., Pauporte, T., and Lincot, D. (2006). Electrochim. Acta 51: 3168–3172.
- 20. Seaboldand, J.A. and Choi, K.S. (2011). Chem. Mater. 23: 1105–1112.
- 21. Li, X., Walsh, F.C., and Pletcher, D. (2011). Phys. Chem. Chem. Phys. 13: 1162–1167.
- 22. Dai, L. (2017). Cur. Opin. Electrochem. doi: https://doi.org/10.1016/j.coelec.2017.06.004.
- 23. Wu, J., Xue, Y., Yan, X. et al. (2012). Nano Res. 5: 521–530.
- 24. Gong, K., Du, F., Xia, Z. et al. (2009). Science 323: 760–764.
- 25. Shui, J., Wang, M., Du, F., and Dai, L. (2015). Sci. Adv. 1: e1400129.
- 26. Liu, X. and Dai, L. (2016). Nat. Rev. Mater. 1: 16064.
- 27. Zhao, Y., Nakamura, R., Kamiya, K. et al. (2013). Nat. Commun. 4: 2390.
- 28. Zheng, Y., Jiao, Y., Li, L.H. et al. (2014). ACS Nano 8: 5290–5296.
- 29. Liu, J., Liu, Y., Liu, N. et al. (2015). Science 347: 970–974.
- 30. Zhang, J., Qu, L., Shi, G. et al. (2016). Angew. Chem. Int. Ed. 55: 2230–2234.
- 31. Kumar, B., Asadi, M., Pisasale, D. et al. (2013). Nat. Commun. 4: 2189.
- 32. Zhang, J. and Dai, L. (2016). Angew. Chem. Int. Ed. 55: 13296–13300.
- 33. Hu, C. and Dai, L. (2017). Adv. Mater. 29: 1604942.
- 34. Shehzad, K., Xu, Y., Gao, C., and Duan, X. (2016). Chem. Soc. Rev. 45: 5541–5588.
- 35. Wu, Z.Y., Liang, H.W., Chen, L.F. et al. (2016). Acc. Chem. Res. 49: 96–105.
- 36. Zhang, J., Zhao, F., Zhang, Z. et al. (2013). Nanoscale 5: 3112–3126.
- 37. Pawlak, R., Kawai, S., Fremy, S. et al. (2012). J. Phys. Condens. Matter 24: 084005.
- 38. Odom, T.W., Huang, J.L., Kim, P., and Lieber, C.M. (1998). Nature 391: 62–64.
- 39. Yu, T.Q., Jauregui, L.A., Wu, W. et al. (2011). Nat. Mater. 10: 443–449.
- 40. Du, F., Yu, D., Dai, L. et al. (2011). Chem. Mater. 23: 4810–4816.
- 41. Xue, Y., Ding, Y., Niu, J. et al. (2015). Sci. Adv. 1: 1400198.
- 42. Chen, L., Du, R., Zhu, J. et al. (2015). Small 11 (12): 1423–1429.
- 43. Zheng, Y., Jiao, Y., Jaroniec, M. et al. (2012). Small 8 (23): 3550–3566.
- 44. Dai, L., Xue, Y., Qu, L. et al. (2015). Chem. Rev. 115: 4823–4892.
- 45. Zheng, Y., Liu, J., Liang, J. et al. (2012). Energy Environ. Sci. 5: 6717–6731.
- 46. Tang, J., Liu, J., Torad, N.L. et al. (2014). Nano Today 9: 305–323.
- 47. Shinde, S.S., Lee, C.H., Sami, A. et al. (2017). ACS Nano 11 (1): 347–357.
- 48. Andersson, M., Beale, S.B., Espinoza, M. et al. (2016). Appl. Energy 180: 757–778.
- 49. Yeager, E. (1986). J. Mol. Catal. 38: 5–25.
- 50. Bard, A.J. and Faulkner, L.R. (1980). Electrochemical Methods: Fundamentals and Applications. New York: Wiley.
- 51. Lee, J.S., Jo, K., Lee, T. et al. (2013). J. Mater. Chem. A 1: 9603–9607.
- 52. Yang, Y. and Chang, H. (2017). J. Mat. Res. doi: 10.1557/jmr.2017.372.
- 53. Li, H., Kang, W., Wang, L. et al. (2013). Carbon 54: 249–257.
- 54. Zhou, X., Bai, Z., Wu, M. et al. (2015). J. Mater. Chem. A 3: 3343–3350.
- 55. Men, B., Sun, Y., Li, M. et al. (2016). ACS Appl. Mater. Interfaces 8: 1415–1423.
- 56. Lin, Z., Waller, G.H., Liu, Y. et al. (2013). Nano Energy 2: 241–248.
- 57. Liu, R.L., Wu, D.Q., Feng, X.L., and Mullen, K. (2010). Angew. Chem. Int. Ed. 49: 2565–2569.
- 58. Jin, H., Zhang, H., Zhong, H., and Zhang, J. (2011). Energy Environ. Sci. 4: 3389–3394.
- 59. Wohlgemuth, S.A., Fellinger, T.P., Jaker, P., and Antonietti, M. (2013). J. Mater. Chem. A 1: 4002–4009.
- 60. Ito, Y., Qiu, H.J., Fujita, T. et al. (2014). Adv. Mater. 26: 4145–4150.
- 61. Tao, G., Zhang, L., Chen, L. et al. (2015). Carbon 86: 108–117.
- 62. Guo, Q., Zhao, D., Liu, S. et al. (2014). Electrochim. Acta 138: 318–324.
- 63. Liu, J., Cunning, B.V., Daio, T. et al. (2016). Electrochim. Acta 220: 554–561.
- 64. Jin, H., Li, J., Chen, F. et al. (2016). Electrochim. Acta 222: 438–445.
- 65. Zhou, X., Tang, S., Yin, Y. et al. (2016). Appl. Energy 175: 459–467.
- 66. Tang, S., Zhou, X., Xu, N. et al. (2016). Appl. Energy 175: 405–413.
- 67. Hu, W., Yoshida, N., Hirota, Y. et al. (2017). Electrochem. Commun. 75: 9–12.
- 68. Liang, H.W., Wu, Z.Y., Chen, L.F. et al. (2015). Nano Energy 11: 366–376.
- 69. Song, L.T., Wu, Z.Y., Liang, H.W. et al. (2016). Nano Energy 19: 117–127.
- 70. Hu, C., Xiao, Y., Zhao, Y. et al. (2013). Nanoscale 5: 2726–2733.
- 71. Yu, D., Wei, L., Jiang, W. et al. (2013). Nanoscale 5: 3457–3464.
- 72. Ding, W., Li, L., Xiong, K. et al. (2015). J. Am. Chem. Soc. 137: 5414–5420.
- 73. Liang, H.W., Zhuang, X., Bruller, S. et al. (2014). Nat. Commun. 5: 4973.
- 74. Xuan, C., Wu, Z., Lei, W. et al. (2017). Chem. Cat. Chem. 9: 809–815.
- 75. Wu, M., Wang, K., Yi, M. et al. (2017). ACS Catal. 7: 6082–6088.
- 76. Eisenberg, D., Stroek, W., Geels, N.J. et al. (2016). Phys. Chem. Chem. Phys. 18: 20778–20783.
- 77. Li, L., Dai, P., Gu, X. et al. (2017). J. Mater. Chem. A 5: 789–795.
- 78. Fu, Y., Tian, C., Liu, F. et al. (2016). Nano Res. 9 (11): 3364–3376.
- 79. Wen, Z., Ci, S., Hou, Y., and Chen, J. (2014). Angew. Chem. 126: 6614–6618.
- 80. Wang, Y., Liu, H., Wang, K. et al. (2017). Appl. Catal., B 210: 57–66.
- 81. Yu, D., Zhou, L., Tang, J. et al. (2017). Ind. Eng. Chem. Res. 56: 8880–8887.
- 82. Yang, H.B., Miao, J., Hung, S.F. et al. (2016). Sci. Adv. 2: e1501122.
- 83. Zheng, Y., Jiao, Y., Chen, J. et al. (2011). J. Am. Chem. Soc. 133 (50): 20116–20119.
- 84. Wu, X., Li, S., Wang, B. et al. (2017). Microporous Mesoporous Mater. 240: 216–226.
- 85. Liang, J., Zheng, Y., Chen, J. et al. (2012). Angew. Chem. 124: 3958–3962.
- 86. Fu, X., Hu, X., Yan, Z. et al. (2016). Chem. Commun. 52: 1725–1728.
- 87. Tian, J., Ning, R., Liu, Q. et al. (2014). ACS Appl. Mater. Interfaces 6: 1011–1017.
- 88. Seredych, M., László, K., Castellón, E.R., and Bandosz, T.J. (2016). J. Energ. Chem. 25: 236–245.
- 89. Chen, L., Cui, X., Wang, Y. et al. (2014). Dalton Trans. 43: 3420–3423.
- 90. Seredych, M., Laszlo, K., and Bandosz, T.J. (2015). Chem. Cat. Chem. 7: 2924–2931.
- 91. Su, Y., Zhang, Y., Zhuang, X. et al. (2013). Carbon 62: 296–301.
- 92. Jiang, S., Sun, Y., Dai, H. et al. (2015). Electrochim. Acta 174: 826–836.
- 93. Wu, H., Shi, L., Lei, J. et al. (2016). J. Power Sources 323: 90–96.
- 94. Gao, S., Liu, H., Geng, K., and Wei, X. (2015). Nano Energy 12: 785–793.
- 95. Wu, Z., Liu, R., Wang, J. et al. (2016). Nanoscale 8: 19086–19092.
- 96. Wohlgemuth, S.A., White, R.J., Willinger, M.G. et al. (2012). Green Chem. 14: 1515–1523.
- 97. Wu, M., Qiao, J., Li, K. et al. (2016). Green Chem. 18: 2699–2709.
- 98. Huang, Z., Zhou, H., Yang, W. et al. (2017). Chem. Cat. Chem. 9 (6): 987–996.
- 99. Sahoo, M. and Ramaprabhu, S. (2017). Energy 119: 1075–1083.
- 100. Fu, S., Zhu, C., Song, J. et al. (2017). Nano Res. 10 (6): 1888–1895.
- 101. Wang, Z., Cao, X., Ping, J. et al. (2015). Nanoscale 7: 9394–9398.
- 102. You, B., Kang, F., Yin, P., and Zhang, Q. (2016). Carbon 103: 9–15.
- 103. Xu, C., Su, Y., Liu, D., and He, X. (2015). Phys. Chem. Chem. Phys. 17: 25440–25448.
- 104. Patil, I.M., Lokanathan, M., and Kakade, B. (2016). J. Mater. Chem. A 4: 4506–4515.
- 105. Jiang, H., Zhu, Y., Feng, Q. et al. (2014). Chem. Eur. J. 20: 3106–3112.
- 106. Wang, J., Wu, Z.X., Han, L.L. et al. (2016). Chin. Chem. Lett. 27: 597–601.
- 107. Jiang, H., Wang, Y., Hao, J. et al. (2017). Carbon 122: 64–73.
- 108. Qiu, Y., Xin, L., Jia, F. et al. (2016). Langmuir 32: 12569–12578.
- 109. Fu, S., Zhu, C., Song, J. et al. (2017). Chem. Eur. J. 23: 10460–10464.
- 110. Zhao, Y., Huang, S., Xia, M. et al. (2016). Nano Energy 28: 346–355.
- 111. Jiang, Y.F. (2015). ACS Catal. 5: 6707–6712.
- 112. Jin, H. (2015). J. Am. Chem. Soc. 137: 7588–7591.
- 113. Antolini, E. (2016). Renewable Sustainable Energy Rev. 58: 34–51.
- 114. Liu, R., Zhang, H., Liu, S. et al. (2016). Phys. Chem. Chem. Phys. 18: 4095–4101.
- 115. Wang, B., Li, S., Wu, X. et al. (2016). J. Mater. Chem. A 4: 11789–11799.
- 116. Zhang, J., Zhou, H., Liu, X. et al. (2016). J. Mater. Chem. A 4: 15870–15879.
- 117. Ba, H., Liu, Y., Phuoc, L.T. et al. (2016). ACS Catal. 6: 1408–1419.
- 118. Yang, Y., Liu, T., Liao, Q. et al. (2016). J. Mater. Chem. A 4: 15913–15919.
- 119. Gong, M. and Dai, H. (2015). Nano Res. 8 (1): 23–29.
- 120. Busch, M., Halck, N.B., Kramm, U.I. et al. (2016). Nano Energy 29: 126–135.
- 121. Tahir, M., Pan, L., Idrees, F. et al. (2017). Nano Energy 37: 136–157.
- 122. Gong, M., Li, Y., Wang, H. et al. (2013). J. Am. Chem. Soc. 135: 8452–8455.
- 123. Xia, Z. (2016). Nat. Energy 1: 16155.
- 124. Ma, T.Y., Dai, S., Jaroniec, M., and Qiao, S.Z. (2014). Angew. Chem. Int. Ed. 53: 7281–7285.
- 125. Chen, S., Duan, J., Jaroniec, M., and Qiao, S.Z. (2014). Adv. Mater. 26: 2925–2930.
- 126. Yu, X., Zhang, M., Chen, J. et al. (2016). Adv. Energy Mater. 6: 1501492.
- 127. Zhao, J., Liu, Y., Quan, X. et al. (2016). Electrochim. Acta 204: 169–175.
- 128. Zhu, Y.P., Jing, Y., Vasileff, A. et al. (2017). Adv. Energy Mater. 7: 1602928.
- 129. Ma, T.Y., Ran, J., Dai, S. et al. (2015). Angew. Chem. Int. Ed. 54: 4646–4650.
- 130. Lee, K.J., Sa, Y.J., Jeong, H.Y. et al. (2015). Chem. Commun. 51: 6773–6776.
- 131. Liu, Z., Zhao, Z., Wang, Y. et al. (2017). Adv. Mater. 29: 1606207.
- 132. Park, H.W., Lee, D.U., Liu, Y. et al. (2013). J. Electrochem. Soc. 160 (11): A2244–A2250.
- 133. Li, X., Fang, Y., Zhao, S. et al. (2016). J. Mater. Chem. A 4: 13133–13141.
- 134. Li, J.C., Hou, P.X., Zhao, S.Y. et al. (2016). Energy Environ. Sci. 9: 3079–3084.
- 135. Han, L.N., Wei, X., Zhang, B. et al. (2016). RSC Adv. 6: 56765–56771.
- 136. Patra, S., Choudhary, R., Roy, E. et al. (2016). Nano Energy 30: 118–129.
- 137. Huang, X., Wang, Q., Jiang, D., and Huang, Y. (2017). Catal. Commun. 100: 89–92.
- 138. Pei, Z., Li, H., Huang, Y. et al. (2017). Energy Environ. Sci. 10: 742–749.
- 139. Zhou, W., Jia, J., Lu, J. et al. (2016). Nano Energy 28: 29–43.
- 140. Conway, B. and Tilak, B. (2002). Electrochim. Acta 47: 3571–3594.
- 141. Mahmood, N., Yao, Y., Zhang, J.W. et al. (2017). Adv. Sci. 1700464.
- 142. Sudhagar, P., Roy, N., Vedarajan, R. et al. (2016). Hydrogen and CO2 reduction reactions: mechanisms and catalysts. In: Photoelectrochemical Solar Fuel Production: From Basic Principles to Advanced Devices (ed. S. Giménez and J. Bisquert), 105–160. Cham: Springer International Publishing.
- 143. Jun, Y.S., Park, J., Lee, S.U. et al. (2013). Angew. Chem. Int. Ed. 52: 11083–11087.
- 144. Talapaneni, S.N., Kim, J., Je, S.H. et al. (2017). J. Mater. Chem. A 5: 12080–12085.
- 145. Xie, K., Wu, H., Meng, Y. et al. (2015). J. Mater. Chem. A 3: 78–82.
- 146. Tiana, Y., Ye, Y., Wang, X. et al. (2017). Appl. Catal., A 529: 127–133.
- 147. Zhao, Y., Zhao, F., Wang, X. et al. (2014). Angew. Chem. 126: 14154–14159.
- 148. Duan, J., Chen, S., Jaroniec, M., and Qiao, S.Z. (2015). ACS Nano 9 (1): 931–940.
- 149. Yan, D., Dou, S., Tao, L. et al. (2016). J. Mater. Chem. A 4: 13726–13730.
- 150. Shinde, S.S., Sami, A., and Lee, J.H. (2015). Chem. Cat. Chem. 7: 3873–3880.
- 151. Yan, X., Jia, Y., Odedairo, T. et al. (2016). Chem. Commun. 52: 8156–8159.
- 152. Peng, Z., Yang, S., Jia, D. et al. (2016). J. Mater. Chem. A 4: 12878–12883.
- 153. Zhang, J. and Dai, L. (2015). ACS Catal. 5: 7244–7253.
- 154. Lai, J., Li, S., Wu, F. et al. (2016). Energy Environ. Sci. 9: 1210–1214.
- 155. Kumar, B., Brian, J.P., Atla, V. et al. (2016). Catal. Today 270: 19–30.
- 156. Lingampalli, S.R., Ayyub, M.M., and Rao, C.N.R. (2017). ACS Omega 2: 2740–2748.
- 157. Wu, J., Yadav, R.M., Liu, M. et al. (2015). ACS Nano 9: 5364–5371.
- 158. Xie, J., Huang, Y., and Yu, H. (2015). Front. Environ. Sci. Eng. 9: 861–866.
- 159. Li, W., Seredych, M., Castellun, E.R., and Bandosz, T.J. (2016). Chem. Sus. Chem. 9: 606–616.
- 160. Sharma, P.P., Wu, J., Yadav, R.M. et al. (2015). Angew. Chem. Int. Ed. Eng. 54: 13701–13705.
- 161. Sreekanth, N., Nazrulla, M.A., Vineesh, T.V. et al. (2015). Chem. Commun. 51: 16061–16064.
- 162. Zhang, S., Kang, P., Ubnoske, S. et al. (2014). J. Am. Chem. Soc. 136: 7845–7848.
- 163. Liu, Y., Chen, S., Quan, X., and Yu, H. (2015). J. Am. Chem. Soc. 137: 11631–11636.
- 164. Amirfakhri, S.J., Binny, D., Meunier, J.L., and Berk, D. (2014). J. Power Sources 257: 356–363.
- 165. Adić, R.R., Marković, N.M., and Vešović, V.B. (1984). J. Electroanal. Chem. Interfacial Electrochem. 165: 105–120.
- 166. Wilshire, J. and Sawyer, D.T. (1979). Acc. Chem. Res. 12: 105–110.
- 167. Memming, R. (1969). J. Electrochem. Soc. 116: 785–790.
- 168. Wu, P., Du, P., Zhang, H., and Cai, C. (2013). Phys. Chem. Chem. Phys. 15: 6920–6928.
- 169. Zhang, T., Li, C., Gu, Y. et al. (2017). Talanta 165: 143–151.