1
Design Principles for Heteroatom‐Doped Carbon Materials as Metal‐Free Catalysts
Zhenghang Zhao*, Lipeng Zhang*, Chun‐Yu Lin*, and Zhenhai Xia
University of North Texas, Department of Materials Science and Engineering, Department of Chemistry, 1155 Union Circle #305310, Denton, TX, 76203‐5017, USA
1.1 Introduction
Renewable and clean energy conversion and storage devices are imperative to continuous energy consumption and environmental protection. At the heart of these energy conversion/storage devices, such as fuel cells, metal–air batteries, and water splitting, there are key electrochemical reactions, oxygen reduction reaction (ORR), oxygen evolution reaction (OER), and hydrogen evolution reaction (HER), that generate electric power or hydrogen fuel. As these reactions are naturally sluggish, catalysts are needed to facilitate them. Catalysts are, therefore, one of the critical factors that determine the efficiency and cost of these energy conversion and storage devices. Currently, the state‐of‐the‐art catalysts are noble metals (e.g. Pt) or their compounds, but their limited resources and high price hinder the wide applications of these devices. Therefore, it is necessary to develop metal‐free catalysts with high efficiency, low cost, and long durability.
Heteroatom‐doped carbon nanomaterials (e.g. graphene and carbon nanotubes (CNTs)) have been shown to have high activities in catalyzing both ORR and OER in fuel cells and Zn–air batteries and HER in hydrogen production [1–3]. In addition to their abundant sources, heteroatom‐doped carbon nanomaterials are more efficient, more stable, and more tolerant to crossover/CO‐poisoning effects than Pt and RuO2, the most active catalysts so far for ORR and OER, respectively [4, 5]. Although the superior catalytic capabilities of the heteroatom‐doped carbon nanomaterials have been clearly demonstrated, it is challenging to find out the best catalyst from numerous possible combinations of dopant elements in the periodic table solely through experimental approach. To rationally design a catalyst, it is critical to understand which intrinsic material characteristics, or descriptors, control the catalytic activity of carbon‐based catalysts.
The catalytic activities on a catalyst are correlated with elementary steps of the reactions: for example, adsorption of O2, formation of OOH* and O*, and removal of OH* in ORR, where the star refers to adsorption [6, 7]. Therefore, the activity on catalysts can be described as a function of the adsorption energy of intermediates, which yields a volcano relationship. The best catalyst could be found near the summit of the volcano for the ORR. Recently, new descriptors for describing ORR, OER, and HER activities of p‐block‐element‐doped, carbon‐based catalysts have been identified to predict the best catalysts for specific applications. Such descriptors have predictive power to design new metal‐free catalysts with enhanced ORR, OER, and HER activities, even better than those reported for platinum‐based metal catalysts. These modeling and analyses provide a fundamental understanding of catalytic mechanisms in metal‐free, carbon‐based material systems and set a theoretical base for the rational design of highly effective, low‐cost metal‐free catalysts. The fundamental aspects and design principles for heteroatom‐doped carbon materials as metal‐free catalysts are discussed in this chapter with an emphasis on design principles for heteroatom‐doped carbon nanomaterials with enhanced catalytic activities.
1.2 Basic Approaches for Catalyst Design
1.2.1 Origin of Catalytic Activities of Metal‐Free Carbon Nanomaterials
Carbon‐based nanomaterials have variously tunable structures, large surface area, outstanding thermal stability, excellent mechanical and electrical properties, and high durability in electrochemical environments. These merits ensure the low cost and strong tolerance to large pH range of environments for the materials serving as catalysts. However, pure and perfect carbon nanomaterials exhibit very low catalytic activities. High catalytic activities of metal‐free carbon nanomaterials originate from their unique electronic structures of highly active sites induced by modified carbon structures. There are several approaches to tune electronic structures to generate catalytic active sites on metal‐free carbon nanomaterials. These approaches are achieved by the localized distribution of the charge density and spin density. Figure 1.1 shows the structures and approaches that are used to generate active sites on metal‐free, carbon‐based nanomaterials to enhance their catalytic properties.
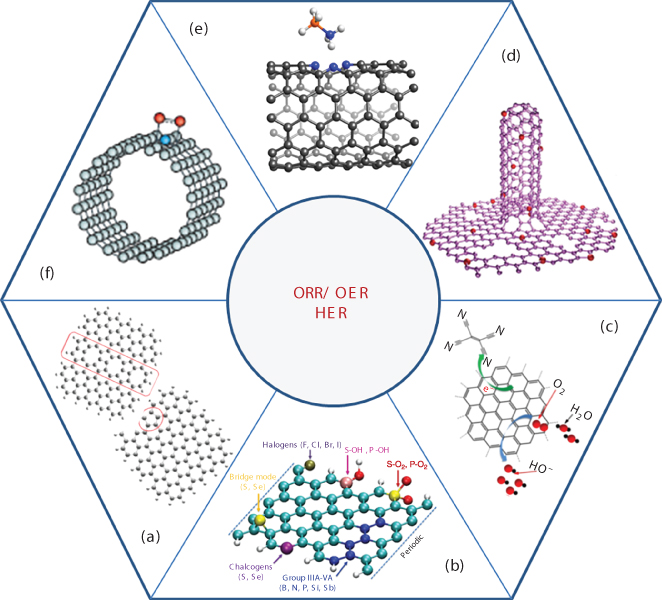
Figure 1.1 Metal‐free, carbon‐based nanomaterials with the catalytic activities to ORR, OER, or HER. (a) Defects. (b) Heteroatom doping. (c) Adsorptions. (d) N‐doped graphene carbon nanotube hybrid. (e) Adsorption of ammonia borane at N‐doped carbon nanotube. (f) Adsorption of oxygen molecule at N‐doped carbon nanotube.
Source: Gong et al. 2009 [12]. Reproduced with permission from AAA.
Source: Chen et al. 2014 [11]. Reproduced with permission from Elsevier.
Source: Tian et al. 2014 [10]. Reproduced with permission from John Wiley & Sons.
Source: Shen et al. 2016 [9]. Reproduced with permission from IOP Publishing.
Source: Zhao et al. 2015 [6]. Reproduced with permission from John Wiley & Sons.
Source: Zhang et al. 2015 [8]. Reproduced with permission from Royal Society of Chemistry.
1.2.1.1 Intrinsic Defects and the Edge Topological Structures
The first approach to tune the electronic properties of carbon nanomaterials is to introduce intrinsic defects and the edge topological structures (Figure 1.1a). The defects, such as vacancies, Stone–Wales defects, pentagon, heptagon, and the pentagon–heptagon (57)/pentagon–pentagon–octagon (558) grain boundaries, would induce the rotation of honeycomb lattice to change the electronic states around the vacancies. The edges of graphene or CNTs show the different electronic states from their internal regions. For example, along a zigzag edge of graphene, there is one localized state per three lattice units and the local charge is a function of the distance to the edge. If the edges are combined with pentagon carbon rings or 57/558 grain boundaries, they enhance ORR catalytic activity on graphene clusters; the active sites locate at the zigzag edges with higher spin density or charge density [8].
1.2.1.2 Heteroatom Doping in Carbon Nanomaterials
The second approach is to dope atoms in carbon nanomaterials (graphene or CNTs), in which carbon atoms are substituted by heteroatoms, such as N, P, and B [13–16], or bonded with heteroatoms, e.g. O, S, Se, Cl, Br, and I [17–20], on carbon surfaces or edges (Figure 1.1b). Because of the different electronegativity between carbon atoms and these heteroatoms, the charge and spin densities would also be localized, which enhance catalytic activities. The active sites are the carbon atoms locating near the dopant or the carbon atoms locating at edges, or dopant atom itself. It was demonstrated through density functional theory (DFT) calculations that doping heteroatom (N, N, B, S, Cl, P, Cl, Br, and I) in graphene significantly altered charge density and spin density distributions on the doped carbon materials, consequently enhancing their ORR/OER catalytic properties [14, 21]. Oxygen functional group COOH, CO, and COH with the synergistic effect of edge defects on graphene was also discovered to show ORR catalytic activities [18].
1.2.1.3 Adsorption of Organic Molecules
The third approach is the physisorption of organic molecules on CNTs and graphene or hybrid structure of N‐doped graphene and graphite structural C3N4(C3N4@NC) [22]. The catalytic activity of this kind of carbon materials stems from the electron transfer between the organic molecule and the graphene or between the C3N4 and the doped graphene. DFT calculation shows that there is an electron transfer from graphene sheets to the adsorbed tetracyanoethylene (TCNE) molecules (Figure 1.1c) [9, 23]. The catalytic active sites are generated at the carbon atoms with higher charge density due to the electron transfer from the graphene to TCNE molecule. On C3N4@NC, it allows one *H bonding with two pyridinic nitrogen in one tri‐s‐triazine periodic unit to form a C2N3H heteroring; a large number of electrons transferred from N‐graphene to catalytically active g‐C2N4 layer can significantly reduce these adsorbed H* species to the final molecular hydrogen, showing high HER catalytic activity [22]. In addition, N‐doped graphene CNT hybrid (Figure 1.1d), and the adsorptions of oxygen molecule, ammonia borane, on N‐doped CNT (Figure 1.1e and f) were also studied [10–12].
1.2.2 Charge Transfer in Carbon Due to Defects, Doping, and Adsorption
Defects on carbon materials could induce the electron transfer, as shown in Figure 1.2b [25]. The electron transfer is beneficial to the conductivity and catalytic activity of carbon nanomaterials. For graphene/CNT containing intrinsic topological defects, such as vacancy, pentagon ring, Stone–Wale defects, 57/558 grain boundary, the symmetry of the charge density distribution would be broken, and the electrons of π bond are localized on the non‐hexagonal carbon ring, or on the grain boundary, as shown in Figure 1.2b. Similarly, charge density on the zigzag edge would be changed due to edge effect. For example, a single vacancy on graphene surface would increase charge density of the carbon atoms locating at the zigzag edge by 0.02 (Mulliken atomic charge) [8] and a 57/558 grain boundary elevates the charge density of carbon atoms on the chain by as high as ∼0.1 (Mulliken charge) [8]. These carbon atoms carrying high positive charge would be potential active sites. The electron transfer induced by these defects highly depends on the position of the defects (point defects) and the direction of the non‐hexagonal grain boundaries. Therefore, it is possible to enhance the catalytic activities by optimizing the topology through the analysis of charge density distribution on these defective carbon materials by DFT methods.

Figure 1.2 Electron transfer on different types of defective graphene: (a) Mulliken charge population on heteroatom‐doped graphene. (b) Spatial distribution of charge density on graphene with line defect‐558 grain boundary. (c) Electron transfer between the adsorbed organic molecule and graphene.
Source: Shen et al. 2016 [9]. Reproduced with permission from IOP Publishing.
Source: Paez et al. 2015 [25]. Reproduced with permission from American Physical Society.
Source: He et al. 2016 [24]. Reproduced with permission from Macmillan Publishers Limited.
For the doped carbon materials, electrons and holes are shared by neighboring carbon atoms. For example, each graphitic‐N in N‐doped graphene can contribute ∼0.5e to π network of graphene lattice, whereas P in P‐doped graphene can transfer 0.21e to the graphene sheet [16, 26]. For B‐doped CNTs, the electrons accumulate in the vacant 2pz orbital of boron dopant from π* electrons of the conjugated system, which then transfers to the intermediates of ORR [27]. The Mulliken electron population on B, N, S, and P‐doped graphene is shown in Figure 1.2a [24]. The doping concentration would affect the magnitude of transferred electrons between dopant atoms and carbon atom/adsorbed intermediates [26]. Therefore, the optimized concentration of dopant could be obtained by employing DFT methods as well.
For organic‐molecule‐adsorbed graphene, e.g. TCNE‐adsorbed graphene, DFT calculation showed that there was ∼0.44e transferred from graphene to TCNE molecule [9]. Thus, some of the carbon atoms on graphene possess higher positive charge density, which is favorable to the adsorption of intermediates. On hybrid C3N4@NG structure, the transferred electrons (0.15e− per CN4@NG unit cell) lead to an electron‐rich region on g‐C3N4 layer and a hole‐rich region on N‐graphene layer. The electron mobility was significantly enhanced, which promotes electrocatalytic HER [22]. Charge transfer of typical carbon nanostructures are summarized in Table 1.1.
Table 1.1 Charge transfer, distance, and overpotential of typical carbon nanostructures [6, 8, 28].
| Structures | Charge transfer | ORR overpotential (V) | OER overpotential (V) | Distance between TCNE and graphene (Å) | |
| Defects | Point defect | <0.2 | — | — | — |
| Stone–Wales | <0.2 | — | — | — | |
| Grain boundary | <0.22 | 0.32 | — | — | |
| Adsorption | Armchair | 0.410 | 1.874 | 1.465 | 3.603 |
| Armchair with defect | 0.498 | 1.248 | 0.496 | 3.558 | |
| Zigzag | 0.506 | 0.897 | 0.457 | 3.635 | |
| Zigzag with defect | 0.484 | 0.657 | 0.452 | 3.615 | |
| Doping | N | 1.24 | 0.445 | 0.405 | — |
| P | 1.39–1.52 | 0.473 | 0.382 | — | |
| S | 0.28 | 0.582 | 0.520 | — | |
1.2.3 Gibbs Free Energy and Overpotentials
Reaction Gibbs free energy, as a fundamental thermodynamic parameter of a reaction, determines whether the reaction occurs spontaneously. The reaction Gibbs free energy is not only used to describe the thermodynamic diagram of the overall elementary reactions but can also be used to ascertain the overpotential of ORR, OER, or HER. In electrochemistry, overpotential is the potential difference between thermodynamically determined and the potential at which redox event is experimentally observed [29]. In OER, overpotential implies requiring more energy than thermodynamically expected to drive the reaction, whereas in ORR, overpotential means less energy is recovered than thermodynamics predicts. For an ideal catalyst, overpotential should be zero, but in real system, there are many factors that affect the overpotential of a catalyst. Hence, the magnitude of overpotential is one of the important parameters to evaluate the quality of designed catalysts. The calculation of the overpotentials of ORR and OER is described in more detail in Section 1.3.2. The overpotentials of typical carbon nanostructures in catalyzing ORR/OER are listed in Table 1.1.
1.2.4 Energy Barriers
Kinetics of a reaction relates to the energy barrier of the reaction, also named as activation energy Ea, which is used to describe the energy required to reach the transition state from reactants to products. The Arrhenius equation describes the quantitative relationship between the activation energy and the rate at which a reaction proceeds.
where A is the frequency factor for the reaction, R is the universal gas constant, T is the absolute temperature, and k is the reaction rate coefficient. The transition state and the corresponding activation energy can be determined using DFT simulation, and therefore, the rate‐limiting step of elementary reactions can be ascertained. The information could be used to improve the efficiency of the designed catalysts by reducing the energy barrier through modification of catalyst structures. The activation energies of the elementary reactions of ORR, OER, or HER on carbon nanomaterials have been calculated with DFT methods [8, 19, 22]. The general methods used in the calculation include nudged elastic band (NEB) [30] and synchronous transition‐guided quasi‐Newton (STQN) [31] embedded in VASP, Gaussian, or ORCA calculation package. However, there is a huge computational cost to search for the transition state and calculate the activation energy of the elementary reactions by the DFT methods. It thus needs to find some simplified ways to ascertain the activation energy. Potential‐dependent activation energy methods were broadly studied for the ORR, OER, and HER on platinum and its alloys [32, 33]; however, as far as we know, there is no such kind of work done on carbon‐based nanomaterial, e.g. defective graphene and CNTs. Efforts are needed on this issue in the process of novel catalyst design and prediction.
1.2.5 Rational Design Strategy for Metal‐Free, Carbon‐Based Catalysts
In addition to experiments, quantum mechanics provides an alternative way to explore ORR, OER, and HER; theoretical investigations complement state‐of‐the‐art experimental techniques, especially characterizing a variety of intermediates difficult or impossible to be determined by experiments. First‐principles‐theory‐based computational methods, such as ab initio wave‐function‐based electronic theory, DFT, plane wave expansion DFT, and ab initio molecular dynamics, have already become very effective tools to treat electrochemical problems.
In the rational design of new carbon‐based catalysts, several steps are carried out to provide mechanism understanding, materials select guideline, and even detailed nanostructural design. Before the design starts, one needs to consider the reliability and accuracy of the used methods. In addition, computational expense should be affordable. As accuracy and expense of the chosen computation methods are always contradictive, finding a proper balance point between these two factors is important in the design of new metal‐free catalysts.
The procedure to design novel catalyst is shown in Figure 1.3. The first step of design strategy is to explore possible catalytic active sites and simulate the reaction mechanisms relating to the chemical process on the target materials by building the models based on pre‐experimental results, literature, and physical/chemical database. Reaction mechanism is at the heart of fundamental understanding of catalysis, and it offers a rational guidance to optimize the performance of a catalyst. However, it is a challenge to examine all the sub‐reaction steps and to figure out how the rate‐limiting step in the reactions is relevant to the structures of the catalyst [33].
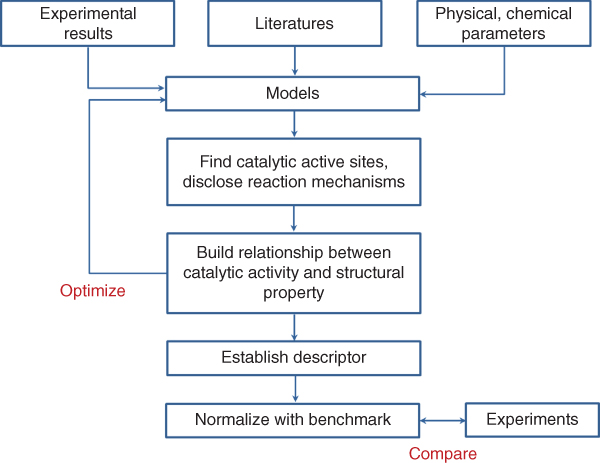
Figure 1.3 Flow chart for rational design of new catalysts using simulation method.
The second step of the design strategy is to explore the origin of catalytic activity and establish the relationship between the apparent activities with corresponding numbers of active sites. This can be realized by computing the overall current density under different electrode potential via the classic Butler–Volmer relation [34]. Finding out the relationship between the catalytic activities and the intrinsic electronic properties/extrinsic physicochemical properties of the materials could pave a way to atomic design of efficient metal‐free catalysts.
The third step of the design strategy is to find one or several descriptors that can be used to effectively characterize the catalytic activities of the designed materials. Knowing which descriptor can be used to define the highest activity allows the researchers to find new catalysts with optimal properties. For example, the scaling relationship, the Nørskov–Bligaard method [35, 36], is employed to estimate the energies of all adsorbed intermediates and transition states, further build catalytic volcano plots, and determine the optimal catalysts. In addition to the scaling relationship method, the degree of rate control (DRC) method was developed to characterize the catalytic activities of designed catalyst [37]. This method was demonstrated to be consistent with the Nørskov–Bligaard method [38]. Whichever the scaling relationship method and the DRC method is used, both of them need electrochemical reaction parameters, e.g. intermediate's adsorption energy to characterize the catalytic properties. If the relationship between the catalytic activities and the intrinsic physical/chemical properties of the materials are built, it is more efficient to predict and design novel catalysts. For example, it was found that the product of relative electronegativity and electron affinity of dopant atoms to the carbon atoms could characterize the ORR/OER catalytic activities of p‐block‐element‐doped graphene. Using this known descriptor, one could predict the ORR/OER catalytic properties of any heteroatom (in the p‐block of the periodic table)‐doped graphene without any computation.
The last step of design strategy is to establish the benchmarking materials and protocols that enable us to extend such practices beyond early work to the new designed catalysts [33]. Benchmarking should involve a comparison of the performance of a new catalyst against that of an accepted standard catalyst, under standard conditions, e.g. standard model Pt, which provides a normalized measure. The example of this kind of systematical method is CatMAP [39].
To improve the efficiency and reduce the cost of catalysts, multifunctional catalysts are desirable in various applications. Several types of active sites or local binding environments for different intermediates are available on this kind of catalyst. This might be achieved by doping, introducing defects, coupling between catalysts and supports, etc. During the simulation of catalytic materials, accurate measurements of adsorption energy of catalytic reaction intermediates and activation energy of elementary reaction steps are essential issues to build volcano plots and benchmark the computational approaches. Spatially large‐scale, longtime simulations that combine molecular or Newtonian dynamics with DFT should be developed to provide atomic‐level understanding. These calculations are to help interpret electrochemical and spectroscopic measurements, determine mechanisms, and predict and discover more efficient catalysts.
1.3 Design Principles for Electrocatalysis of Oxygen
ORR and OER are essential in an energy conversion and storage device like a hydrogen fuel cell or a metal–air battery. The rate of ORR and OER controls the kinetics and determines the efficiency of the devices. It is of importance to understand the fundamental of ORR and OER.
1.3.1 Elementary Reactions of ORR and OER
ORR involves the reduction of oxygen molecules, and its overall reaction is the hydrogen‐burning process shown below:
Literally, if this occurs in an acidic environment, Equation (1.2) should be written as
It is well known that there are two main reaction mechanisms associated with ORR, associate and dissociate pathways. For an associate pathway, it only involves a single active site on catalytic surface in each elementary reaction. The elementary reaction equations for an associate pathway of ORR in acidic media are written as
where * refers to an active site on catalytic surface and O*, OH*, and OOH* refer to the success of the adsorptions of those species on the surface. (l) indicates the species present in a liquid form and (g) indicates the species present in a gas form. During ORR, an O2 gas molecule is adsorbed on the surface (Equation (1.4)), followed by the formation of OOH* and the first electron transfer (Equation (1.5)). In the following step, OO bond is broken to form O* and the first water molecule through the second electron transfer (Equation (1.6)), which is the key step for four‐electron transfer ORR. The last two steps of ORR involve the formation of the OH* (Equation (1.7)) and the desorption of the OH* with the production of the second water molecule (Equation (1.8)).
A dissociate pathway involves two reaction‐active sites where an O2 molecule is directly divided into two oxygen atoms. The elementary equations are written as
where O2 is reduced into two oxygen atoms instead of one oxygen molecule (Equation (1.9)), and there are two active sites involving in this mechanism. The final products are the same as in the associate pathway.
The associate and dissociate pathways can also occur in an alkaline environment. The following elementary equations show performance of ORR in an alkaline environment:
where Equations (1.14)–(1.18) represent the associate pathway in an alkaline environment and Equations (1.19)–(1.23) represent the dissociate pathway in an alkaline environment.
In addition to those two pathways, there is a third reaction mechanism, in which O2 molecule does not reduce to water molecule directly. Instead, O2 reduces to H2O2 at last. This is called indirect pathway and the elementary reactions are written as
in which Equations (1.24)–(1.26) are for the acidic environment and Equations (1.27) and (1.28) are for the alkaline environment.
OER proceeds in an opposite pathway from the ORR. In an acidic environment, the equations are listed as below:
In an alkaline environment, the equations are listed as below:
The reaction pathways of ORR and OER are summarized in Figure 1.4.

Figure 1.4 ORR and OER elementary reaction pathways in both acidic and alkaline media.
1.3.2 Overpotentials and Rate‐limiting Steps
In electrochemistry, overpotential is described as the extra energy required for a reaction to occur thermodynamically and can be considered as a measure of catalytic activities of a catalyst. From electrochemical point of view, the overpotential should be as low as possible to maintain the efficiency of the reactions. The origin of the overpotential for oxygen reduction at a fuel‐cell cathode is from Nørskov et al. [5]. In their work, DFT was used to calculate the thermochemistry for electrochemical reactions of ORR and OER on Pt (111) surface. Later, Li et al. performed DFT computations on N‐doped graphene nanoribbon and extended the concept of overpotential to carbon‐based nanomaterials [7].
To calculate the overpotential of a reaction, one needs to calculate the reaction free energies of each individual reaction.
where ΔG can be any reaction free energy of Equations (1.4)–(1.36), ΔE is the total energy changes of that reaction, and the values are from DFT computations, ΔZPE is the change in zero point energy that can be calculated by the vibrational frequency from density functional perturbation theory, TΔS is the change in the entropy term, ΔGU is the change of potentials on electrodes, and ΔGpH is the correction term of the pH value according to the power of hydrogen, which is calculated by
where kB is the Boltzmann constant and T is the temperature. In theoretical electrochemistry, if the reaction occurs in an acidic environment, the value of pH is determined to be 0, whereas it is determined to be 14 if the reaction happens in an alkaline environment. Thus, the value of ΔGpH is 0 for an acidic media and 0.828 eV for an alkaline environment.
After the reaction free energies of elementary equations are calculated, the values of the overpotentials of ORR and OER can be finally computed by
in which Equations (1.39) and (1.40) are for OER and Equations (1.41) and (1.42) are for ORR. ΔG1, ΔG2, ΔG3, and ΔG4 in the above equations are the reaction free energies of each electron transfer process. Through the calculation, a rate‐limiting step is determined. Again, thermodynamically, lower overpotential indicates better electrochemical performance of ORR or OER on a catalyst. The calculated ORR overpotential for benchmark Pt is 0.45 V, and the calculated OER overpotential for benchmark RuO2 is 0.42 V.
For ORR and OER, there should be a rate‐determining step in their elementary reactions, which has the highest reaction Gibbs energy among them. It was found from DFT calculations that the rate‐determining step of OER could either be the formation of OH* (Equation (1.30)) or be the formation of OOH* (Equation (1.31)) [40]. For ORR, the rate‐determining step would either be the desorption of *OH as water (Equation (1.8)) or be the adsorption of O2 as *OOH (Equation (1.5)), depending on the material structures [40]. The same is true for N‐doped graphene nanoribbon as well. Figure 1.5a shows the doping structures and the adsorption energies of OOH*, O*, and OH*. There are linear relationships between them, indicating that they are rate‐determining factors for ORR, whereas the adsorption energies of O* and OH* are the rate‐determining factors for OER [7]. By using the linear fitting from Figure 1.5b and c, the lower limit of the overpotential can be predicted. For Figure 1.5b, the fitting equation is y = 3.177 + x. When x equals y equals 1.5885, the overpotential reaches its lower bound. Hence, ![]() , which is comparable with the values of Pt and RuO2, indicating that N‐doped graphene has comparable electrochemical activities with these noble metals.
, which is comparable with the values of Pt and RuO2, indicating that N‐doped graphene has comparable electrochemical activities with these noble metals.

Figure 1.5 (a) Armchair and zigzag N‐doped graphene structures. The numbers denote substitutional sites and reaction sites. Symbols a, b, c, d, e, and f denote reaction sites apart from 1, 2, 3, 4, 5, and 6; (b) adsorption energies of OOH* versus adsorption energies of OH*; and (c) adsorption energies of OH* versus adsorption energies of O* on different sites of armchair and zigzag graphene nanoribbons.
Source: Li et al. 2014 [7]. Reproduced with permission from Elsevier.
1.3.3 Intrinsic Descriptor for Single‐Element‐Doped Carbon
To rationally design a catalyst for ORR and OER, descriptors are used to correlate the intrinsic properties of catalytic materials to the reaction performance. In principle, a good descriptor describes the catalytic performance of catalysts in a volcano relationship, from which the best catalysts are those located near the summit of the volcano. The first descriptor used for metals was developed by Nørskov et al. They found that the chemical adsorption energies had a volcano plot relation with either OER or ORR, specifically ![]() with OER overpotential and
with OER overpotential and ![]() with ORR overpotential. They used those terms as descriptors on metal‐based catalysis for ORR and metal‐oxide for OER [4, 5]. Following the similar procedure, Li et al. performed DFT simulation on nitrogen‐doped graphene for both OER and ORR. They used the same descriptors with the calculated overpotentials of ORR and OER for N‐doped graphene nanoribbons, yielding a good volcano relationship [7]. This work in combination with the work by Zhang et al. provides a theoretical base for searching for better heteroatom‐doped carbon nanomaterials as an effective catalyst for ORR and OER [8, 20, 21]. However, the descriptors of
with ORR overpotential. They used those terms as descriptors on metal‐based catalysis for ORR and metal‐oxide for OER [4, 5]. Following the similar procedure, Li et al. performed DFT simulation on nitrogen‐doped graphene for both OER and ORR. They used the same descriptors with the calculated overpotentials of ORR and OER for N‐doped graphene nanoribbons, yielding a good volcano relationship [7]. This work in combination with the work by Zhang et al. provides a theoretical base for searching for better heteroatom‐doped carbon nanomaterials as an effective catalyst for ORR and OER [8, 20, 21]. However, the descriptors of ![]() and
and ![]() only relate the overpotential to the adsorption energies. The adsorption energy is an extrinsic property that requires computational or experimental evaluations. It is necessary to find an intrinsic material property that well describes the electrochemical activities.
only relate the overpotential to the adsorption energies. The adsorption energy is an extrinsic property that requires computational or experimental evaluations. It is necessary to find an intrinsic material property that well describes the electrochemical activities.
Zhao et al. found a new approach toward the intrinsic relationship between the overpotential and the dopants. The overpotentials of various p‐block‐element‐doped graphene, which includes B, N, P, S, Se, Si, Sb, F, Cl, Br, and I (Figure 1.6a), were calculated with DFT methods. The overpotentials were then correlated with a novel intrinsic descriptor Φ, which can be demonstrated as

where EX and EC are the electronegativity of the X dopant and the carbon, respectively, and AX and AC are the electron affinity of the X dopant and the carbon, respectively. As these properties are intrinsic and independent of the adsorptions or reactions, it allows us to rationally design and predict the electrochemical property of doped graphene at first hand. The idea of this intrinsic descriptor comes from the Sabatier principle, which states that the interaction between the catalysts and the adsorbates should be neither too strong nor too weak. Since Φ measures the difference of electronegativities and electron affinities between dopants and carbons, the value of Φ is either too large or too small. Figure 1.6b shows the volcano plot fitting of ORR and OER overpotentials as a function of Φ. When the value of Φ of the dopant is between 1.0 and 2.0, the lower bound of overpotential gets the lowest value. When Φ < 1.0 or Φ > 2.0, the overpotential is high. The intrinsic descriptor Φ is verified by experimental results from recent literatures. In Figure 1.6c, the descriptor Φ is used to correlate the normalized current density. The volcano shape fitting is also shown, indicating that Φ should not be either too large or too small. In summary, this intrinsic descriptor Φ enables us to predict the theoretical overpotential and structures with the best catalytic activities [6].
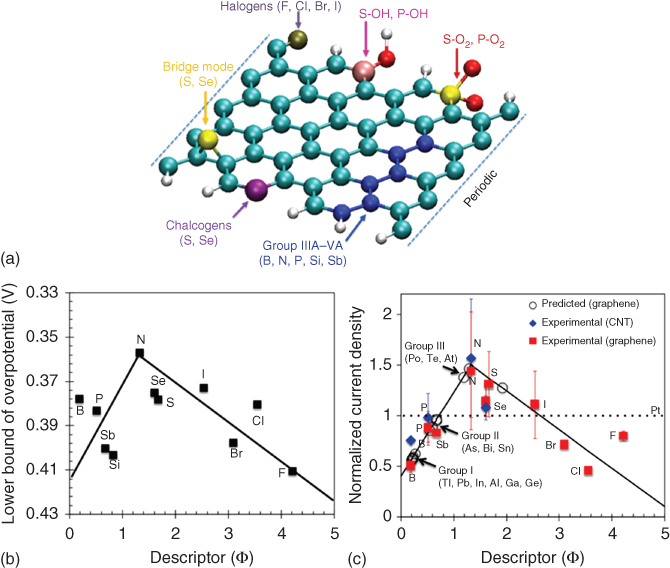
Figure 1.6 (a) Schematic of the X‐doped graphene nanoribbons, showing the possible positions of dopants. (b) The lower limit of OER/ORR overpotentials for X‐doped graphene structures versus the descriptor Φ. (c) Measured limiting current density from the LSV curves, normalized by Pt/C electrode current density at 0.5 V (SCE, saturated calomel electrode) under the same conditions in the same experiment and the predictions.
Source: Zhao et al. 2015 [6]. Reproduced with permission from John Wiley & Sons.
1.3.4 Intrinsic Descriptor for Dual‐element‐Doped Carbon
Dual‐element‐doped carbon nanomaterials are designed for bifunctional catalysts. Recently, N‐ and P‐co‐doped graphene and CNTs have been shown to have high activities in catalyzing both ORR and OER as bifunctional catalysts in Zn–air batteries [41]. Owing to the combination of two dopant elements at the same time, the electrochemical property of the carbon nanomaterial can be further enhanced.
The descriptor Φ mentioned in Equation (1.43) can also be used to rationally design and predict the electrochemical property of co‐element‐doped carbon nanomaterials. Zhao and Xia performed DFT calculations to illustrate the electrochemical process on dual‐element‐doped carbon nanomaterials (Figure 1.7a). It is found that co‐doping approach can influence the charge transfer among material surface and adsorption energies of OER and ORR equations, thus enhancing the catalytic performance. Again, descriptor Φ was used to design and predict the electrocatalytic performance of dual‐element‐doped graphene. Figure 1.7b shows calculated OER and ORR overpotentials as a function of Φ for single‐doped and co‐doped graphene. Volcano plot fitting is obtained proving the effectiveness of the intrinsic descriptor Φ. Thus, the electrochemical performance of co‐doped carbon nanomaterials can be predicted. Φ is also used to correlate experimental results from various publications [42]. Figure 1.7c shows the normalized current density as a function of descriptor Φ, a reverse volcano shape is identified. The same descriptor Φ for single doping can be used to describe the catalytic behavior of the co‐doped, carbon‐based, bifunctional catalysts, but it yields an inverted volcano relationship.

Figure 1.7 (a) Schematic of the N–X co‐doped graphene nanoribbons (X = B, P, S, and Cl), showing the possible positions of dopants. (b) The lower limit of OER/ORR overpotentials for N‐ and X‐doped and N–X co‐doped graphene structures versus the descriptor Φ. (c) Average measured limiting current density from the linear scan voltammogram (LSV) curves, normalized by N‐doped carbon electrode current density under the same conditions, as a function of the descriptor Φ for N–B, N–P, N–F, N–S, and N–Cl co‐doped graphene, and for N–B, N–P, N–Si, and N–S co‐doped CNTs.
Source: Zhao and Xia 2016 [42]. Reproduced with permission from American Chemical Society.
The improved ORR/OER activity of these co‐doped, carbon‐based catalysts can be attributed to the synergy of dual dopants. When two heteroatoms (e.g. N and P) are doped close to each other in graphitic structures, p‐electron clouds overlap and interact with each other, generating more active sites on neighboring carbon atoms compared with single‐element‐doped graphene [41, 42]. In general, when the electronegativity of dopants (e.g. B, P, and S) is smaller than that of N, these dopants carry positive charges, vice versa. In any case, these co‐doping clusters generate positive charges on neighboring carbon atoms that are potential active sites for ORR and OER.
1.3.5 Active Centers and Charge Distribution
Active centers are those active sites facilitating the electrochemical reactions. It is essential to identify the locations of active centers. From previous studies, charge distribution is critical in determining the locations of the active centers. When doping heteroatoms on the graphene surface, charge redistribution occurs between the dopants and the carbon atoms, thus causing charge transfer between the carbon matrix and dopants. Figure 1.8 shows charge distributions on different types of doped graphene. Due to the charge redistribution, some carbon atoms carry positive charge, which plays an essential role in enhancing the electrochemical property of the doped carbon‐based materials [6, 20, 21, 42, 43]. Further DFT calculations show that the charge distribution can be improved when water molecules are present [44].

Figure 1.8 Differential charge density distributions (between doped and undoped graphene) of (a) boron‐, (b) nitrogen‐, and (c) fluorine‐doped graphene sheets. The active sites with the minimum overpotential are marked with values. Light and dark gray indicate the positive and negative values of electron quantities, respectively. The isosurface value is set to 0.0015. Black and white balls refer to carbon and hydrogen atoms, respectively.
Source: Zhao et al. 2015 [6]. Reproduced with permission from John Wiley & Sons.
1.3.6 Edge and Defect Effects
Edges and defects are believed to improve the electrocatalytic performance of carbon‐based materials. DFT calculations show that armchair and zigzag edges in graphene nanoribbons can reduce ORR and OER overpotentials, thus enhancing catalytic activities. This is believed to be the edge effect. Generally speaking, the ORR and OER overpotentials for zigzag graphene are larger than those for armchair graphene nanoribbons, indicating that zigzag edges may benefit to the overpotential more than the armchair ones do [7]. Based on that, Zhao et al. performed DFT computations on many other kinds of doped graphene, and they found that the edge effect existed for all the cases. Therefore, introducing more edge in carbon nanomaterials would significantly enhance electrochemical activities of the materials.
In addition to edges, defects on the carbon materials can also facilitate the OER and the ORR. Figure 1.9 shows common defects on graphene surfaces. For Stone–Wales defects, charges redistribute in the area of the defects, generating positively charged active sites near the defects. This facilitates the electrochemical reaction of the defect graphene [28]. Other types of defects, shown in Figure 1.9, also lead to charge distribution at the defects [8].
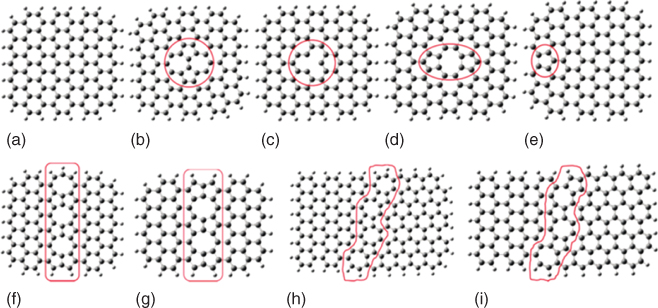
Figure 1.9 Perfect and defective graphene clusters. (a) Perfect graphene cluster, (b) Stone–Wales defect (SW), (c) single vacancy (SV), (d) double vacancies (DV), (e) edge defect with pentagon ring at zigzag edge (PZ), octagon and fused pentagon carbon rings line defect with (f) odd number of octagon rings (GLD‐558‐01) and (g) even number of octagon rings (GLD‐558‐02), and pentagon–heptagon pairs line defects with (h) odd number of heptagon rings (GLD‐57‐01) and (i) even number of heptagon rings (GLD‐57‐02). The larger gray and smaller white balls denote carbon and hydrogen atoms, respectively.
Source: Zhang et al. 2015 [8]. Reproduced with permission from Royal Society of Chemistry.
1.3.7 Catalysis Induced by Molecule Adsorption
Small organic molecules can facilitate ORR and OER processes when they physically adsorb on graphene or CNTs. As mentioned earlier, this non‐covalent functionalization can enhance the electrochemical properties of graphene and CNTs and retain the formation of the basal surface simultaneously because of intermolecular charge transfer caused by the adsorbed molecule. Experimental results have shown that polyelectrolyte‐functionalized carbon nanomaterials can tailor ORR. Those molecules include TCNE and poly(diallyldimethylammonium chloride) (PDDA) [45, 46]. Wang et al. demonstrated that PDDA‐functionalized/adsorbed CNTs can act as effective catalysts for ORR in fuel cells with similar performance as Pt catalysts [46]. Other organic molecules that can enhance the electrochemical property of the carbon‐based materials include tetracyanoquinodimethane (TCNQ), etc.
Zhao et al. theoretically performed a DFT studies on TCNE‐adsorbed graphene nanoribbon with Stone–Wales defects for OER and ORR. Their results show that the lower limit of overpotential of that structure is 0.425 V for both OER and ORR, which are comparable with the values of heteroatom‐doped graphene and noble metals. The edges and Stone–Wales defects enhance the electrocatalytic performance [28]. Figure 1.10a–c shows the adsorption of the TCNE on the graphene and charge distribution. The charge transferring from graphene to TCNE is 0.44e for armchair configuration and 0.51e for zigzag configuration, which are also comparable with the values of S‐doped graphene [9].
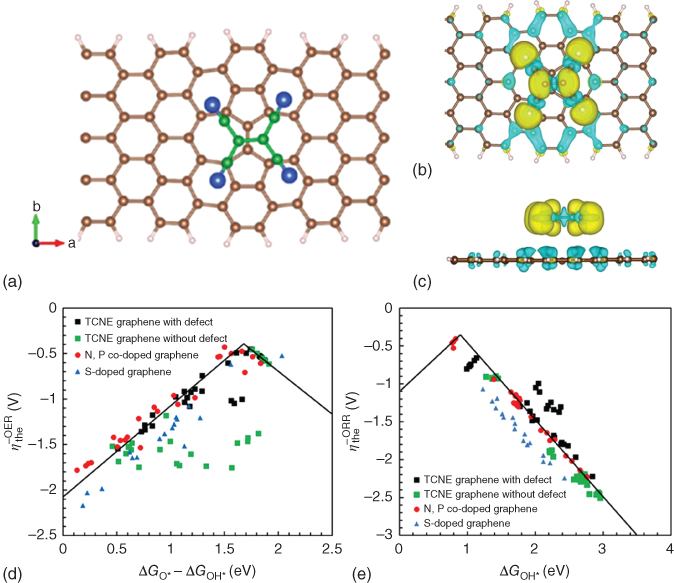
Figure 1.10 (a) Configurations of TCNE‐adsorbed carbon nanoribbons without intermediate adsorption and with intermediates of pristine graphene. Green and blue atoms indicate carbon and nitrogen atoms of the TCNE molecules. Differential charge density distributions of TCNE‐attached graphene sheets with (b) defective armchair edge (top view) and (c) defective armchair edge (side view), Volcano plots of (d) ηOER versus  , and (e) ηORR versus
  , including TCNE‐absorbed defective and perfect graphene nanoribbons. For comparison, the data for N‐, P‐, and S‐doped graphene nanoribbons are also plotted in the graph.
Source: Zhao et al. 2016[28]. Reproduced with permission from American Chemical Society.
To search for the TCNE‐adsorbed graphene structures with the most active sites, the adsorption energies,![]() as a descriptor, are applied to this system to form a volcano relationship. Figure 1.10d shows a volcano plot of OER overpotential versus the descriptor for both armchair and zigzag structures of defective and perfect graphene. For comparison, the overpotential for N, P, and S‐doped graphene is also plotted in the same figure. A special structure is identified as the best structure with the minimum OER overpotential (ηOER = 0.452). Figure 1.10e shows the volcano plot of ηORR versus
as a descriptor, are applied to this system to form a volcano relationship. Figure 1.10d shows a volcano plot of OER overpotential versus the descriptor for both armchair and zigzag structures of defective and perfect graphene. For comparison, the overpotential for N, P, and S‐doped graphene is also plotted in the same figure. A special structure is identified as the best structure with the minimum OER overpotential (ηOER = 0.452). Figure 1.10e shows the volcano plot of ηORR versus ![]() of both armchair and zigzag configurations. A structure is also identified from the plot, with a minimum ORR overpotential of ηORR = 0.657. Overall, the zigzag graphene nanoribbons show lower overpotentials than armchair nanoribbons. The OER/ORR overpotentials of the graphene nanoribbons with Stone–Wales are better than those without defects. Stone–Wales defect plays a role in enhancing ORR and OER. The minimum OER and ORR overpotentials are comparable with those of noble‐metal‐containing catalysts (0.42 V for OER on RuO2‐rutile, and 0.45 V for ORR on Pt) and S‐doped graphene catalysts (0.582 V for OER and 0.52 for ORR). These results are consistent with the experimental work on TCNE‐adsorbed graphene, which is an effective OER catalyst with performance close to S‐doped graphene.
of both armchair and zigzag configurations. A structure is also identified from the plot, with a minimum ORR overpotential of ηORR = 0.657. Overall, the zigzag graphene nanoribbons show lower overpotentials than armchair nanoribbons. The OER/ORR overpotentials of the graphene nanoribbons with Stone–Wales are better than those without defects. Stone–Wales defect plays a role in enhancing ORR and OER. The minimum OER and ORR overpotentials are comparable with those of noble‐metal‐containing catalysts (0.42 V for OER on RuO2‐rutile, and 0.45 V for ORR on Pt) and S‐doped graphene catalysts (0.582 V for OER and 0.52 for ORR). These results are consistent with the experimental work on TCNE‐adsorbed graphene, which is an effective OER catalyst with performance close to S‐doped graphene.
1.3.8 Catalyst Design Principles
Based on the discussion in previous sections, the design principles for carbon‐based materials as electrocatalysts for energy storage and conversion are summarized as follows:
- According to Sabatier principle, the interaction between the catalysts and the adsorbates should be neither too strong nor too weak. Unlike Sabatier principle that just provides a qualitative relationship, an intrinsic descriptor Φ is identified as shown in Equation (1.43), which quantitatively relates intrinsic material property of the dopants to the catalytic performance. This quantitative relationship enables us rationally design and predict the ORR and OER overpotentials of heteroatom‐doped graphene. The dopant should have a descriptor Φ between 1.0 and 2.0 to achieve the best performance.
- The descriptor Φ is also valid for dual‐element‐doped, carbon‐based materials. By using this intrinsic descriptor, the electrocatalytic performance of dual‐element‐doped, carbon‐based materials can also be predicted in advance. Overall, the synergetic interactions become stronger when the difference in descriptor (Φ) between two dopants is larger. Therefore, choosing co‐dopants with relatively different chemical properties (e.g. electronegativity) would be a strategy to enhance the catalytic activities of dual‐element‐doped carbon nanomaterials.
- Charge distribution shows that positive‐charged sites on carbon‐based surfaces play an essential role in determining the electrocatalytic property of a catalyst. The positive‐charged sites will act as active centers to enhance ORR and OER performances in energy storage and conversion. The reason for this is positive‐charged active centers can enhance the hybridization of sp2 bonds between the carbon‐based surface and the intermediates.
- Defects such as Stone–Wales (5577) can enhance the electrocatalytic performance of a carbon‐based material. Armchair or zigzag edges also do so. Because of the defects and the edges, large charge distributions will occur in those areas leaving lots of positive‐charged active centers. Again, those positive‐charged active centers are essential in the design of carbon‐based materials as catalysts.
- Adsorption of small organic molecules such as TCNE and TCNQ can enhance the ORR and OER performances. By adsorbing organic molecules onto the carbon‐based surface, charge redistributions occur between the surface and the molecule, generating positive‐charged active centers on the carbon‐based surface. Those positive‐charged sites can improve the OER and ORR performances of carbon‐based materials as catalysts in energy storage and conversion.
1.4 Design Principles for Catalysis of Hydrogen Production
1.4.1 HER Mechanisms and Reaction Pathways
HER is a significant process in water splitting to produce hydrogen gas. There are two main HER pathways: Volmer–Heyrovsky and Volmer–Tafel reactions. The process of Volmer–Heyrovsky pathway can be separated into the following steps. The first step is hydrogen adsorption reaction described by Volmer reaction:
The second step is Heyrovsky reaction – an electrochemical desorption step:
In Volmer–Tafel reaction pathway, after the Volmer reaction (Equation (1.44)), two adsorbed hydrogen atoms combine to form hydrogen molecule:
Overall HER is
HER could occur in alkaline and acidic media. In alkaline solution, the equitation is described as
Its elementary reactions follow the following reaction pathways:
In acidic solution, the overall reaction is
and the reaction pathways are written as
Zheng et al. pointed out that the potential of Volmer–Tafel reaction is higher than that of Volmer–Heyrovsky, 0.19 eV. The lower potential will prefer Volmer–Heyrovsky pathway, as shown in Figure 1.11a, but the higher potential will prefer Volmer–Tafel pathway, as shown in Figure 1.11b [22]. Moreover, there is an energy difference of 0.33 eV in Volmer–Tafel pathway when it compares with standard hydrogen electrode [22].

Figure 1.11 Reaction mechanism for HER in (a) Volmer–Heyrovsky and (b) Volmer–Tafel of C3N4 at nitrogen‐doped graphene. The activation barriers were represented as dashed lines for each reaction steps.
Source: Zheng et al. 2014 [22]. Reproduced with permission from Nature Publishing Group.
Free energies of HER on graphene sheets with edge and graphitic doping by various elements (e.g. B, N, O, S, and P) and pristine graphene were calculated by DFT methods. According to free energy diagrams (Figure 1.12a and b), Volmer step is considered to be the rate‐determining step whatever the reaction pathway is, Volmer–Heyrovsky or Volmer–Tafel [34]. Therefore, the strategy is to increase the active sites to increase the efficiency of electron transfer. The change of free energy predicted by the simulation shows the same trend with experimental results by Tafel slope shown in Figure 1.12c [47].
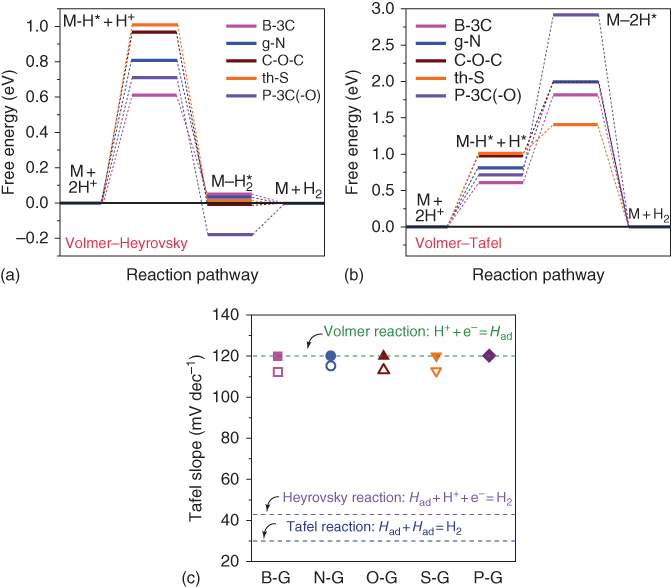
Figure 1.12 (a) Free energy diagram for the HER following the Volmer–Heyrovsky pathway and (b) the Volmer–Tafel pathway on various graphene models. (c) Tafel slopes obtained from theoretical computation (filled symbols) and experimental measurement (open symbols) on various graphene models/samples.
Source: Jiao et al. [34]. Reproduced with permission from Nature Publishing Group.
1.4.2 Hydrogen Adsorption Energy
Hydrogen adsorption (H++ e− → H*) is one of the important steps in HER. Adsorption energy of single hydrogen on catalyst surface is defined by
where Ead is the hydrogen adsorption energy, ![]() is the total energy of hydrogen adsorption on the catalyst surface, EG is the energy of catalyst such as graphene, and
is the total energy of hydrogen adsorption on the catalyst surface, EG is the energy of catalyst such as graphene, and ![]() is the energy of gas state of hydrogen molecule in standard system. In the case of multiple hydrogen adsorptions, the adsorption energy is calculated by averaging each hydrogen adsorption on the surface, defined by
is the energy of gas state of hydrogen molecule in standard system. In the case of multiple hydrogen adsorptions, the adsorption energy is calculated by averaging each hydrogen adsorption on the surface, defined by
where n is the number of hydrogen atoms adsorbed on catalyst surface. The Gibbs free energy for hydrogen adsorption on catalysts is defined by
where ΔGH* is the hydrogen adsorption, ΔEZPE is the difference between the gas phase of hydrogen and the adsorbed hydrogen in zero point energy, which is calculated to be 0.04 eV [48]. As the vibrational entropy of hydrogen adsorption is quite small, ΔSH is close to −0.5 ![]() , where
, where ![]() is the entropy of H2 in the gas phase at standard conditions. The Gibbs energy is related to the adsorption energy by
is the entropy of H2 in the gas phase at standard conditions. The Gibbs energy is related to the adsorption energy by
1.4.3 Reaction Kinetics of Hydrogen Evolution
As the Volmer step (hydrogen adsorption) is usually the rate‐determining step, the concentrations of H+ (CO) and H* (CR) can be related to an equilibrium constant K by Arrhenius equation (Equation (1.1))

Exchange current density, which represents intrinsic catalytic activity of a catalyst, can be calculated as [47]
where A is the area of electrode, n is the number of electron transfer, F is Faraday constant, k0 is the standard rate constant, and α is the transfer coefficient. The coverage of H*, expressed by θ, is related to K by

where Ctol is the total concentration of active sites. Combining Equations (1.61) and (1.62), we have
where ![]() is the rate constant of catalyst surfaces. In order to compare with various doped graphene with different amount of active sites, the normalized i0 is represented by
is the rate constant of catalyst surfaces. In order to compare with various doped graphene with different amount of active sites, the normalized i0 is represented by
Equations (1.60), (1.62), and (1.64) relate the adsorption Gibbs energy to the exchange current density in a volcano shape, which, thus, has the power to predict the best catalyst. As an example, the volcano curves of hydrogen adsorption have been plotted based on the kinetic model for various α and ![]() value [34].
value [34].
Furthermore, the equilibrium potential of electrode (Eeq) can be related to the reactions and products by
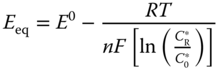
where E0 is the potential in standard state.
Overpotential on electrodes (η) can be calculated by
where Eact is the potential on electrode. Therefore, the Tafel equation is

where a and b are constants, b is the Tafel slop, and I is the current density.
1.4.4 Active Origin and Volcano Relationship for p‐Element‐Doped Carbon
In principle, the catalytic property of a catalyst is fundamentally determined by its electronic structure. To explore this correlation, electronic structure analyses were carried out by examining density of state (DOS)‐based descriptors on each doping model and plotting these against corresponding values of ΔGH*. The highest peak of the active center DOS (Ep) shows the overall best linear trend in the range for all investigated models [34]. This result suggests that for a graphene surface, the higher the Ep position of active center, the stronger the H* adsorption strength. Therefore, a peak on the DOS of the active carbon closer to the Fermi level is required to achieve a stronger H* adsorption and consequently a lower value of ΔGH* because the hydrogen adsorption strength on the investigated graphene models is normally weak [34].
Heteroatom doping with p‐block elements (boron, nitrogen, oxygen, phosphorus, and sulfur) in graphene has been used to improve efficiency of HER electrocatalysts [14, 22, 49–55]. Examples of p‐block elements doped in graphene with central or edge location among the graphene are shown in Figure 1.13a [34]. The Gibbs free energy for hydrogen adsorption ΔGH* on various doping structures was calculated through the DFT calculation. A smaller absolute value of the adsorption energy indicates greater activity site in HER [34]. Compared with pure graphene, p‐doped element doping increases the ability of hydrogen adsorption and thus the catalytic activities (Figure 1.13b). The best active site (B3C) locates at the carbon next to non‐edge dopant. However, the catalytic activities of these single‐element‐doped graphene catalysts are still lower than that of Pt.

Figure 1.13 (a) Schematic summary of the heteroatom‐doping configurations: pr‐N, py‐N, g‐N, N‐O, B‐2C‐O, B‐3C, B‐C‐2O, P‐3C(‐O), and P‐2C(‐2O) (top row, from left to right); th‐S, S‐2O, py‐O, C–O–C, C–OH, C=O, g‐C, z‐C, and a‐C (bottom row, from left to right). (b) The computed lowest ΔGH* for different models. The ΔGH* values on graphitic-type doping models is labeled by solid bars, whereas those on edge doping models are labeled by shaded bars (except for th‐S, which is shown by shaded bars because the inability to construct a graphitic doping model).
Source: Jiao et al. [34]. Reproduced with permission from Nature Publishing Group.
To enhance the catalytic activities, two p‐block elements have been co‐doped in graphene to introduce modified electron acceptor–donor properties of carbons by the so‐called synergistically coupling effect between two heteroatoms. Two‐element‐doped graphene provides the smaller bandgap than single‐element‐doped graphene to increase the efficiency of electrons from valence band to conduction band to improve the conductivity. Consequently, the synergistic effect and bandgap play important roles in co‐doped graphene in HER/ORR for electrocatalysts. Bifunctional catalysts with nitrogen and phosphorus co‐dopant were synthesized by self‐assembling and used in wide pH range to achieve high performance in HER. The catalysts show 0.06 V in overpotential, 30 mA cm−2 in current density, and −0.21 V in potential, which are comparable with that of Pt/C [53]. DFT calculations were also carried out to evaluate electron acceptor/donor ability of the dopant elements in graphene for HER to rationally design the electrocatalysts for hydrogen production. As shown in Figure 1.14a [56], F, S, B, and P display electron donor (>0) while N and O show electron accepter (<0) for graphene. N,P co‐doped graphene as the metal‐free catalyst showed greater activity in HER than single‐element‐doped graphene (Figure 1.14b and c) [56].

Figure 1.14 (a) Six various nonmetallic heteroatoms of NBO population in graphene temple. gN and pN represent graphitic and pyridinic type of N, respectively. Inset figure shows that site 1 is edge, site 2 is center in‐plane sites, and site 3 is out‐of‐plane site in graphene. (b) The free energy diagram (ΔGH*) at the equilibrium potential (URHE = 0 V) in HER for whole possible N‐ or P‐doped graphene models. (c) Linear relationship between Ediff and ΔGH* for various models.
Source: Zheng et al. 2015 [56]. Reproduced with permission from American Chemical Society.
1.4.5 Active Origin for C3N4/N‐Graphene Hybrid Systems
Carbon nitride (C3N4) containing 57% of N content is one kind of metal‐free, carbon‐based material used as a photocatalyst in hydrogen production [57–60]. In particular, a hybrid catalyst, composed of graphitic carbon nitride and nitrogen‐doped graphene (C3N4/NG), shows high electrocatalytic HER activities due to the strong interaction between them and the formation of interlayer bonds [22]. The overpotential and Tafel slope of the hybrid materials are 240 mV and 51.5 mVdec−1, respectively.
DFT calculation shows that due to electron transfer from conductive side of N‐doped graphene to g‐C3N4 after coupling them, downshifting of the Fermi level of g‐C3N4 increases electron mobility and transfer (Figure 1.15a). Band structures and interfacial charge transfers are shown in Figure 1.15b and c. Moreover, their free energy diagram (Figure 1.15d) shows that only C3N4/NG hybrid catalyst has a comparable result of H* adsorption ![]() with Pt
with Pt ![]() , which is close to zero [48].
, which is close to zero [48].
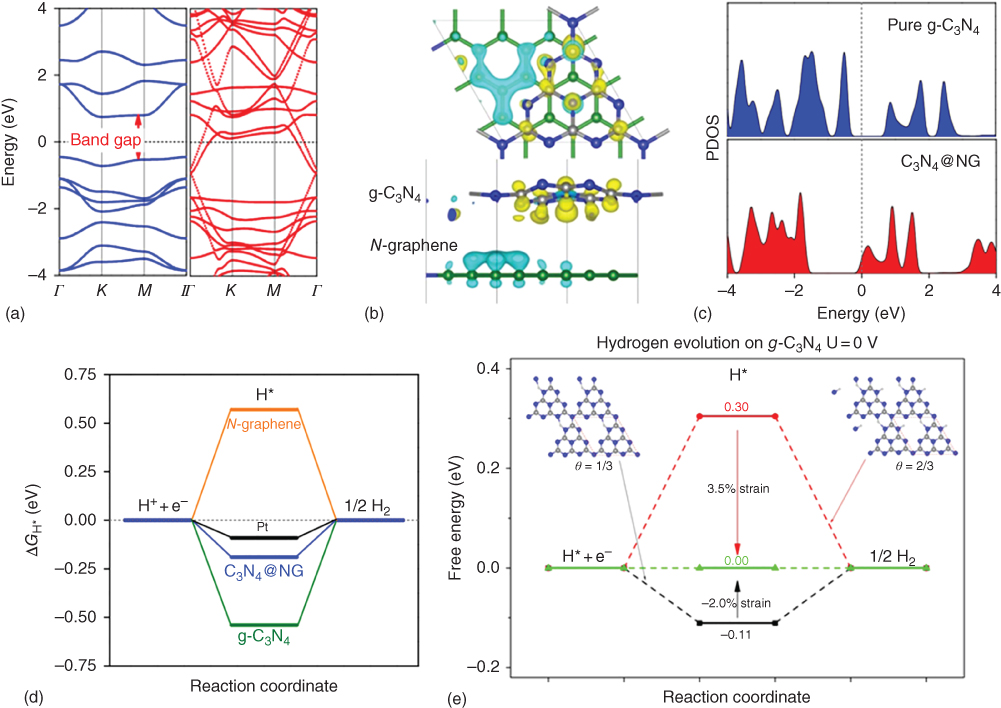
Figure 1.15 DFT calculation of C3N4@NG as a HER catalyst. (a) Band structure of pure g‐C3N4 (left side) and C3N4@NG hybrid (right side). (b) Interfacial electron transfer in C3N4@NG. Yellow and cyan isosurfaces represent electron accumulation and electron depletion; the isosurface value is 0.005eÅ3. (c) The projected density of states (PDOS) on pure g‐C3N4 (top‐blue) and C3N4@NG hybrid (down‐red). (d) The free energy diagram of HER in equilibrium potential for comparison of three various catalysts with Pt. (e) The free energy diagram for hydrogen evolution on g‐C3N4 under coverages of 1/3 and 2/3. Atom color code: carbon (gray), nitrogen (blue), and hydrogen (white). The coverages are labeled by θ.
Source: Zheng et al. 2014 [22]. Reproduced with permission from Nature Publishing Group.
Further DFT calculation shows that the experimentally observed high HER activity in N‐doped, graphene‐supported g‐C3N4 is actually attributed to electron‐transfer‐induced strain. A more practical strategy to induce mechanical strain in g‐C3N4 is to dope a bridge carbon atom in g‐C3N4 with an isoelectronic silicon atom. The calculated ΔGH* on the Si‐doped g‐C3N4 is ideal for HER. Figure 1.15e presents the free energy diagram for HER on strained g‐C3N4 under hydrogen coverages of 1/3 and 2/3. Clearly, the ΔGH* of g‐C3N4 at a hydrogen coverage of 1/3 can be tuned to zero when a compressive strain of −2% is imposed, and the ΔGH* of g‐C3N4 at a hydrogen coverage of 2/3 will be tuned to zero when a tensile strain of 3.5% is exerted on a g‐C3N4 monolayer. Thus, the ΔGH* of g‐C3N4 at different hydrogen coverages can be modified to desired values by a small strain, leading to the maximum HER performance of g‐C3N4 [61].
1.4.6 Catalyst Design Principles
There are three essential factors for catalyst development: activity, selectivity, and stability. In particular, activity is directly related to exposed active sites on catalyst and is a key factor to rational design of catalysts. As HER occurs only on these active sites (active centers), the apparent activity for a solid catalyst is governed by both the unit activity on each active site (intrinsic) and the number of exposed active sites for a particular mass loading (extrinsic). Therefore, design principles can be established through intrinsic and extrinsic factors for carbon‐based catalysts.
The first design principle related to the unit activity is the descriptor that correlates catalytic activities via volcano relationships such that the best dopant can be found near volcano summit. For HER, in addition to particular physicochemical properties, the value of adsorption energy, ΔGH*, controls the performance of a catalyst, which is an excellent descriptor. A smaller absolute value of ΔGH* leads to higher HER activity. Therefore, the strategy to enhance the catalytic activities is to reduce the adsorption energy of hydrogen on carbon surface.
The second principle is to introduce more edges in carbon‐based catalysts. According to the edge effect, the electrochemical performance of the carbon‐based catalysts can be further enhanced by introducing more edges. The above strategies exploit the intrinsic properties of the materials (dopants and doping structures) to enhance the catalytic performance.
In addition to the unit activity on each active site (intrinsic factors), a catalyst is also controlled by the number of exposed active sites for a particular mass loading (extrinsic factors). Therefore, the third design principle is to increase the number of exposed active sites for a particular mass loading based on the relationship between the apparent activities of graphene‐based materials with corresponding number of active sites. This can be realized by computing the overall current density under different electrode potentials via the classic Butler–Volmer relation based on the ideal current for a predicted doped graphene sample. Four physicochemical properties of catalysts should be considered, including surface area, heteroatom doping levels, loading mass, and test area. For the Butler–Volmer equation, assuming that the exchange current for an active site is i0/site, the electrode current per site i under electrode potential U is [24]
where U0 is the relative potential and b is the Tafel slope. Therefore, the current density (in mA cm−2), j, on an electrode under U is computed from
where S is the surface area per mass loading (in m2 g−1), m is the loading amount of catalyst material (g), Sc is the area per atom (in 1.677 × 10⁻¹⁸ m2 for graphene), and ζ is the doping percentage of active heteroatoms. If the area per atom and test area are fixed (can be considered as constants), a strategy for increasing the catalytic activities is to increase the surface area per mass loading, the loading amount of catalyst material, and the doping percentage of active heteroatoms.
As an example of application of the design principles, if the surface area of a graphene‐based sample is fixed, the HER overpotential is decreased with increasing active concentration of dopant, as is shown in Figure 1.16a. When the doping percentage increases to 10%, the final product exhibits a performance comparable with that of the MoS2 benchmark. Similarly, overall performance would be better than that of MoS2 material if the surface area increases to a certain value. Hence, increasing the number or concentration of active sites and using the foundation of graphene base materials are the strategy to improve the catalytic activity. On the other hand, the value of ΔGH* controls the performance of a catalyst [34]. The top of volcano clearly predicts a catalyst (X–G) with the best catalytic activity (Figure 1.16) [34]. Thus, the predicted overpotential on graphene can decrease and consequently catalytic activities increase significantly by carefully controlling some experimentally achievable parameters.

Figure 1.16 Volcano plot between i0/sitetheory and ΔGH* with charge‐transfer coefficient α = 0.125 (black solid line). The hollow symbols represent i0/siteexp obtained from Tafel plots and DFT‐derived ΔGH* for each graphene sample/model.
Source: Jiao et al. 2016 [34]. Reproduced with permission from Nature Publishing Group.
Acknowledgments
The authors thank the National Science Foundation (1561886 and 1363123) and the Air Forces MURI program (no. FA9550‐12‐1‐0037) for the support of this research. Computational resources were provided by the UNT high‐performance computing initiative, a project of academic computing and user services within the UNT computing and information technology center.
References
- 1 Hu, C. and Dai, L. (2016). Angew. Chem. Int. Ed. 55: 11736.
- 2 Xu, Y., Kraft, M., and Xu, R. (2016). Chem. Soc. Rev. 45: 3039.
- 3 Jiao, Y., Zheng, Y., Jaroniec, M., and Qiao, S.Z. (2015). Chem. Soc. Rev. 44: 2060.
- 4 Man, I.C., Su, H.Y., Calle‐Vallejo, F. et al. (2011). ChemCatChem 3: 1159.
- 5 Nørskov, J.K., Rossmeisl, J., Logadottir, A. et al. (2004). J. Phys. Chem. B 108: 17886.
- 6 Zhao, Z., Li, M., Zhang, L. et al. (2015). Adv. Mater. 27: 6834.
- 7 Li, M., Zhang, L., Xu, Q. et al. (2014). J. Catal. 314: 66.
- 8 Zhang, L., Xu, Q., Niu, J., and Xia, Z. (2015). Phys. Chem. Chem. Phys. 17: 16733.
- 9 Shen, A., Xia, W., Zhang, L. et al. (2016). Nanotechnology 27: 185402.
- 10 Tian, G.L., Zhao, M.Q., Yu, D. et al. (2014). Small 10: 2251.
- 11 Chen, X., Wan, L., Huang, J. et al. (2014). Carbon N. Y. 68: 462.
- 12 Gong, K., Du, F., Xia, Z. et al. (2009). Science 323: 760.
- 13 Studt, F. (2013). Catal. Lett. 143: 58.
- 14 Wang, S., Zhang, L., Xia, Z. et al. (2012). Angew. Chem. Int. Ed. Engl. 51: 4209.
- 15 Yang, L., Jiang, S., Zhao, Y. et al. (2011). Angew. Chem. Int. Ed. 50: 7132.
- 16 Wang, H.H., Wang, H.H., Chen, Y. et al. (2013). Appl. Surf. Sci. 273: 302.
- 17 Jeon, I.‐Y., Choi, H.‐J., Choi, M. et al. (2013). Sci. Rep. 3: 1810.
- 18 Su, C., Acik, M., Takai, K. et al. (2012). Nat. Commun. 3: 1298.
- 19 Jeon, I., Zhang, S., Zhang, L. et al. (2013). Adv. Mater. 25 (42): 6138–6145.
- 20 Zhang, L., Niu, J., Li, M., and Xia, Z. (2014). J. Phys. Chem. C 118: 3545.
- 21 Zhang, L. and Xia, Z. (2011). J. Phys. Chem. C 115: 11170.
- 22 Zheng, Y., Jiao, Y., Zhu, Y. et al. (2014). Nat. Commun. 5: 1.
- 23 Zhao, Z., Zhang, L., and Xia, Z. (2016). J. Phys. Chem. C 120: 2166.
- 24 He, C.N., Huang, W.Q., Xu, L. et al. (2016). Sci. Rep. 6: 22267.
- 25 Paez, C.J., Pereira, A.L.C., Rodrigues, J.N.B., and Peres, N.M.R. (2015). Phys. Rev. B – Condens. Matter Mater. Phys. 92: 1.
- 26 Wang, X., Sun, G., Routh, P. et al. (2014). Chem. Soc. Rev. 43: 7067.
- 27 Li, Q., Cao, R., Cho, J. et al. (2014). Adv. Energy Mater. 4: 1301415. https://onlinelibrary.wiley.com/doi/abs/10.1002/aenm.201301415.
- 28 Zhao, Z., Zhang, L., and Xia, Z. (2016). J. Phys. Chem. C 120 (4): 2166–2175.
- 29 Bard, A.J. and Faulkner, L.R. (2000). Electrochemical Methods: Fundamentals and Applications. Wiley.
- 30 Henkelman, G., Uberuaga, B.P., and Jónsson, H. (2000). J. Chem. Phys. 113: 9901.
- 31 Peng, C. and Schlegel, H.B. (1993). Isr. J. Chem. 33: 449.
- 32 Anderson, A.B., Roques, J., Mukerjee, S. et al. (2005). J. Phys. Chem. B 109: 1198.
- 33 Kroes, G.J. (2015). J. Phys. Chem. Lett. 6: 4106.
- 34 Jiao, Y., Zheng, Y., Davey, K., and Qiao, S.‐Z. (2016). Nat. Energy 1: 16130.
- 35 Nørskov, J.K., Bligaard, T., Rossmeisl, J., and Christensen, C.H. (2009). Nat. Chem. 1: 37.
- 36 Studt, F., Abild‐Pedersen, F., Bligaard, T. et al. (2008). Science 320 (5881): 1320–1322.
- 37 Stegelmann, C., Andreasen, A., and Campbell, C.T. (2009). J. Am. Chem. Soc. 131 (23): 8077–8082.
- 38 Wolcott, C.A., Medford, A.J., Studt, F., and Campbell, C.T. (2015). J. Catal. 330: 197.
- 39 Medford, A.J., Shi, C., Hoffmann, M.J. et al. (2015). Catal. Lett. 145: 794.
- 40 Calle‐Vallejo, F. and Koper, M.T.M. (2012). Electrochim. Acta 84: 3.
- 41 Zhang, J., Zhao, Z., Xia, Z., and Dai, L. (2015). Nat. Nanotechnol. 10: 444.
- 42 Zhao, Z. and Xia, Z. (2016). ACS Catal. 1553.
- 43 Zhang, L., Niu, J., Dai, L., and Xia, Z. (2012). Langmuir 28: 7542.
- 44 Yu, L., Pan, X., Cao, X. et al. (2011). J. Catal. 282: 183.
- 45 Wang, S., Yu, D., Dai, L. et al. (2011). ACS Nano 5: 6202.
- 46 Wang, S., Yu, D., and Dai, L. (2011). J. Am. Chem. Soc. 5182.
- 47 Conway, B.E. and Tilak, B.V. (2002). Electrochim. Acta 47: 3571.
- 48 Nørskov, J.K., Bligaard, T., Logadottir, A. et al. (2005). J. Electrochem. Soc. 152: J23.
- 49 Paraknowitsch, J.P. and Thomas, A. (2013). Energy Environ. Sci. 6: 2839.
- 50 Latorre‐Sánchez, M., Primo, A., and García, H. (2013). Angew. Chem. Int. Ed. 52: 11813.
- 51 Liu, Z.W., Peng, F., Wang, H.J. et al. (2011). Angew. Chem. Int. Ed. 50: 3257.
- 52 Yang, Z., Yao, Z., Li, G. et al. (2012). ACS Nano 6: 205.
- 53 Zhang, J., Qu, L., Shi, G. et al. (2016). Angew. Chem. Int. Ed. 55: 2230.
- 54 Zheng, Y., Jiao, Y., Jaroniec, M., and Qiao, S.Z. (2015). Angew. Chem. Int. Ed. 54: 52.
- 55 Zheng, Y., Jiao, Y., and Qiao, S.Z. (2015). Adv. Mater. 27: 5372.
- 56 Zheng, Y., Jiao, Y., Li, L.H. et al. (2015). ACS Nano 5290.
- 57 Zhu, Y.P., Guo, C., Zheng, Y., and Qiao, S.‐Z. (2017). Acc. Chem. Res. doi: 10.1021/acs.accounts.6b00635.
- 58 Zheng, Y., Jiao, Y., Chen, J. et al. (2011). S. Z. Qiao 20116.
- 59 Liu, J., Wang, H., and Antonietti, M. (2016). Chem. Soc. Rev. 45: 2308.
- 60 Shalom, M., Gimenez, S., Schipper, F. et al. (2014). Angew. Chem. Int. Ed. 53: 3654.
- 61 Gao, G., Jiao, Y., Ma, F. et al. (2015). J. Catal. 332: 149.