6
Assessment Report on Urban Transformation and Upgrading Capabilities in China
A Literature Review on Urban Transformation and Upgrading Research
The fields of urban transformation and upgrading have for some time been significant to both academic and policy study. More recently, such study has begun to address the challenges that have developed in the earlier period of industrialisation, such as resource shortage, environment deterioration, social tensions, the wide gap between rural and urban areas, and urbanisation lagging behind industrialisation. Here we explore the definition, pattern, and influential factors of urban transformation and upgrading in China.
The Content of Urban Transformation and Upgrading
In the early stages, scholars defined urban transformation mainly from political and economic perspectives. Gérard Roland asserts that transformation is a process of a large-scale institutional change.1 Similarly, Wu proposed that urban transformation was relevant to land development and housing commercialisation and that it was fundamentally a political-economic process.2 However, more recently a broader framework of factors has been identified. Urban development and transformation is interpreted as a systematic process of continuous adjustments and improvement of urban systems which not only involves the transformation of urban economic, social, and ecological systems, but also the transformation of urban landscape and urban management systems.
Economic Transformation
Speeding up the economic transformation and improving the urban functions are key points in rejuvenating the urban development capacity. Urban economic transformation involves a series of structural changes in terms of industries, economic operating system, organisation, and management. Capital, technology, talents, and market are important influencing factors in urban economic transformation. Effective guidance and support from government can help to foster a favourable macroeconomic environment for urban economic transformation. The pattern of economic transformation includes industrial diversification, high-end orientation, and upgrading.3 Based on the analysis of various industrial sectors on the outskirts of the Copenhagen metropolitan area, Hansen and Winther noted that the service economy is the dominant trajectory of urban economic transformation.4 In order to fully grasp the nature and impact of urban transformation any performance evaluation system needs to examine not only objective criteria but also the subjective perception of urban dwellers.5
Social Transformation
Along with the rapid progress of urbanisation, the disequilibrium between rural areas and urban areas is widening, which affects the sustainable development of economy and society. Thus speeding up the process of urban social transformation is a decisive part in the construction of an overall well-off and innovative society. It is a precondition for further wealth creation in the countryside. As a start, social transformation means discovering fairer social welfare mechanisms with innovation in social security and fiscal policies such as income allocation and taxation management.
The essence of a harmonious urban society is improving people’s lives and their sense of well-being. Public policies have decisive effects on urban social transformation, with decision makers always seeking to solve complex policy dilemmas.6 For example, social welfare policies in some German cities have changed from ‘employment centred’ to ‘family supporting’ to reflect a much more embracing typology of social need. Some local governments in Germany offer transportation subsidies to inhabitants in order to increase the degree of population suburbanisation.7,8
Cultural Transformation
As urbanisation intensifies, cultural life becomes a more important issue. There is a greater sensitivity to cultural institutions, value orientation, and historical background. Urban culture development is a strategic priority for urban regeneration in many European cities; for example, in London the cultural industries are one of three leading components for urban economic development.9,10
A specific cultural institution, ‘Cultiva’, in the Norwegian city of Kristiansand has been set up to attract both investment and talent, as a core element for urban cultural and economic development.11 The idea of the ‘creative city’ is now at the heart of many urban development plans.12
Ecological Transformation
Environmental problems such as global warming and resource exhaustion have become severe challenges for urban sustainable development. Ecological transformation must try to establish a sustainable development mode that emphasises improving environment quality, protecting natural landscapes, keeping ecological balance, and increasing residential habitability. There are already many international examples to consider. For instance, Baltimore’s Inner Harbor has been modified into a sightseeing destination through ecological transformation, displaying a development mode from industrial civilisation to ecological civilisation.13 From the perspective of urban ecological transformation, domestic Chinese scholars have studied environmental protection and ecological transformation measures such as creating green residential environments in order to change the urban–rural dual structure.14
Main Patterns of Urban Transformation and Upgrading
Headquarters Economy Pattern
The headquarters of high-end industries are located in the city centre, while manufacturing and processing at the low end of the value chain are usually located in less developed cities. The siting of headquarters can not only help big cities to gain a resource advantage but can also help them to realise economic transformation by enhancing their economic drive and radiation capabilities – the impact they have on the surrounding area. Currently, several Chinese cities have entered into the development stage of a headquarters economy.15
Knowledge City Pattern
This essentially means redefining an urban area that already has important attributes such as universities and available land for new start-ups and cultural locations as knowledge hubs. The land and buildings are usually recycled from redundant industrial and warehouse sites.16 A notable example is Melbourne – designating itself as a learning society, it gets a competitive boost by attracting high-quality talent, and a wide spectrum of cultural industries and activities. It is summed up as a human-centred city in Melbourne Planning (2010) and Melbourne Urban Strategy (2030).17
Following this example, the city of Shenzhen has implemented new ‘branding’: once it was ‘assembled’ or ‘made’ in Shenzhen, now it is ‘Invented in Shenzhen’.
Ecological City Pattern
If the earlier patterns have become embedded in urban development then in a post-industrial economy a pattern of recycling becomes more feasible. A recycling pattern helps to reduce economic cost by combining enhanced economic performance with a positive environmental effect.18 Components of this pattern include establishing a recycling system both for industry and domestic consumption.19 This pattern of development has taken hold since the 1980s, concentrated around environmental beautification and resource recycling.20
Evaluation Indices for Urban Sustainable Development
Since the 1990s, scholars have sought to measure sustainable urban transformation through various sets of criteria, often in the form of an urban index, each with a set of concepts, principles, and frameworks. These have been essentially quantitative in methodology.
Using the BP Neural Network model, Zhu Mingfeng, Hong Tianqiu, and Ye Qiang analysed the economy and sustainable development situation in some resource-based cities.21 By using the Ecological Footprint Theory, Zang Shuying, Zhi Ruizhi, and Sun Xuemeng analysed the ecological footprint of the city of Daqing from 1980 to 2001, and gave a quantitative evaluation report of the sustainable development capability of the city.22
However, many studies in the field of urban sustainable development evaluation give no more than a suggestion about their index system and evaluation method. They are not able to provide relevant empirical analysis. The evaluation index systems are mainly constructed from two perspectives: that of the economy, society, environment, and resources, or that of development and coordination levels. Most of the studies are focused on the analysis of urban industrial structure and are not perfect in the analysis of industry choice. In terms of research method, most of the studies are descriptive, and lack in-depth empirical analysis.23
Factors to Influence Urban Transformation and Upgrading
Wei Lihua, Lu Ming, and Yan Xiao Pei argue that in the early period of urbanisation it is the transition from an agricultural to an industrial economy that drives change.24 During this transition, urbanisation is the key means to realising social transformation, while industrialisation is the fundamental driving force to realise urbanisation. This may be an adequate description of an earlier period but Zhu Tiezhen points out that as the city develops the process of urban transformation is actually a process of urban innovation. Without innovation, the functions of cities cannot be improved, strengthened, and diversified.25 Ye Yumin and Tang Jie stress the importance of leading industries in urban transformation. They assert that urban transformation depends on economic adaptation and replacement of the previously leading industries.26
From a geographical perspective, Chai Yanwei and Zhang Chun study the transformation from ‘unit people’ to ‘community people’ and suggest that urban spatial transition comes after the social transition.27 Considering urban transformation as the deepening of urbanity, Li Yanjun points out that urban transformation involves both economic transformation and, increasingly, social transformation.28
Urban transformation in China demonstrates three interrelated and supportive pillars: industrial transformation, a growing middle class, and institutional innovation. Industrial transformation supports economic transformation, the rise of the middle class supports social transformation, and institutional innovation provides a guarantee for economic and social transformation.
Wei Houkai believes that the driving factors of urban transformation must include: the mindset of urban development, the stage of urban development, resource endowment, technology, and consumption demand.29 Wu Fulong points out that urban transformation is the result of interaction between internal and external factors. External factors involve the change of production mode from Fordism to post-Fordism, the appearance of a more specialised production system, diversified consumer demand, and the rapid global expansion of capital.30 The internal factors stem from local government policy, the activities and aspirations of citizens, and the sense of how liveable the city is. Logan emphasises the importance of globalisation. He claims there are three driving forces of urban transformation: market-oriented institutional transformation, rural-urban transition, and the forces of globalisation.31
Critical Mass in Urban Transformation and Upgrading Capability
Urban transformation and upgrading should develop an incremental and self-development capacity as proposed by Lin Yifu.32 Following on from this, Li Qingchun proposed that this internal dynamic become a prerequisite for sustained urban transformation.33 Wang Ke broadened this idea by suggesting that this applies at a regional level – a totality of natural and social productivity in a region covering the natural, material, human, and social capital.34 Cen Jie et al. pointed out that regional self-development ability is the overall capacity for sustainability in the region, which embraces resource integration, innovation, and operational abilities.35
Michael Porter proposed the Diamond Model, which helps to explain systematically urban transformation and upgrading capabilities.36 Porter proposes that the following four factors can decide the competitiveness of a specific industry or country:
- ■ Production factors – including human resources, natural resources, knowledge resources, capital resources, and infrastructure.
- ■ Demand factors – mainly domestic demand.
- ■ The performance of relevant and supportive industries – whether these possess international competitiveness is of great significance.
- ■ Strategies and competition structure – the performance of any given city is measured against that of its competitors.
Porter suggests that these four factors are interactive, forming a diamond system (Figure 6.1). Around the factors, there are two variables: government and opportunity. Opportunity is less controllable but initiative can be taken and opportunities seized, and this is where the influence of government policies should not be ignored.
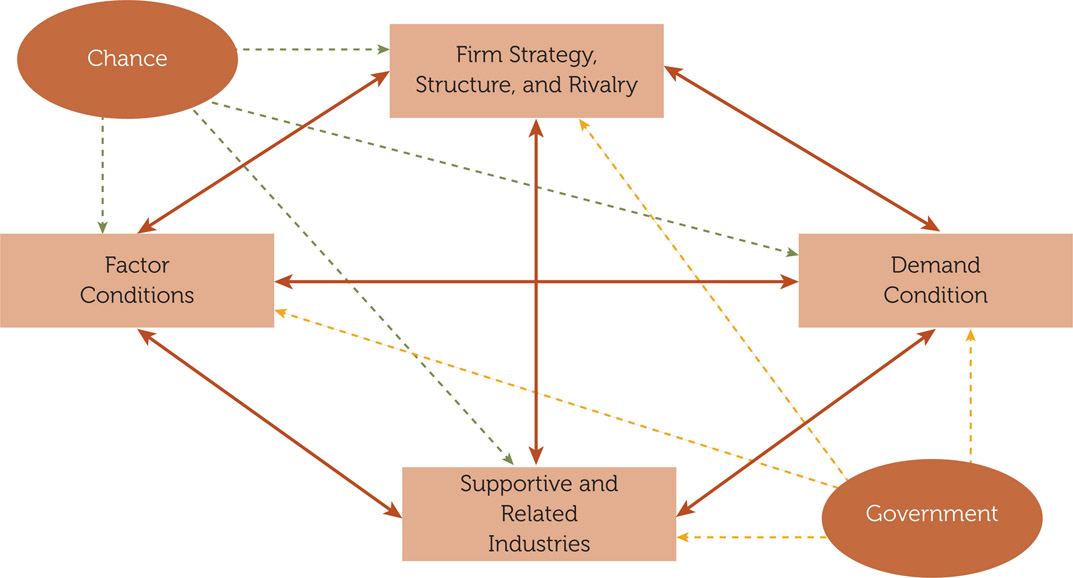
Figure 6.1: Michael Porter’s Diamond Model
In summary, Urban Transformation and Upgrading Capability refers to the capacity for the integration, organisation, and allocation of a totality of resources: natural, material, human, cultural, and social, within the region. It also addresses the relationship to the external environment based on regional location advantage and resource endowment.
The Evaluation Model of Urban Transformation and Upgrading Capability in China
The Principles for Selecting the Index
The Urban Transformation and Upgrading Capability index for China developed in CELAP is based on existing research. The principles for selecting the specific indicators are ‘scientific’, ‘critical’, and ‘practical’. The index system corresponds to the theory and evaluation method of city transformation outlined earlier. The index indicators are concise and representative enough to describe the overall situation. They are also accessible, so that we can continuously monitor the evolutionary trend of Chinese Urban Transformation and Upgrading Capability.
The Original Version of the Evaluation Index
The research team sent questionnaires to relevant experts and acquired anonymous feedback from them. And then, we formed a panel of experts to discuss the index system. We set up the original version of the index system including 22 indicators (see Table 6.1). In order to set up a fair and objective evaluation system, the original data for these indices came from the China Urban Statistical Yearbook 2012. We obtained all the 22 indicators for the 287 cities on China’s mainland for 2011. Since we cannot get the relevant data for the city of Lhasa in the Tibet Autonomous Region, this is not included in the ranking and evaluation. We used principal component analysis to process the data. By using the dimension reduction method, principal component analysis can convert multiple factors into a few comprehensive factors.
Table 6.1: The Evaluation Index of Chinese Urban Transformation and Upgrading Capability (Original Version)

With indicators for 287 cities (except Lhasa of the Tibet Autonomous Region) as samples, we set up a matrix with the standardised data variables of the 22 indicators and applied statistical software SPSS 18.0 to process the data. The testing coefficient of Kaiser-Meyer-Olkin (KMO) Measure of Sampling Adequacy is 0.769 (bigger than 0.7), which means the data is suitable for factor analysis. The testing coefficient of Bartlett’s test of sphericity also shows that the data is suitable for factor analysis. According to the connotation of the self-development ability, we selected the principal components based on the criterion that matrix Eigenvalue is greater than 1.
Eight Eigenvalues were selected as principal components, with accumulative variance up to 65.021 per cent. Since the obtained factor cannot sufficiently reflect the index information of principal components, we use the varimax rotation method to acquire extraction results and regression coefficient, so the principal components are determined (see Table 6.2).
Table 6.2: Matrix of Rotation Components
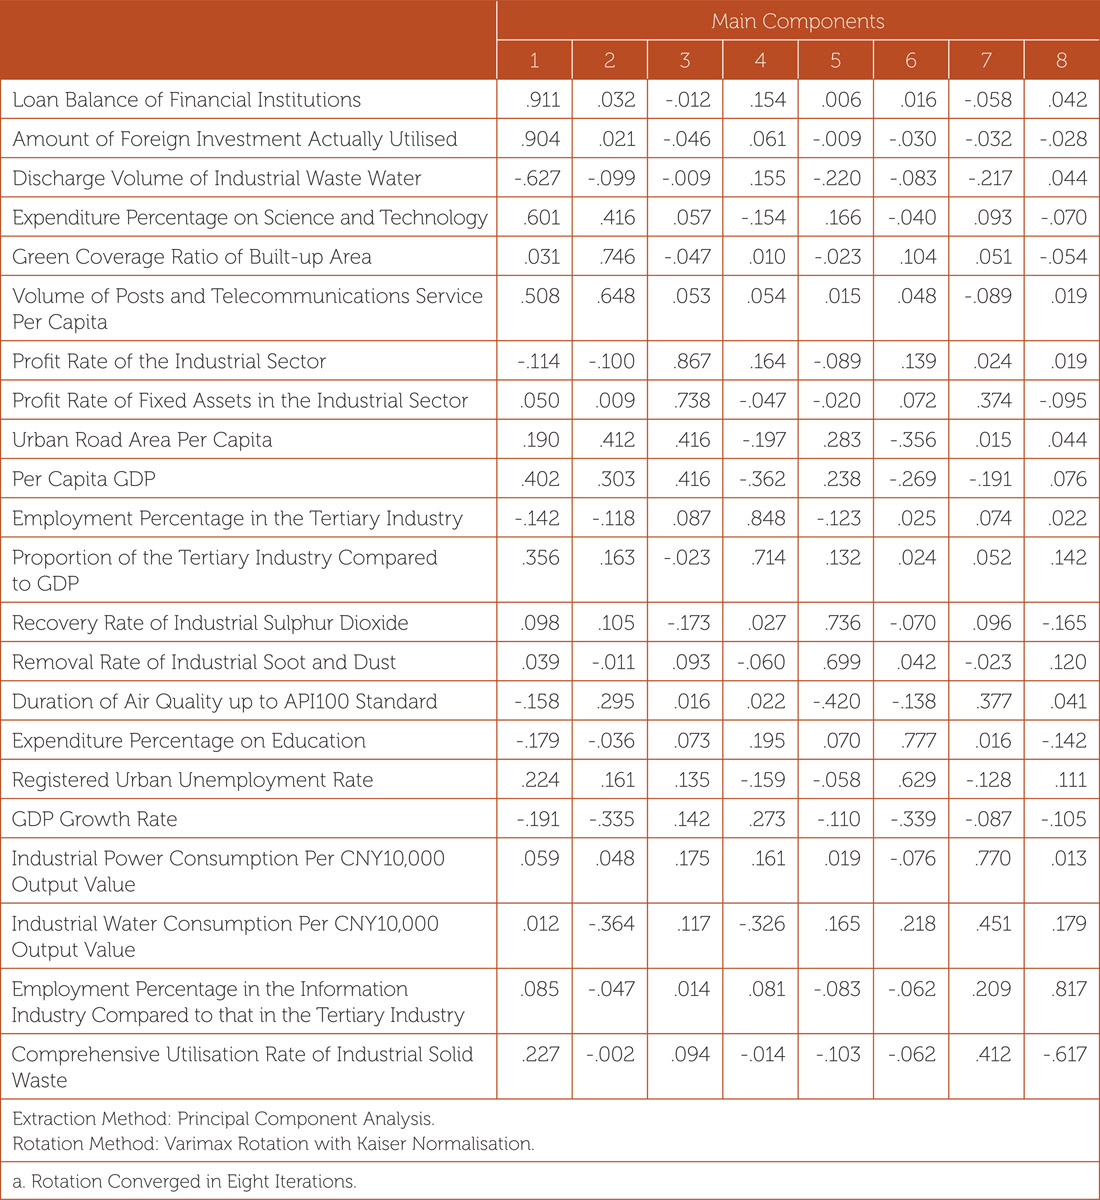
From Table 6.2, we can discern:
- ■ The load coefficients with higher absolute value from the first principal component are: the loan balances of financial institutions, amount of foreign investment actually utilised, expenditure percentage on science and technology, discharge volume of industrial waste water. In summary, they represent regional financing capability and science and innovation capability.
- ■ The second principal component shows green coverage of built-up areas, volume of posts, and telecommunications service per capita. These factors represent the situation for the ecological environment and the penetration levels of communication service.
- ■ The third principal component shows the profit rate in the industrial sector, for fixed assets in the industrial sector, urban road area per capita and per capita GDP. These represent the overall urban development level and industrial development efficiency.
- ■ The fourth principal component shows employment percentage in the tertiary sector and the proportion of the tertiary sector in the GDP. This represents the urban economy structure.
- ■ The fifth principal component shows the recovery rate of industrial sulphur dioxide, removal rate of industrial soot and dust, and duration of air quality up to API100 standard. These represent the degree of ecological and resource-intensive utilisation.
- ■ The sixth principal component shows the expenditure percentage on education, registered urban unemployment rate and GDP growth rate. These represent human capital capability.
- ■ The seventh principal component shows industrial power consumption per CNY10,000 output value, industrial water consumption per CNY10,000 output value, and comprehensive utilisation rate of industrial solid waste. These represent the capability to effectively use industrial resources.
- ■ The eighth principal component shows the employment percentages in the information industry within the broader tertiary sector industry. This represents the urban informatisation level.
The Revised Version of the Evaluation Index
Index System
Our research team gave the original version of the index system and the analysis results for the eight principal components to a panel of experts and acquired anonymous feedback. We held a series of seminars to discuss and modify the original version of the index.
In order to continuously analyse and evaluate the Urban Transformation and Upgrading Capability in China, the index contains five secondary indexes with 28 third-grade indicators. The secondary indexes are comprehensive economic development capability, scientific and technical innovation capability, urban development effectiveness, suitability for living, and entrepreneurship and financing capability.
Although principal component factor analysis can convert the multiple factors to a few representative comprehensive factors, and determine the weight according to the variance, it is difficult for the method to track and compare the analysis results in different years. This is because the representative factors and weights calculated from the data of different years vary and are not comparable. In order to continuously track and compare, we assessed the analysis result based on 2011’s data, and modified the original version of the index system. The revised version of the index system is in Table 6.3.
Data Source
In order to carry out a fair and objective evaluation, we took the data to make 26 indicators from the China Urban Statistical Yearbook. The data of a number of listed companies in the Small and Medium Enterprise Board and Growth Enterprises Market is quoted from public data released by the China Securities Regulatory Commission. The data for the number of companies selected from the 500 most valuable companies in China is quoted
Table 6.3 The Evaluation Index of Chinese Urban Transformation and Upgrading Capability (Revised Version)
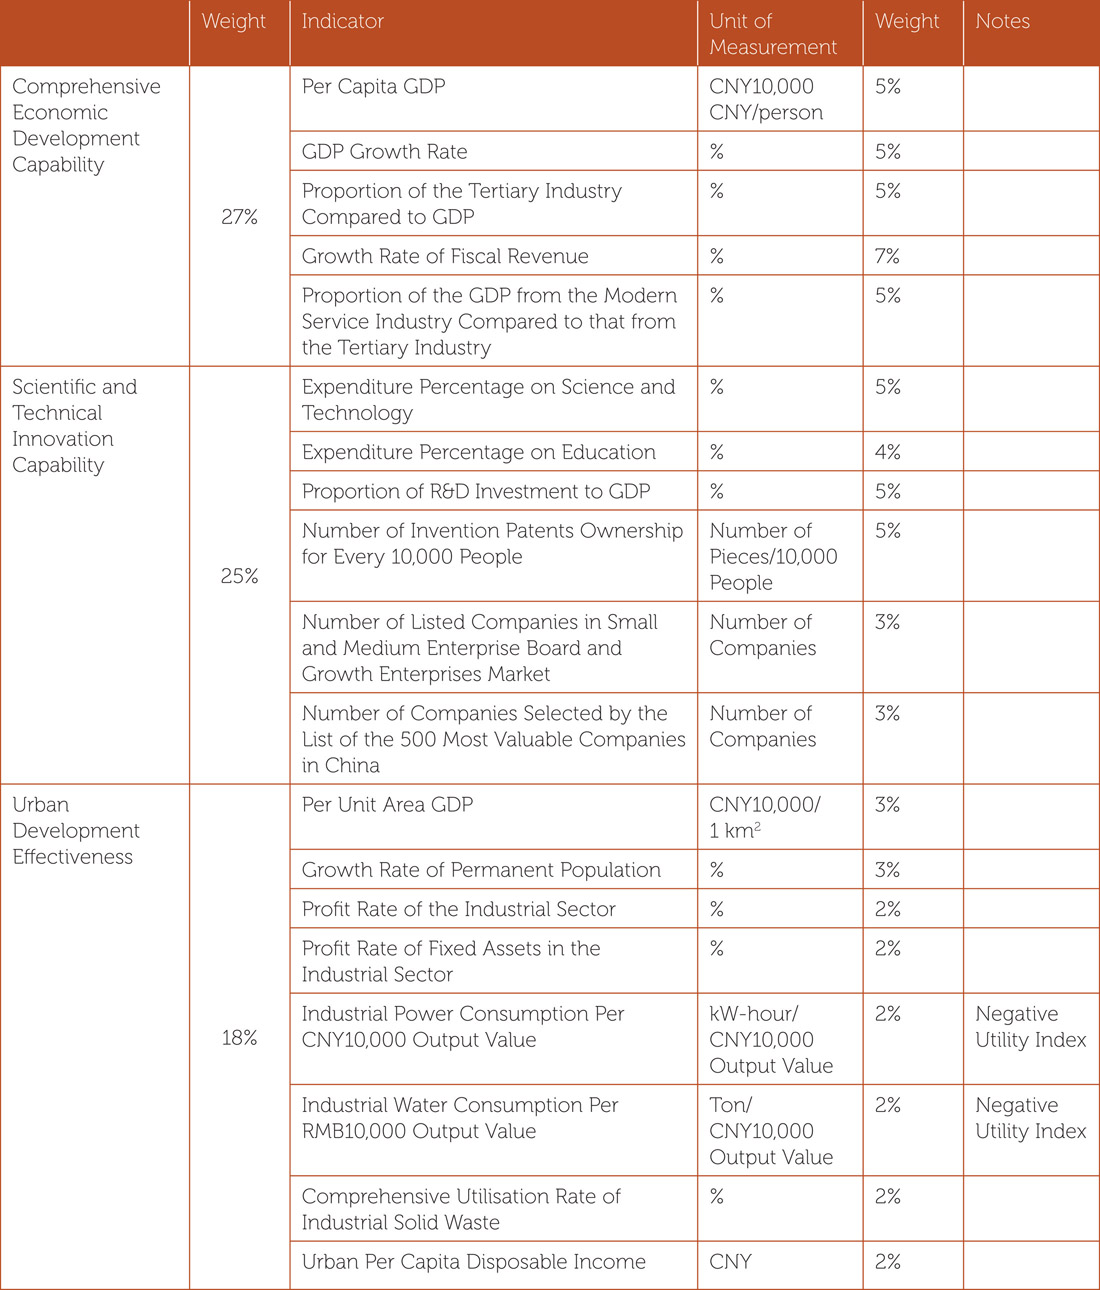

from the rank list released by the World Brand Lab. We then collected all the data for 28 indicators for 289 cities on the Chinese mainland.
Non-dimensionalisation of Data
We introduced non-dimensionalisation to eliminate the influences derived from dimension differences of these 28 indicators. The common methods of non-dimensionalisation include utility value treatment, standardisation treatment, and functional treatment. We adopted the utility value treatment method to remove the influence of non-standardised dimensions in indicators. The range of utility value is 0.100, with maximum utility value of 100 and minimum of 0. Since the influence of the indicator with positive utility values is the opposite of the indicator with negative utility values, the non-dimensionalisation treatment formulas are different:
When Vij is a positive utility indicator, the higher the original value, the higher the utility value.

When Vij is a negative utility indicator, the higher the original value, the lower the utility value.

Yij represents the utility value of i indicator from evaluation object j.
Vij represents the original data of i indicator from evaluation object j.
Vimax represents the maximum value among all the original values of i indicator.
Vimin represents the minimum value among all the original values of i indicator.
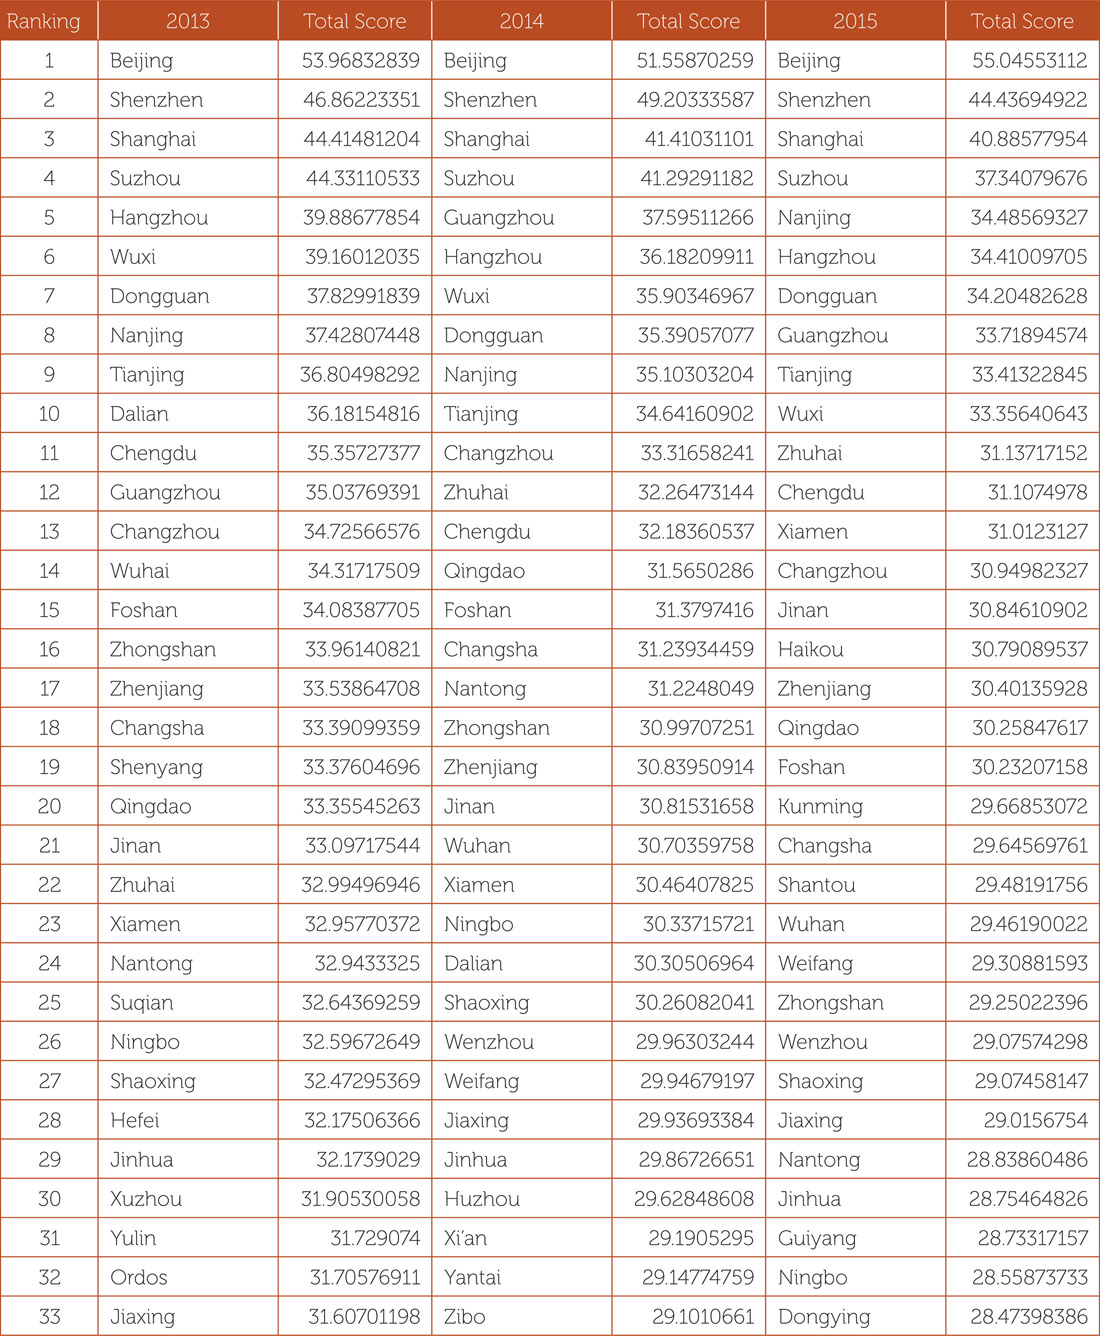
The Ranking of China’s Urban Transformation and Upgrading Capability
Using the indicators for 289 cities we built a matrix with the standardised data variables, applying statistical software SPSS 18.0 to process the data. On the basis of this comprehensive evaluation we ranked the top ten cities at sub-provincial and municipality level, and the top ten cities at prefecture level (see, respectively, Tables 6.4 and 6.5). Since we cannot obtain the relevant data for Haidong in Qinghai Province, this city is not included in the ranking and evaluation.
From 2012 to 2014, Beijing, Shenzhen, and Shanghai were the top three cities in the same ranking order. Nanjing, Hangzhou, Guangzhou, Tianjin, and Chengdu were among the top ten cities for all three of these years. There was intense competition for fourth place. Hangzhou ranked fourth in 2012, Guangzhou in 2013, and Nanjing in 2014.
From the view of spatial distribution, the top ten cities at sub-provincial and municipal level and the top ten at prefecture level were mainly located in the east of China. Chengdu and Wuhan were the only two cities represented from the Central, Western, and Northeast regions of China, at sub-provincial and municipal level. Chengdu ranked eighth place in all three years. Wuhan only ranked number ten in a single year, 2012.
The dominance of the eastern seaboard was even more pronounced in the ranking of prefecture-level cities. Kunming was the only city from the Central, Western, and Northeast regions of China, and entered the top ten in 2012.
The centres of urban development at present remain in and around the Yangtze River Delta, the Pearl River Delta, and Beijing–Tianjin–Hebei Region. The Yangtze River Delta has the most competitive strength and plays a strategic role. From 2012 to 2014, besides Shanghai, Hangzhou in Zhejiang Province and Nanjing in Jiangsu Province were among the top ten cities at sub-provincial level. From 2012 to 2014, Suzhou, Wuxi, Changzhou, and Zhenjiang, also in the Yangtze River Delta, were among the top ten cities at prefecture level. In addition, Nantong was in the top ten at prefecture level in 2012 and 2013. Shaoxing was among the top ten at prefecture level in 2013.
Table 6.4: Top Ten Cities of Urban Transformation and Upgrading Capability among Sub-provincial Cities and Municipalities

Table 6.5: Top Ten Cities of Urban Transformation and Upgrading Capability among Prefecture-level Cities

The Pearl River Delta region is the pioneer of reform and opening-up, and is at the same time one of the main economic centres. Shenzhen and Guangzhou were among the top ten cities at sub-provincial level in all three years. Dongguan, Foshan, and Zhuhai were among the top ten cities at prefecture-level in all three years. Zhongshan made the top ten at prefecture level in 2012 and 2013, and Shantou was among the top ten cities in 2014. Hong Kong and Macao were not included in the ranking. Hong Kong, Macao, and Guangzhou are at the centre of the Pearl River Delta region, while Shenzhen, Foshan, and Zhuhai are important sub-centres.
Xiamen, the capital of Fujian Province, to the north of Guangdong on the eastern seaboard, was in the top ten sub-provincial cities. The cities in Fujian Province with the new opportunities of a Free Trade Area and as part of the Sea Silk Road strategy are well placed to move up the rankings.
The Beijing–Tianjin–Hebei region is the largest city agglomeration in North China, and the gateway for the opening-up of this area. From 2012 to 2014, Beijing took first position in the ranking list, and Tianjin was also among the top ten. However, these advanced large cities are surrounded by a backward hinterland – this is the main issue to be addressed in the region.
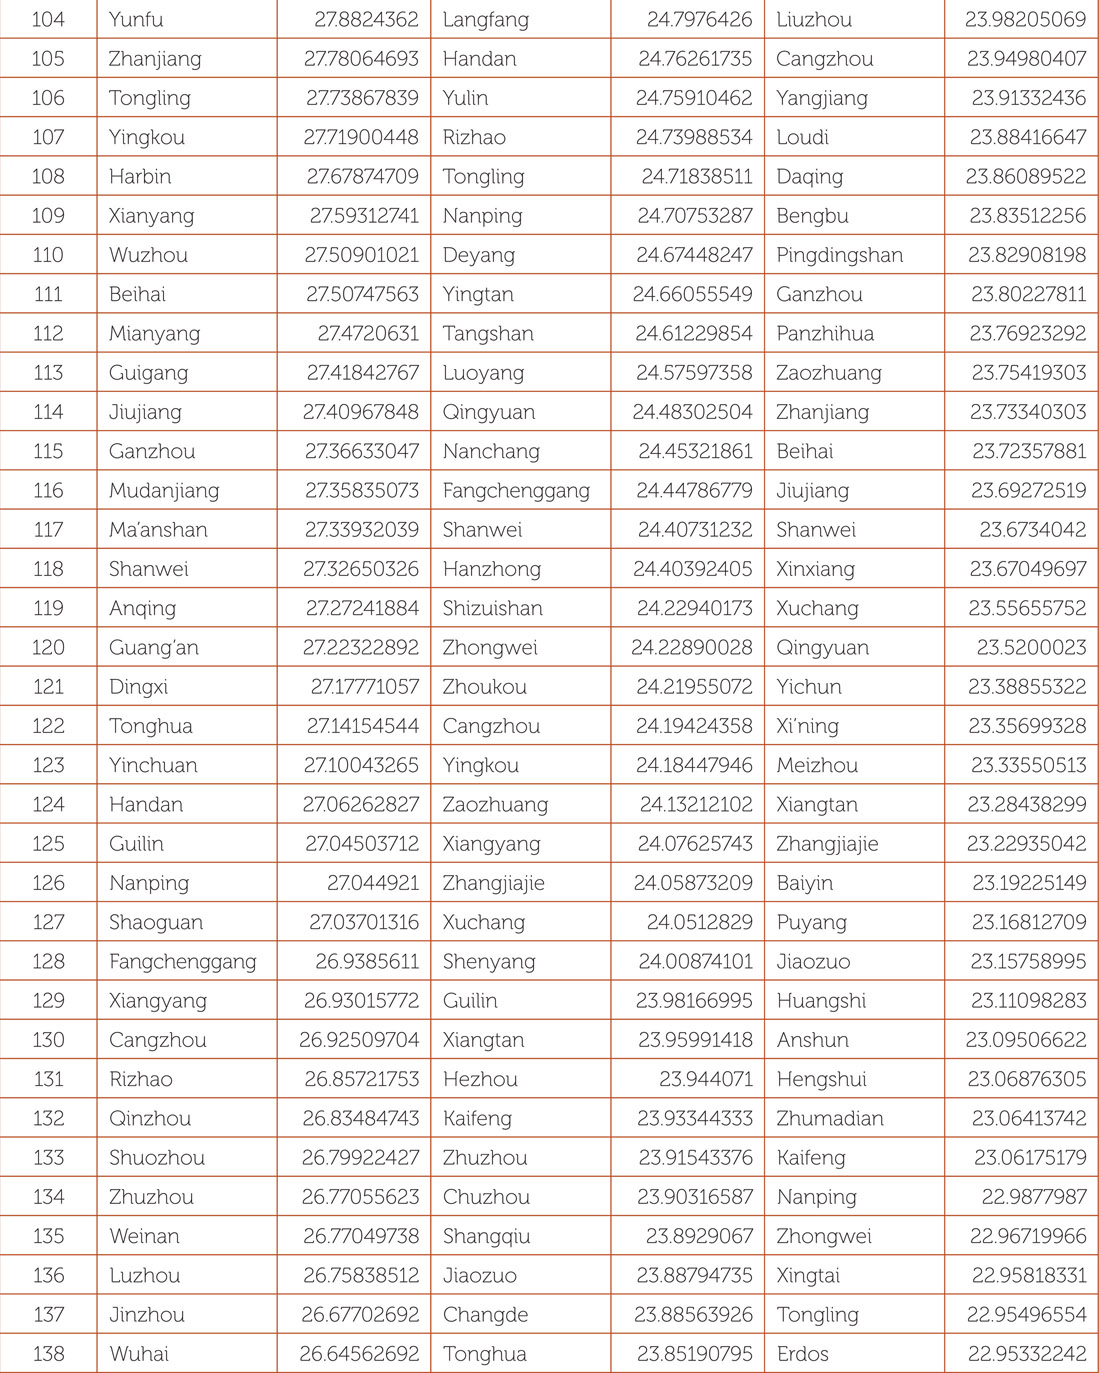
In Hebei Province, only four of 11 cities (Shijiazhuang, Langfang, Qinhuangdao, and Handan) were among the top 100 cities at prefecture level. On 30 April 2015, the Political Bureau of the CPC Central Committee held a meeting to examine and approve the Plan for the Coordinated Development in Beijing–Tianjin–Hebei Area. This means the coordinated development of Beijing, Tianjin, and Hebei is now a national strategy. The core is to shift the non-capital functions of Beijing. Breakthroughs are expected to be made in the field of transport integration, ecological environment protection, industrial upgrading, and transfer. On 1 April 2017, China announced the plan to create the Xiongan New Area in Hebei Province. The launch of this new area is expected to host some of Beijing’s non-capital functions, to explore a new model of optimised development in densely populated areas, and to restructure the urban layout in the Beijing–Tianjin–Hebei Region.
Cities in China’s central region are now developing rapidly, and their urban transformation capability has improved, but compared with the cities in the eastern region their overall competitiveness is still weak. Changsha was the only city among the top ten cities of sub-provincial and municipal status in 2013.
The western region is richly endowed with natural resources and its market potential is promising. Although the western region has a crucial strategic position especially in relation to the One Belt and One Road Initiative, it must overcome the legacy of its historic underdevelopment and isolation. In recent years, more rapid development has taken place, mainly in Chengdu–Chongqing, Guanzhong–Tianshui, and the Ring Beibu Gulf Region. As noted, Chengdu was among the top ten cities in this period.
In the same region Chongqing, an inland port on the Yangtze River, has built on its historic role as a political, economic, cultural, and social centre but it has yet to reach the top ten. Chongqing was the seventeenth in the ranking of the sub-provincial cities; and around fiftieth across the whole ranking (forty-sixth in 2012, fifty-second in 2013, and forty-eighth in 2014).
Heavy industry developed first in Northeast China. However, in recent years, this old Rust Belt economy has experiencing a sharp recession and it has become a region with a net outflow of population. Dalian was the only city that was among the top ten cities at sub-provincial level in 2012, and has been the most successful in upgrading the economic structure.
In 2011, the urbanisation rate in China passed 50 per cent. By 2014, the rate reached 54.77 per cent. Major changes have taken place in the urban spatial patterns and the urban system. The mere input of economic factors is no longer enough to achieve sustainable urbanisation. New problems and challenges must be met.
Location, size, and structure determine the possibilities for enhanced urbanisation. Cities must accelerate using technology and innovation: a shift from a factor-driven mode to an innovation-driven one. Urban development must be transformed from extensive to intensive growth. The cities in the eastern coastal region, starting from a higher base, will have to lead this. Metropolises such as Beijing and Shanghai are facing an increasing population pressure, which intensifies the tension between developmental potential and comprehensive carrying capacity.
During the transformation from the planned economy to the market economy, most cities in China mainly relied on low-cost activities. With the comparative advantage of cheap labour, they drew in low-end manufacturing from all over the world. In the present circumstances, further change must confront the first-mover advantage in developed countries and also late-mover advantages in more recently developing countries. Cities such as Suzhou, Dongguan, and Foshan, which prospered in the earlier phase as export-oriented cities, need to adopt a strategy of high-end innovation.
The need for ecological transformation is compelling. The ultimate purpose of the city is to improve quality of life, and to offer harmony between people and the natural environment. In recent years, although efforts have been made to protect the environment, pollution problems are still serious. Beijing took the number one position in the index but throughout the year citizens have to cope with ‘fog and haze’ and sandstorms from the north. Administrative means are useful in the short run, but they just scratch the surface of this problem. So, the governance of fog and haze requires long-term planning and implementation. It is possible to achieve the dual goals of economic development and pollution reduction with the help of technological progress and institutional regulation.
Cities face sometimes crisis levels of exhaustion of resources. Resource-based cities all over the world generally experience a common evolution: an initial stage, development stage, prosperity stage, declining stage, and fading-away stage. In China, most resource-based cities have experienced the stages of ‘exploiting resources, building industrial bases, forming urban cities’.37 For too long they have relied on just a few natural resources, which has deformed the economic structure. Such cities are confronted with the following problems: exhaustion of resources, imperfect industrial chain, environmental deterioration, and vulnerable sustainable development capability.
The financial capability of local government is a critical foundation for urban transformation and upgrading, and in turn, successful transformation and upgrading is helpful to improve solvency. Local government spending has played an important role in accelerating urban transformation, infrastructure construction, and improving people’s livelihood, but at the expense of heavy local debt. Many local governments rely on the income from land transfer to promote urbanisation and transformation, which also exacerbates the problem of local debt. On 30 December 2013, the National Audit Office issued a national audit report of local governments. At the end of June 2013, the total amount of debts that local governments had to repay was up to CNY10.88 trillion. The total amount of debt that local governments had to guarantee liability for was up to CNY2.66 trillion, and the total amount of contingent liability that local governments had part of salvage obligation for was up to CNY4.33 trillion. Generally speaking, the risks of government debts in China are under control because of the huge reserves at the centre, but there are hidden financial troubles in some cities. The Chinese government now seeks to carry out public–private partnerships (PPPs), and to replace the high-interest loans with low-interest local treasury bonds in order to ease the financial burden on local government.38
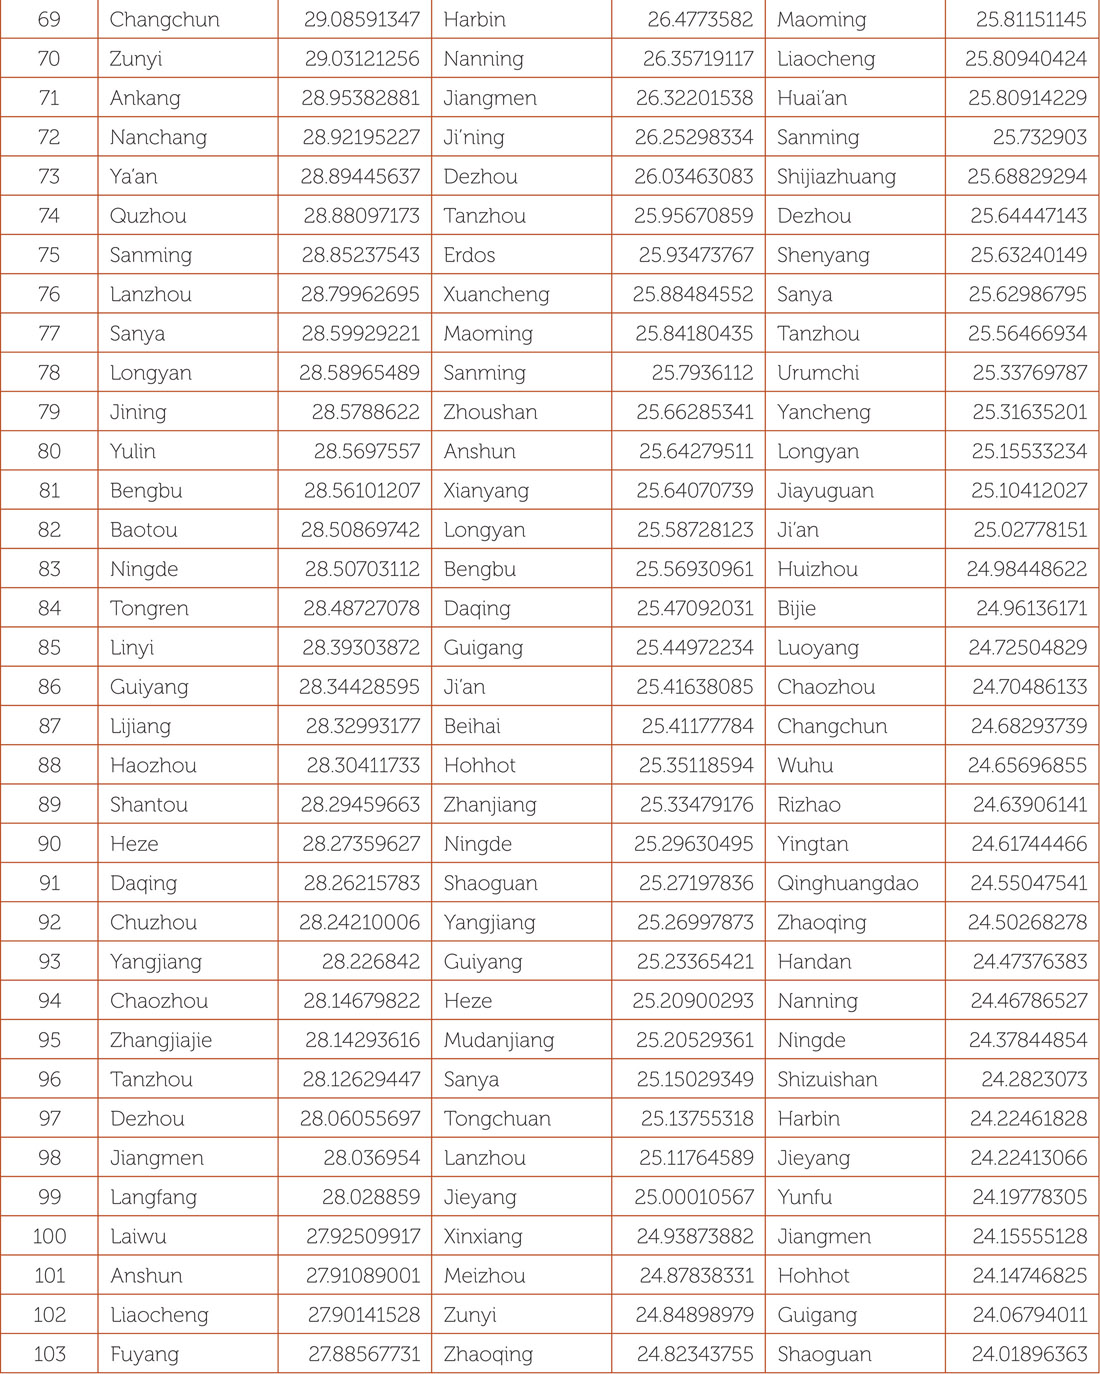
Table 6.6: Comprehensive Ranking of China’s Urban Transformation and Upgrading Capability (2012–14)