Cisco Secure Scanner Configuration
Now that you have looked at the main features of the Cisco Secure Scanner, this section covers the configuration of the software with the goal of creating a session to check a sample network for security vulnerabilities. This configuration example is provided as a basic example, with steps you can emulate in your workplace to check your internal networks for security vulnerabilities.
This section includes four steps to create the session and ultimately report on the collected data. These steps require using the features that were described previously in this chapter. The steps are as follows:
Step 1. |
Running Cisco Secure Scanner |
Step 2. |
Creating a session to capture data |
Step 3. |
Interpreting the collected data |
Step 4. |
Reporting on the collected data |
Step 1: Running Cisco Secure Scanner
Once you have successfully installed and licensed the Cisco Secure Scanner for your chosen platform, you have to start the scanning application. This example uses the Cisco Secure Scanner V2.0 for Windows NT.
Figure 7-12 shows the network diagram that you are going to use for this exercise.
Figure 7-12. Sample Network Diagram
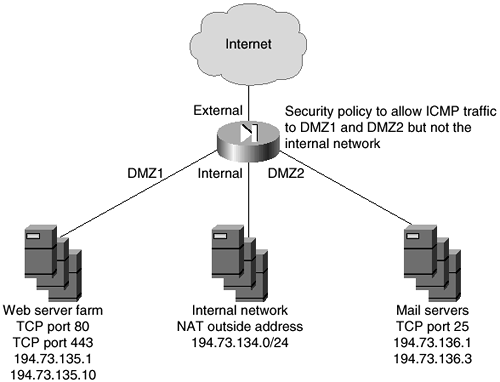
You can see in Figure 7-12 that this is a simple network that could represent a corporate Internet connection.
The main connection to the Internet from the corporate network is through an Internet-facing firewall with four interfaces. Interface 1 is connected to the Internet, interface 2 is connected to the internal network, interface 3 is connected to DMZ1, and interface 4 is connected to DMZ2.
Table 7-2 shows the simple security policy installed on the firewall.
| Source | Destination | Service | Permit/Deny |
|---|---|---|---|
| Any | Web servers | TCP Port 80 | Permit |
| Any | Web servers | TCP Port 443 | Permit |
| Any | Web servers | ICMP | Permit |
| Any | Mail servers | TCP Port 25 | Permit |
| Any | Mail servers | ICMP | Permit |
| Any | Internal network | ICMP | Deny |
Step 2: Creating a Session to Capture Data
The first thing that you need to do is create a session to capture the required data. To do this, click the Create New Session command button that is located in the top left corner of the Cisco Secure Scanner application window. Once the session configuration screen is displayed, you need to configure a session that will enable a scan of the DMZ1, DMZ2, and internal networks. You might ask why you are scanning the internal network. This is to confirm that the firewall is blocking access to inbound services on the internal network. You know that ICMP is not allowed to the internal network, so you will have to force a scan of these addresses.
For this exercise, the scanner will be run from the Internet.
Figure 7-13 shows the required configuration settings for the IP addresses in the session.
Figure 7-13. Session Configuration Settings
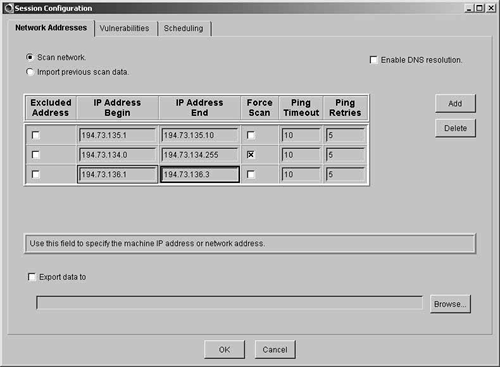
In Figure 7-13, you can see three configuration lines for the session. The first line configures the session to scan the Web servers on DMZ1. The second line configures the session to scan the internal network, and the third line configures the session to scan the mail servers on DMZ2. Note that the Force Scan checkbox is checked on the second configuration line. Because ICMP is not permitted through the firewall for the internal interface, forcing a scan is the only way to scan the hosts on the internal network. If you leave this blank, no hosts on the internal interface would be added to the network map because the scanning software would presume that the hosts are down.
The next step is to configure the ports for the scan and the active probes. Click the Vulnerabilities tab to display these options.
In this instance, you want to scan the well-known ports for both TCP and UDP. Do this by clicking the Well-Known Ports option for both TCP and UDP. You must then enable the active probes and select the Windows_Heavy profile, because you do not have any UNIX machines on the network. All of the active probes that correspond to known vulnerabilities on hosts running Windows as the operating system are then selected.
Figure 7-14 shows the finished port and probe configuration.
Figure 7-14. Port and Probe Configuration Settings
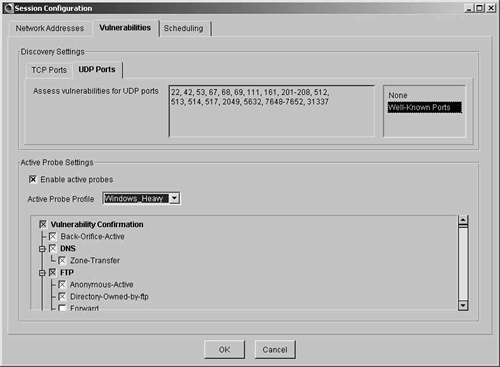
You can see the settings explained in the previous paragraph in Figure 7-14. Well-Known Ports and the Windows Heavy probe profile are selected.
The last tab on the session configuration screen is the Scheduling tab. Here you can set a schedule for the scan to run. The default is Immediately, but you have the option to choose a time of day and also the day and frequency of the scan. For this demonstration, you are going to configure the scan to run at 0700 every Monday. Figure 7-15 shows this configuration.
Figure 7-15. Scheduling Settings
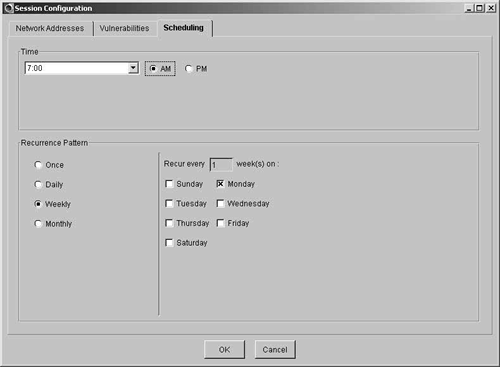
Figure 7-15 shows that the scan is set to run every week on a Monday at 0700. As long as the host with the Cisco Secure Scanner application installed is running the software at this time, the scan will occur. If not, the scan will occur the next time the software is run.
NOTE
It is possible to run Cisco Secure Scanner as a Windows NT service. This means that the scans would run even though the application is not loaded. Refer to the product manual for instructions on how to do this.
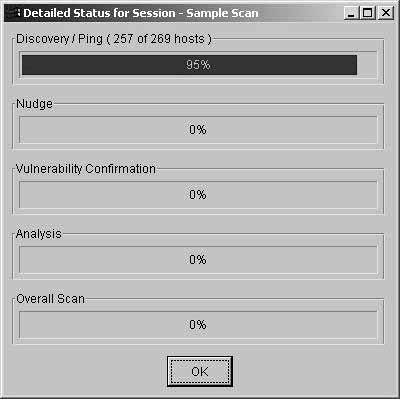
Clicking OK at this point will make the scan session ready for the next Monday morning at 0700. At that time, the scan will start, and you will see the scan status screen as shown in Figure 7-16.
Figure 7-16. Scan Status Screen
Step 3: Interpreting the Collected Data
After the scan has run, you will be presented with a result set item under the name of the session in the main Cisco Secure Scanner application window. This can be seen in Figure 7-17.
Figure 7-17. Scanner Application Window
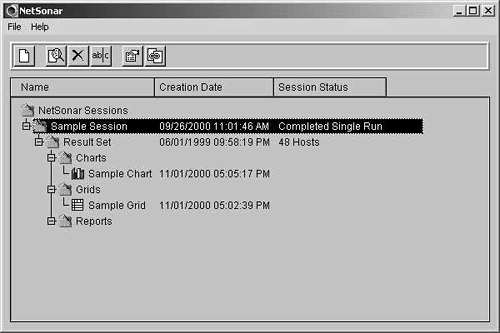
The session created is called Sample Session and can be seen along with the folders created by default: Charts, Grids, and Reports. Note that there is nothing listed under the Charts, Grids, or Reports folders. At this point, you have not created any objects that would normally be placed under these folders. You will now create a sample grid and chart, leaving the report to Step 4, “Reporting on the Collected Data,” later in this chapter.
To create a grid and view it in a grid browser, right-click the result set and select View Grid Data. You are then presented with the grid browser. To configure the grid browser, refer to the configuration settings described under the “Cisco Secure Scanner Features” section at the beginning of this chapter. Once you have completed configuring your grid, save it by selecting the Save button on the command bar. After entering the name of the grid, it appears as an object below the Grid folder on the main configuration screen.
To create a chart, you first have to configure a grid to display the information you require on the chart. When you highlight this data, the Chart Wizard icon becomes active. Clicking this button enables the chart wizard. To configure the chart, refer to the configuration settings described under the “Cisco Secure Scanner Features” section earlier in this chapter. Once you have completed configuring your chart, save it by selecting the Save button on the command bar. After entering the name of the chart, it appears as an object below the Chart folder on the main configuration screen.
After you have completed these steps, you will have a main application window that looks similar to that in Figure 7-18.
Figure 7-18. Scanner Application Window

You can see in Figure 7-18 that along with the result set, you now have Sample Grid and Sample Chart objects under the corresponding folders.
The next step is to create the report.
Step 4: Reporting on the Collected Data
You now have run a successful port scan and probe of the intended hosts. The next requirement is to produce a Brief Technical Report to explain the findings of the scan. You should include the Sample Grid and Sample Chart that you produced in the previous section. To create a new report, you have to right-click the result set and select Create a New Report. From the Report Selection screen, choose the Brief Technical Report option. The main difference between the Brief and Full Technical Reports is the Executive Summary and the explanatory text. Because this report is of a technical nature and the scan is to be run every week, there is no need for the explanatory text or Executive Summary.
Be sure to include in the report the Sample Chart and Sample Grid that you previously created.
Once the report is created, you will have a Report object under the Report folder. To open the report, simply double-click the report title that is located within the Report folder. The report is HTML-based, so it will open in the default installed Internet browser.
