Chapter 7
Firepower Licensing and Registration
At this point, you have the Firepower software running and the management interface configured. You are ready to begin the next steps: installing the licenses, enabling the Firepower features, and registering FTD with the FMC. The registration process takes place through an encrypted tunnel that is established between the management interfaces of the FMC and FTD. You cannot, however, register FTD with the FMC unless the FMC is licensed. This chapter shows you all the necessary steps for an initial deployment.
Licensing Essentials
The FMC accepts two types of licenses: Classic License and Smart License. To manage FTD, you must use a Smart License. A Classic License is used for earlier implementations of the Sourcefire technology, such as FirePOWER Services on ASA and legacy Sourcefire products. Because this book focuses on FTD, this section covers the Smart Licensing architecture.
The Smart Licensing Architecture
The Smart Licensing architecture offers two major benefits over the Classic License. It enables you to administer all your Firepower licenses from a single place and oversee their usage in real time. It also allows you to enable the full functionalities of the FMC and FTD without installing any licenses for the first 90 days of an initial deployment. This grace period allows you to complete any logistic or business processes related to your new Firepower deployment.
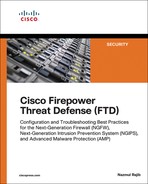
In the Smart Licensing architecture, the Firepower manager uses a process—Smart Agent—to communicate and register with the Cisco License Authority. After a successful registration, the License Authority issues an ID certificate. The Smart Agent process uses this certificate to communicate with the Cisco License Authority from time to time and track the status of entitlements.
Cisco offers two options to connect a Firepower manager to the Cisco License Authority. Depending on the security and connectivity policies of your organization, you can either choose to connect to the Cisco License Authority directly over the Internet or via a satellite server.
Cisco Smart Software Manager (CSSM)
After purchase, your Firepower Smart Licenses are assigned to an account that is created exclusively for your organization. You can manage any Smart Licenses your company owns by using the Cisco Smart Software Manager (CSSM)—a web-based application at cisco.com.
If you have administrative access to your account, the CSSM allows you to create additional virtual accounts within your company’s master account. Doing this helps you organize Firepower licenses based on departments or locations. When necessary, you can also transfer licenses and devices between the virtual accounts.
Tip
To get access to the CSSM, contact the Cisco channel partner, sales representative, or Global Licensing Operations (GLO) team.
Figure 7-1 shows that the Smart Agent process of an FMC connects to the Cisco License Authority through the Internet, and an administrator can manage the licenses through the Internet by connecting to the CSSM application.
CSSM Satellite
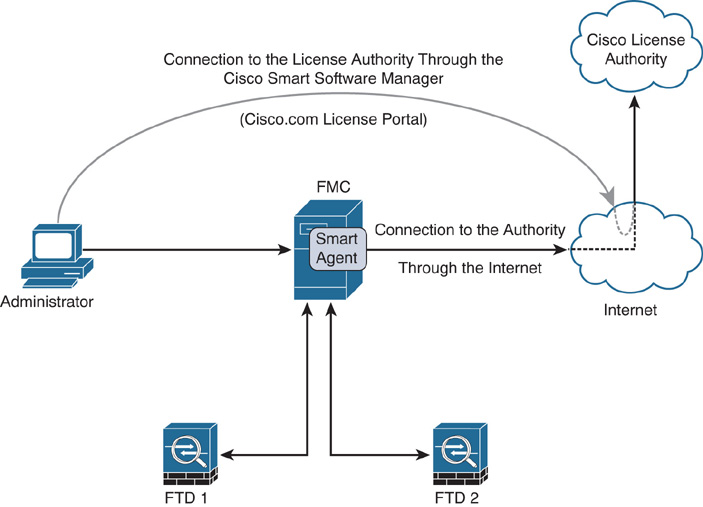
Because the Cisco License Authority is hosted at cisco.com, you need Internet connectivity from the FMC to obtain a Smart License. For security or other reasons, if you cannot connect the management interface of the FMC to the Internet, you can use the CSSM satellite—a virtual version of the CSSM deployed from an OVA image. In a CSSM satellite deployment, the FMC is connected to a CSSM satellite server, and the CSSM satellite server is registered to the Cisco License Authority through the Internet.
Note
The CSSM application or a satellite server is designed to integrate a wide range of Cisco products. Describing the configuration of the CSSM satellite is beyond the scope of this book. Cisco publishes various documents on Smart Licensing, which you can download free from cisco.com. Please read them to learn more.
Figure 7-2 illustrates the connection of an FMC with the Cisco License Authority through the CSSM satellite server and Internet.
Firepower Licenses
The Cisco Firepower technology, an evolution from the Sourcefire technology, offers various features to protect your network from malicious activities. Firepower, by default, comes with a base license. A base license, however, does not enable all the security features. To enable all the functionalities, separate feature licenses are necessary.
Tip
If you turn on the Evaluation Mode on the Firepower System, it enables all the security features on the FMC. You can apply these features on FTD for a 90-day period. Before the evaluation period expires, you must purchase a valid license and register the FMC with the Cisco License Authority for continuous operation.
Table 7-1 describes the functionalities of each Firepower license. Keep in mind that a Threat license is a prerequisite for a Malware license or a URL Filtering license.
Table 7-1 Capabilities of the Firepower Licenses
License |
It Allows You to… |
Base |
Update the Firepower system Control applications and users Perform switching, routing, and NAT |
Threat |
Detect and prevent intrusion attempts Blacklist traffic based on intelligence Block transfer of certain types of files |
Malware |
Protect the network from malware, enable AMP for the network, and enable AMP Threat Grid features |
URL Filtering |
Filter URLs based on reputation and category |
Table 7-2 describes the license subscription codes—T, TM, TMC, AMP, and URL—that you might notice during a purchase order. The Malware and URL Filtering licenses are available in two formats: as an add-on or in a bundle with a Threat license.
Table 7-2 Firepower License Subscription Purchase Options
License |
Expiration |
Which License to Purchase |
Base |
Permanent |
No separate purchase; included automatically during a device purchase. |
Threat |
Term-based |
T: Threat license only. |
Term-based |
TM: Threat and Malware licenses in a bundle. AMP: Malware license only; purchased if a Threat license is already available. |
|
URL Filtering |
Term-based |
TMC: Threat, Malware, and URL Filtering licenses in a bundle. URL: URL Filtering license only; purchased if a Threat license is already available. |
Best Practices for Licensing and Registration
When you register the FMC with FTD, there are a few things to consider:
![]() If you are in the middle of procuring a Firepower Smart License, you can avoid any delay by turning on the Evaluation Mode on the FMC. It enables all the security features on the FMC for 90 days and allows you to register FTD with the FMC immediately.
If you are in the middle of procuring a Firepower Smart License, you can avoid any delay by turning on the Evaluation Mode on the FMC. It enables all the security features on the FMC for 90 days and allows you to register FTD with the FMC immediately.
![]() If there is an intermediate device that translates the management IP addresses of your Firepower systems, use a unique NAT ID during the registration process.
If there is an intermediate device that translates the management IP addresses of your Firepower systems, use a unique NAT ID during the registration process.
![]() Before you begin the registration process, make sure the network settings on Firepower appliances are correct. FMC and FTD should be able to communicate with each other using IP addresses. If you choose to perform a registration using host names or domain names, verify the name resolution before you attempt to register. You can run a simple ping test between the FMC and FTD by using their fully qualified domain names (FQDNs). If the ping test fails due to name resolution failure, check to ensure that the Firepower appliances are configured with an appropriate DNS server and also make sure the DNS server is responding to the queries.
Before you begin the registration process, make sure the network settings on Firepower appliances are correct. FMC and FTD should be able to communicate with each other using IP addresses. If you choose to perform a registration using host names or domain names, verify the name resolution before you attempt to register. You can run a simple ping test between the FMC and FTD by using their fully qualified domain names (FQDNs). If the ping test fails due to name resolution failure, check to ensure that the Firepower appliances are configured with an appropriate DNS server and also make sure the DNS server is responding to the queries.
Licensing a Firepower System
Enabling a feature on Firepower is not a straightforward process. First, you need to purchase the necessary subscriptions. Then, you need to obtain the Smart Licenses by registering the FMC with the Smart Licensing Server. Finally, you have to enable a feature by applying the licenses to FTD from the web interface of the FMC.
Figure 7-3 summarizes the steps to obtain and apply a Smart License on the Firepower System.

Licensing Configuration
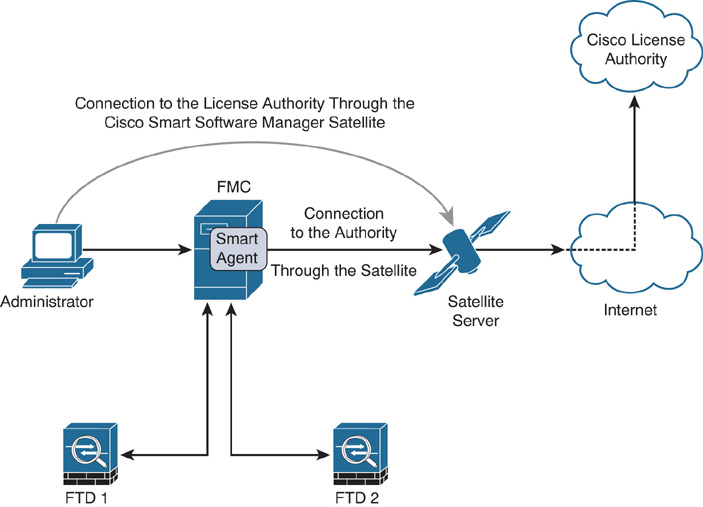
You cannot register FTD with the FMC until you register the FMC with a Smart Licensing Server or enable the evaluation mode.
Figure 7-4 shows a notification in the Add Device window. This message appears when you attempt to register an FTD without registering the FMC with a Smart Licensing Server or without enabling Evaluation Mode.
If you are in the middle of procuring a Firepower Smart License, you can avoid any delay by turning on the Evaluation Mode on the FMC. It enables all the security features on the FMC for 90 days and allows you to register FTD with the FMC immediately. The following section describes how to enable Evaluation Mode on the FMC.
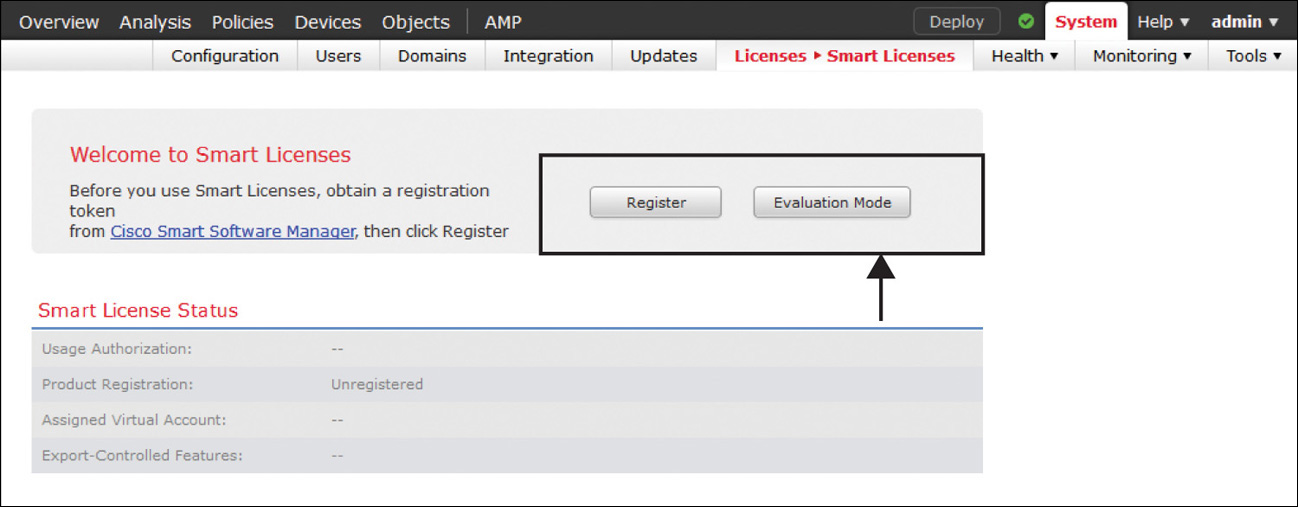
Step 1. Go to the System > Licenses > Smart Licenses page. Figure 7-5 shows the Evaluation Mode button that appears on the Smart Licenses page.
Note
The Evaluation Mode button does not appear after the 90-day period expires; however, you can retrieve the button by reimaging the FMC.
Step 2. Click the Evaluation Mode button. A confirmation message appears, reminding you that Evaluation Mode is a one-time option and available for a 90-day period (see Figure 7-6).
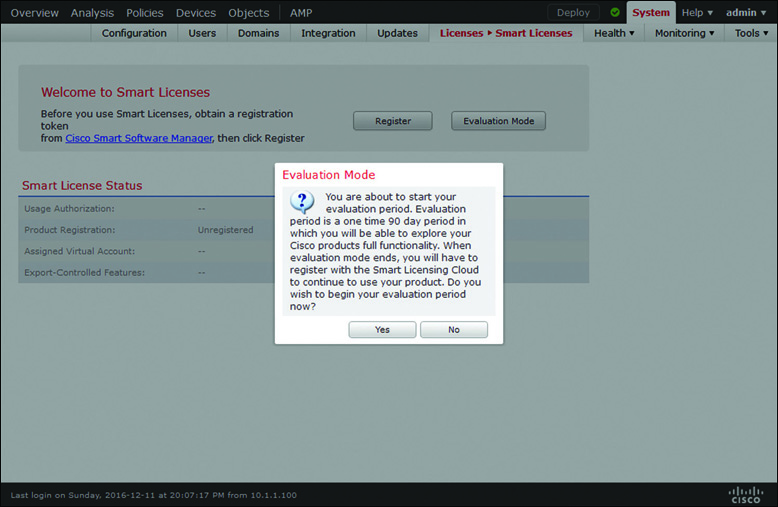
Step 3. Click Yes to begin the 90-day period.
Step 1. Log in to the cisco.com support portal and navigate to the CSSM.
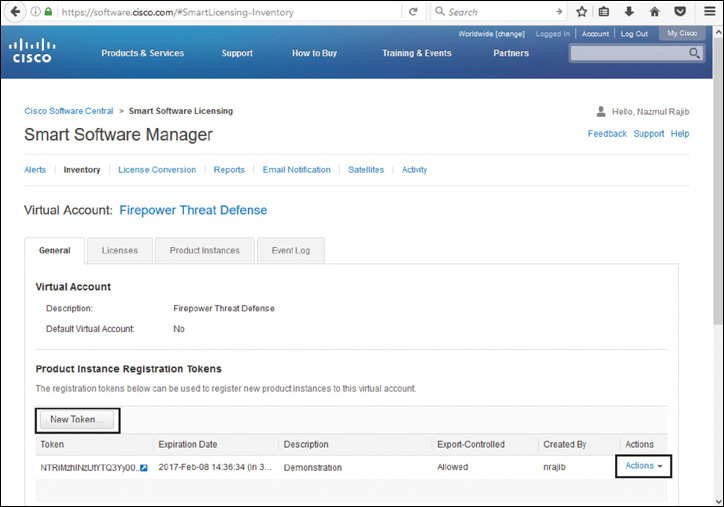
Step 2. Access the virtual account created for your organization and click New Token to generate a new token (see Figure 7-7). A long string is randomly generated, and you can copy it by selecting the Actions option.
Step 3. Copy the token from the CSSM and paste it in the Smart Licensing Product Registration form on the FMC (see Figure 7-8). To access the form, click the Register button on the Smart Licenses page.

Step 4. Click the Apply Changes button to begin the registration process with the Cisco License Authority. A confirmation message appears when registration is successful. Figure 7-9 confirms that the FMC is successfully registered with the Cisco License Authority. The Smart License Status shows healthy states (green checkmarks) and the name of the virtual account of your organization.

You can apply your desired license on an FTD device during the registration process. Later, you can click the Edit License button on the Smart Licenses page to manage the associations of licenses with any managed devices.
Verifying a Smart License Issue
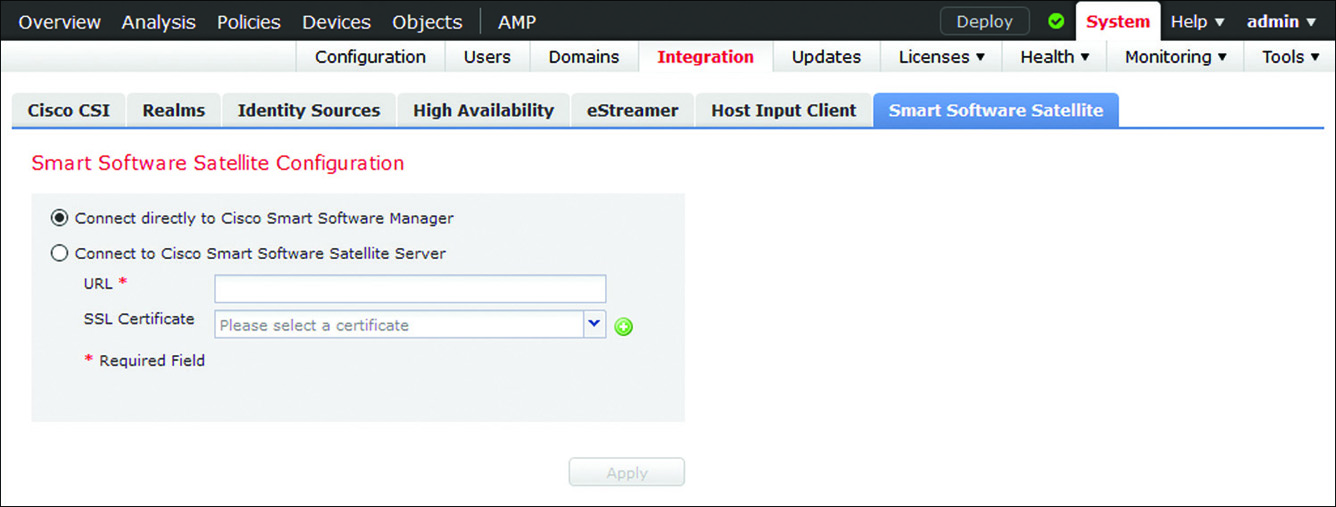
If the FMC is unable to communicate with the Smart Licensing Server, make sure the FMC is configured to connect directly to the CSSM. You can confirm the setting from the System > Integration > Smart Software Satellite page.
Figure 7-10 shows two options to connect the FMC. By default, Connect Directly to Cisco Smart Software Manager is selected.
The web interface of an FMC displays notifications when it successfully registers, or fails to register, with a License Server. To investigate any communication error, you can debug any related processes from the FMC CLI. Example 7-1 shows that the FMC can successfully connect and register with the Cisco License Authority.
Example 7-1 Syslog Messages That Confirm a Successful Connection Between the FMC and a License Server
admin@FMC:~$ sudo tail –f /var/log/sam.log
Password:
[timestamp] PID : 12133 Process : ActionQueueScrape.pl [SAM-DBG-LOG]:
registerIdToken start: token(NGJmZThZjItZjVkNZC00TcyLWI5MTAAtNGRhMzExZDM5MzVmLTE0O
DY1NjMZz%0AOD1MMDN8RmZweWJ5eG9Z0c…)
[timestamp] PID : 12133 Process : ActionQueueScrape.pl [SAM-DBG-LOG]: [socket conn]
compose msg header: type[7], len[147], seq[1]
[timestamp] PID : 12133 Process : ActionQueueScrape.pl [SAM-DBG-LOG]: [socket conn]
establishConnection start
[timestamp] PID : 12133 Process : ActionQueueScrape.pl [SAM-DBG-LOG]: [socket conn]
Connected to server
[timestamp] PID : 12133 Process : ActionQueueScrape.pl [SAM-DBG-LOG]: [socket conn]
'/var/sf/run/smart_agent.sock' Exiting the loop
[timestamp] PID : 12133 Process : ActionQueueScrape.pl [SAM-DBG-LOG]: [socket conn]
Connection successful!
[timestamp] PID : 12133 Process : ActionQueueScrape.pl [SAM-DBG-LOG]: [socket conn]
initSequence: 3
[timestamp] PID : 12133 Process : ActionQueueScrape.pl [SAM-DBG-LOG]: [socket conn]
establishConnection done
[timestamp] PID : 12133 Process : ActionQueueScrape.pl [SAM-DBG-LOG]: [socket conn]
sendMsg: successfully sent the msg!
[timestamp] PID : 12133 Process : ActionQueueScrape.pl [SAM-DBG-LOG]: [socket conn]
recvMsg get: type[1007], len[141], seq[0], msg[error:0 authorization:AUTHORIZED,
1483970615 registration:REGISTERED,1483970610 virtual_acct:Firepower Threat
Defense export_control:1]
Example 7-2 demonstrates a scenario where the FMC can connect to the Smart Licensing Server successfully but fails to register with the server due to a token being invalid.
Example 7-2 Debugging a Registration Failure Between the FMC and a License Server
[timestamp] PID : 463 Process : mojo_server.pl [SAM-DBG-LOG]: [socket conn] Closing
Connection
[timestamp] PID : 13540 Process : ActionQueueScrape.pl [SAM-DBG-LOG]:
registerIdToken start: token(NGJmZThhZjItZjVkZCooyTcyLWI5MTAtNGRhMzExZDM5MzVmLTE0O
DY1NjMz%0AODk1MDN8RmZweWJ5eG9ZY)
[timestamp] PID : 13540 Process : ActionQueueScrape.pl [SAM-DBG-LOG]: [socket conn]
compose msg header: type[7], len[147], seq[1]
[timestamp] PID : 13540 Process : ActionQueueScrape.pl [SAM-DBG-LOG]: [socket conn]
establishConnection start
[timestamp] PID : 13540 Process : ActionQueueScrape.pl [SAM-DBG-LOG]: [socket conn]
Connected to server
[timestamp] PID : 13540 Process : ActionQueueScrape.pl [SAM-DBG-LOG]: [socket conn]
'/var/sf/run/smart_agent.sock' Exiting the loop
[timestamp] PID : 13540 Process : ActionQueueScrape.pl [SAM-DBG-LOG]: [socket conn]
Connection successful!
[timestamp] PID : 13540 Process : ActionQueueScrape.pl [SAM-DBG-LOG]: [socket conn]
initSequence: 9
[timestamp] PID : 13540 Process : ActionQueueScrape.pl [SAM-DBG-LOG]: [socket conn]
establishConnection done
[timestamp] PID : 13540 Process : ActionQueueScrape.pl [SAM-DBG-LOG]: [socket conn]
sendMsg: successfully sent the msg!
[timestamp] PID : 13540 Process : ActionQueueScrape.pl [SAM-DBG-LOG]: [socket conn]
recvMsg get: type[1003], len [203], seq[0], msg[Response error: {"token":
["The token 'NGJmZThhZjItZjVkZCooyTcyLWI5MTAtNGRhMzExZDM5MzVmLTE0ODY1NjMz%0AODk
1MDN8RmZweWJ5eG9ZY is not valid."]}]
[timestamp] PID : 13540 Process : ActionQueueScrape.pl [SAM-DBG-LOG]: [socket conn]
Closing Connection
[timestamp] PID : 13540 Process : ActionQueueScrape.pl [SAM-DBG-LOG]:
registerIdToken return: $VAR1 = {
'error' => 17
};
Registering a Firepower System
Registration of a Firepower System is a two-step process. You must begin the registration process from FTD. At first, you enter the FMC information in FTD, and then you provide the FTD information on the FMC.
Registration Configuration
To register FTD with the FMC, you need to have access to the FTD CLI and also to the web interface of the FMC. This section describes the entire process of completing a registration.
Setting Up FTD
After you install FTD software successfully, you should be able to connect to the FTD CLI through Secure Shell (SSH) or a console terminal. When you can successfully access the FTD software, you see the default CLI prompt, >.
Example 7-3 confirms that a fresh installation of FTD has no connection with a management appliance.
Example 7-3 Output of the show managers Command
> show managers
No managers configured.
>
To add the FMC to FTD, run the configure manager add command along with the management IP address of the FMC. You also have to provide a one-time registration key that is used only during the registration process. A unique NAT ID is necessary only if there is an intermediate networking device that translates the IP addresses of the Firepower System. The command syntax is as follows:
> configure manager add IP_Address_of_FMC Registration_Key NAT_ID
Example 7-4 demonstrates a successful addition of the FMC with management IP address 10.1.1.16. The configuration uses RegKey as the one-time temporary registration key and NatId as a NAT ID. The use of a NAT ID is optional when the management IP addresses are not translated by any intermediate devices.
Example 7-4 Adding the FMC to FTD
> configure manager add 10.1.1.16 RegKey NatId
Manager successfully configured.
Please make note of reg_key as this will be required while adding Device in FMC.
>
The configuration on your FTD is complete. The next step is to add FTD on the FMC. Before you go to the next step, you can optionally check the current status of the registration. Example 7-5 shows the pending registration status after you add the FMC to FTD. The registration status changes to completed after you perform the next step successfully.
Example 7-5 Pending Status After Adding the FMC to FTD
> show managers
Host : 10.1.1.16
Registration Key : ****
Registration : pending
RPC Status :
>
Setting Up the FMC
The second step of the registration process is to enter the details of FTD on the web interface of the FMC. When you add FTD, you must use the same registration key (and the same NAT ID, if used) that you configured on the FTD previously. Here are the steps you have to follow:
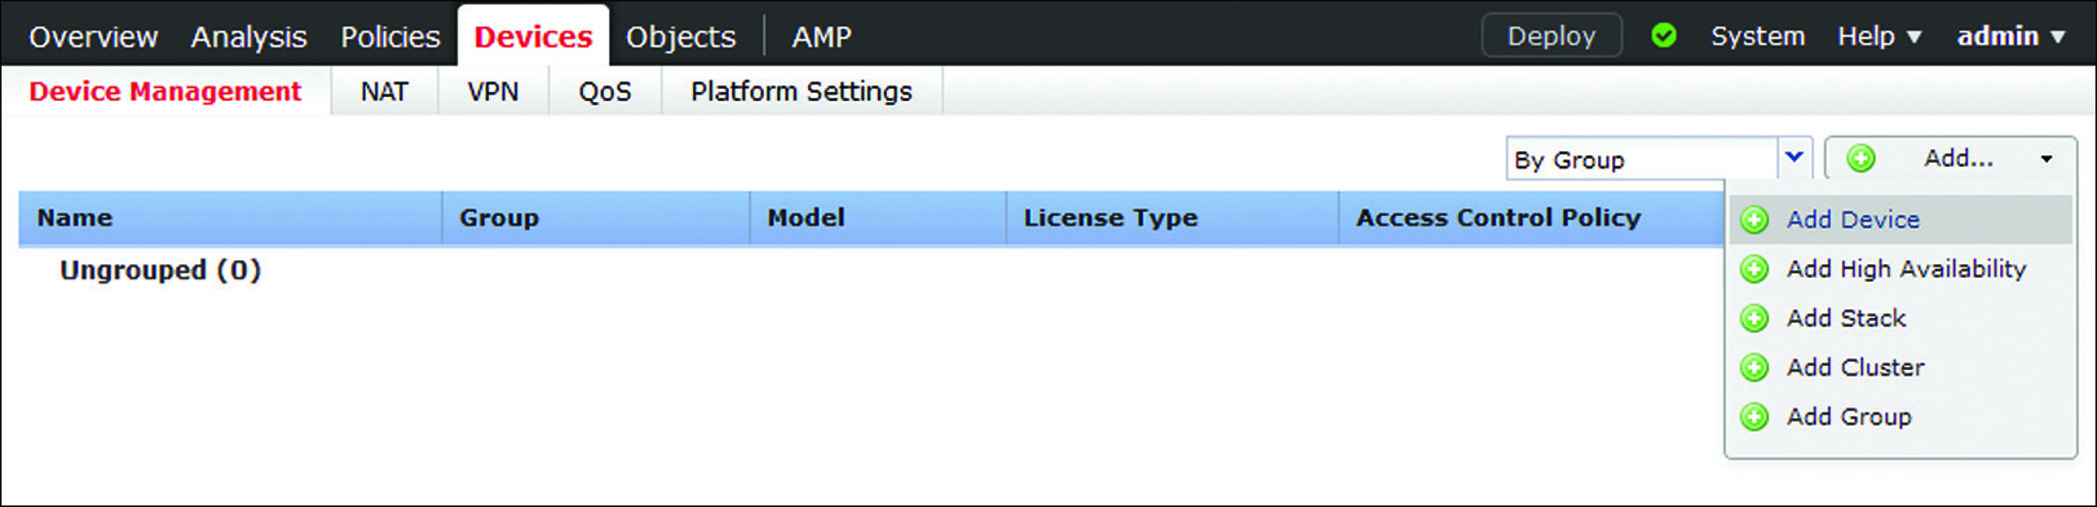
Step 1. Log in to the web interface of the FMC and go to Devices > Device Management > Add Device (see Figure 7-11). The Add Device window appears. You must add the FMC on FTD before you attempt to add the FTD details on this window.
Step 2. In the Host field, enter the IP address of the FTD management interface.
Step 3. In the Display Name field, provide a name that will be displayed on the FMC web interface to indicate this FTD.
Step 4. In the Registration Key field, enter RegKey—the same key you used when you added the FMC on FTD earlier.
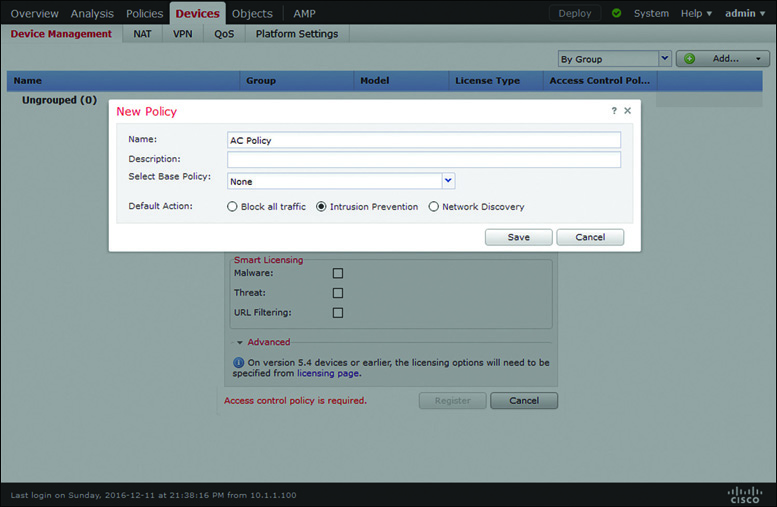
Step 5. Use the Access Control Policy dropdown to select an access control policy that you want to initially apply to FTD. If this is a new deployment, the FMC may not have any preconfigured access control policy. You can, however, create a policy on the fly by choosing the Create New Policy option from the Access Control Policy dropdown. The New Policy window appears (see Figure 7-12).
The registration process can fail if you select an access control policy that was created for a different device model or configured with a component that is unsupported in FTD. Therefore, if you are not sure about the configuration of an old access control policy, you should create a new policy on the fly and select it to ensure that the registration will not fail due to an incompatible access control policy.
Figure 7-12 shows the creation of a new access control policy called AC Policy. This figure shows a very basic configuration that is good for a successful registration. You can edit and enhance this policy later. For now, click Save.
Step 6. In the Smart Licensing section of the Add Device dialog, select the features that you want to apply, such as Malware, Threat, and URL Filtering.
Step 7. In the Advanced section of the Add Device dialog, provide a unique NAT ID if there is an intermediate device that translates the management IP addresses of your Firepower systems. This is an optional step if there is no NAT device between the FMC and FTD. Figure 7-13 shows that the Add Device window is populated with the details of the FTD. Note that the same registration key (RegKey) and NAT ID (NatId) are used on the FMC and FTD.

Step 8. Ensure that the Transfer Packets option is selected to allow FTD to send the associated packets to the FMC when any security events are generated.
Step 9. Click the Register button. The registration process begins, through an encrypted tunnel. Figure 7-14 demonstrates the in-progress registration process on the web interface.
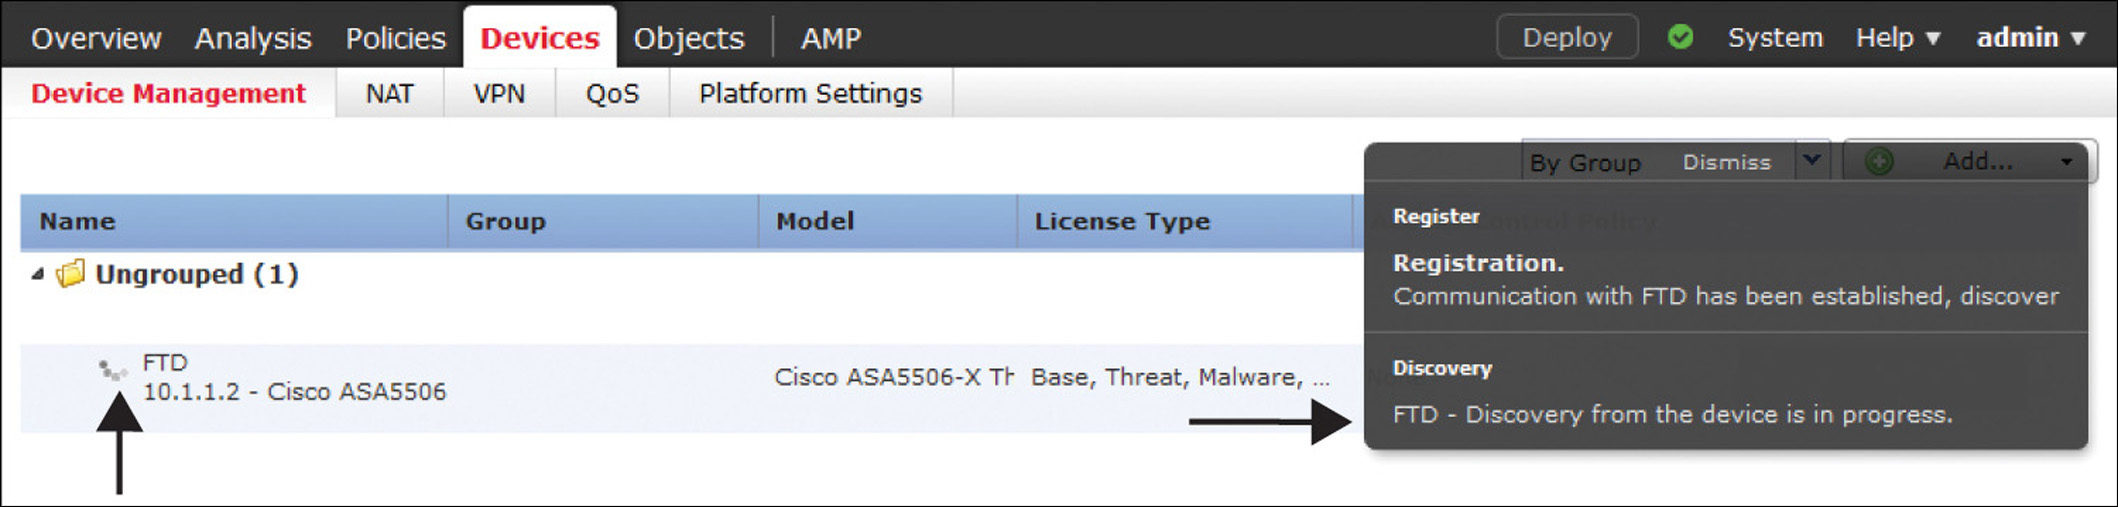
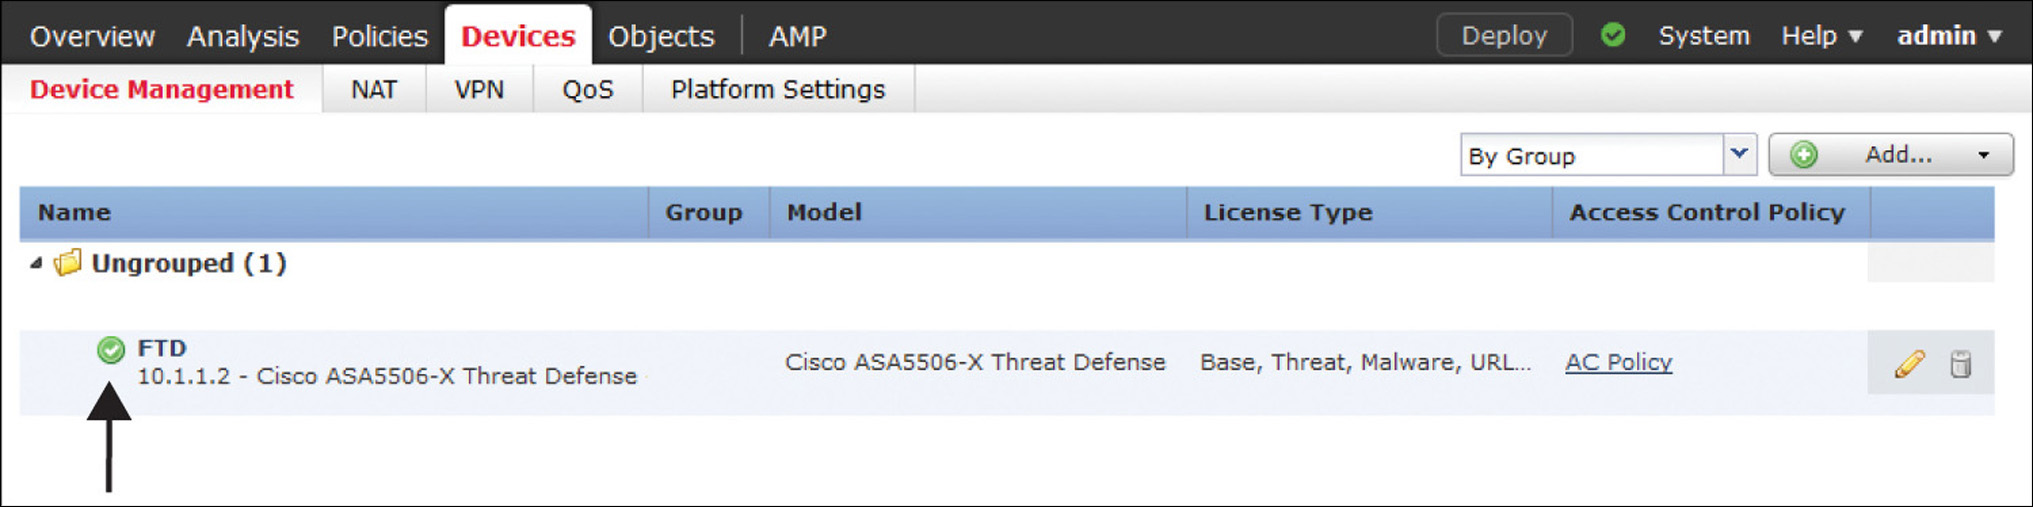
Figure 7-15 shows the confirmation you get after a successful registration. The FTD device model, software version, and applied feature licenses are displayed after a successful registration.
Verifying the Registration and Connection
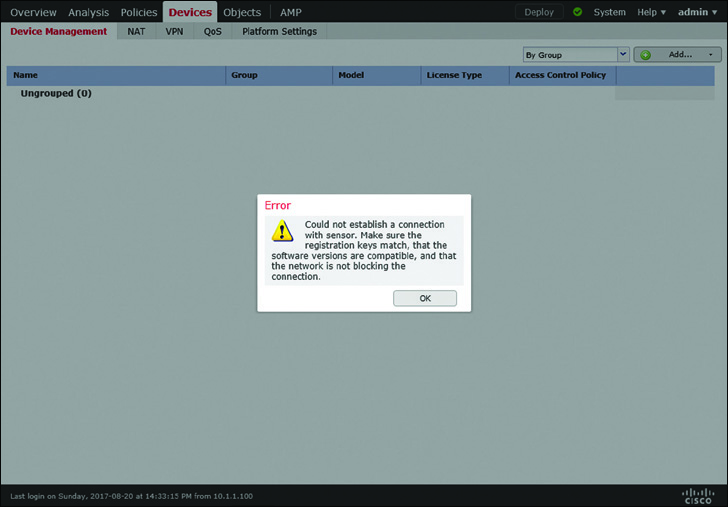
If the registration process between FTD and the FMC is unsuccessful, the FMC displays an error message for it. In addition, you can run various commands to verify the communication status between FTD and the FMC.
Figure 7-16 shows an error message that can appear when a registration attempt fails due to a communication issue, an incompatible software version, or a mismatched registration key.
Example 7-6 shows two different registration statuses—pending and completed—that appear in the FTD CLI. The pending status appears after you add the FMC in the FTD CLI. The registration status changes to completed after you add FTD on the FMC web interface.
Example 7-6 Displaying the Registration Status from the FTD CLI
! Registration status: After you complete the first step (Add an FMC on FTD CLI)
> show managers
Host : 10.1.1.16
Registration Key : ****
Registration : pending
RPC Status :
>
! Registration status: After you complete the second and final step (Add an FTD on
FMC GUI)
> show managers
Type : Manager
Host : 10.1.1.16
Registration : Completed
>
As soon as you enter the FMC information in FTD, the FTD TCP port 8305 starts listening for incoming connections; it expects packets from the FMC. Similarly, as soon as you enter the FTD information on the FMC, the FMC begins listening on TCP port 8305.
Example 7-7 shows the transition of TCP port 8305 on FTD and the FMC during the registration process.
Example 7-7 Verifying the Management Port Status
! First, on the CLI of an FTD, when you enter the FMC detail, it opens the TCP port
8305 on FTD.
admin@FTD:~$ sudo netstat -antp | grep -i 8305
tcp 0 0 10.1.1.2:8305 0.0.0.0:* LISTEN
933/sftunnel
admin@FTD:~$
! Then, on the GUI of an FMC, when you enter the FTD detail, the FMC begins
listening on TCP port 8305. FMC responses the FTD's registration request from a
random port 49707.
admin@FMC:~$ sudo netstat -antp | grep -i 8305
tcp 0 0 10.1.1.16:8305 0.0.0.0:* LISTEN
10095/sftunnel
tcp 0 0 10.1.1.16:49707 10.1.1.2:8305 ESTABLISHED
10095/sftunnel
root@FMC:~#
! Upon a successful registration, the connections appear fully established on the
FMC.
admin@FMC:~$ sudo netstat -antp | grep -i 8305
tcp 0 0 10.1.1.16:49707 10.1.1.2:8305 ESTABLISHED
10095/sftunnel
tcp 0 0 10.1.1.16:8305 10.1.1.2:54998 ESTABLISHED
10095/sftunnel
admin@FMC:~$
If the port status does not change from the listening state to the established state, the FMC may not have received any registration requests from FTD, or FTD may have not received any acknowledgements from the FMC. Let’s take a look at what happens at the packet level during the registration process.
The following two examples use the built-in packet capture tools in FTD and the FMC to display the transactions of packets. Capturing packets in a product system can impact system performance. Therefore, if necessary, you should run this tool only during a maintenance window or in a lab environment.
Example 7-8 shows the exchange of packets right after you begin the registration process, which is after adding the FMC in the FTD CLI. Because at this stage you have not yet entered the details of FTD on the FMC, the FMC (IP address 10.1.1.6) keeps sending the RESET packets in response to the SYN packets from the FTD (IP address 10.1.1.2).
Example 7-8 Packet Transaction After Adding an FMC on the FTD CLI
! Capturing Packets on the FTD Management Interface
> capture-traffic
Please choose domain to capture traffic from:
0 - br1
Selection? 0
Please specify tcpdump options desired.
(or enter '?' for a list of supported options)
Options: host 10.1.1.16
HS_PACKET_BUFFER_SIZE is set to 4.
tcpdump: verbose output suppressed, use -v or -vv for full protocol decode
listening on br1, link-type EN10MB (Ethernet), capture size 96 bytes
[timestamp] IP FTD.46373 > 10.1.1.16.8305: Flags [S], seq 1709676008, win 14600,
options [mss 1460,sackOK,TS val 87180 ecr 0,nop,wscale 7], length 0
[timestamp] IP 10.1.1.16.8305 > FTD.46373: Flags [R.], seq 0, ack 1709676009, win 0,
length 0
[timestamp] IP FTD.58441 > 10.1.1.16.8305: Flags [S], seq 3021847438, win 14600,
options [mss 1460,sackOK,TS val 87380 ecr 0,nop,wscale 7], length 0
[timestamp] IP 10.1.1.16.8305 > FTD.58441: Flags [R.], seq 0, ack 3021847439, win 0,
length 0
[timestamp] IP FTD.46814 > 10.1.1.16.8305: Flags [S], seq 1334198689, win 14600,
options [mss 1460,sackOK,TS val 88317 ecr 0,nop,wscale 7], length 0
[timestamp] IP 10.1.1.16.8305 > FTD.46814: Flags [R.], seq 0, ack 1334198690, win 0,
length 0
[timestamp] IP FTD.45854 > 10.1.1.16.8305: Flags [S], seq 1274367969, win 14600,
options [mss 1460,sackOK,TS val 88517 ecr 0,nop,wscale 7], length 0
[timestamp] IP 10.1.1.16.8305 > FTD.45854: Flags [R.], seq 0, ack 1274367970, win 0,
length 0
.
.
<Output Omitted>
! Capturing Packets on the FMC Management Interface
admin@FMC:~$ sudo tcpdump -i eth0 host 10.1.1.2
Password:
HS_PACKET_BUFFER_SIZE is set to 4.
tcpdump: verbose output suppressed, use -v or -vv for full protocol decode
listening on eth0, link-type EN10MB (Ethernet), capture size 96 bytes
[timestamp] IP 10.1.1.2.46373 > FMC.8305: Flags [S], seq 1709676008, win 14600,
options [mss 1460,sackOK,TS val 87180 ecr 0,nop,wscale 7], length 0
[timestamp] IP FMC.8305 > 10.1.1.2.46373: Flags [R.], seq 0, ack 1709676009, win 0,
length 0
[timestamp] IP 10.1.1.2.58441 > FMC.8305: Flags [S], seq 3021847438, win 14600,
options [mss 1460,sackOK,TS val 87380 ecr 0,nop,wscale 7], length 0
[timestamp] IP FMC.8305 > 10.1.1.2.58441: Flags [R.], seq 0, ack 3021847439, win 0,
length 0
[timestamp] IP 10.1.1.2.46814 > FMC.8305: Flags [S], seq 1334198689, win 14600,
options [mss 1460,sackOK,TS val 88317 ecr 0,nop,wscale 7], length 0
[timestamp] IP FMC.8305 > 10.1.1.2.46814: Flags [R.], seq 0, ack 1334198690, win 0,
length 0
[timestamp] IP 10.1.1.2.45854 > FMC.8305: Flags [S], seq 1274367969, win 14600,
options [mss 1460,sackOK,TS val 88517 ecr 0,nop,wscale 7], length 0
[timestamp] IP FMC.8305 > 10.1.1.2.45854: Flags [R.], seq 0, ack 1274367970, win 0,
length 0
.
.
<Output Omitted>
Example 7-9 shows the next phase of the registration process. As soon as you enter the FTD details on the web interface of the FMC, the FMC stops sending RESET packets.
Example 7-9 Packet Transaction After Adding the FTD on the FMC GUI
! On the FMC Interface
.
<Output Omitted>
.
[timestamp] IP FMC.51509 > 10.1.1.2.8305: Flags [S], seq 1804119299, win 14600,
options [mss 1460,sackOK,TS val 258976 ecr 0,nop,wscale 7], length 0
[timestamp] IP 10.1.1.2.8305 > FMC.51509: Flags [S.], seq 4103916511, ack
1804119300, win 14480, options [mss 1460,sackOK,TS val 93418 ecr 258976,nop,
wscale 7], length 0
[timestamp] IP FMC.51509 > 10.1.1.2.8305: Flags [.], ack 1, win 115, options
[nop,nop,TS val 258976 ecr 93418], length 0
[timestamp] IP FMC.51509 > 10.1.1.2.8305: Flags [P.], ack 1, win 115, options
[nop,nop,TS val 258985 ecr 93418], length 247
[timestamp] IP 10.1.1.2.8305 > FMC.51509: Flags [.], ack 248, win 122, options
[nop,nop,TS val 93422 ecr 258985], length 0
[timestamp] IP 10.1.1.2.8305 > FMC.51509: Flags [.], ack 248, win 122, options
[nop,nop,TS val 93423 ecr 258985], length 1448
[timestamp] IP 10.1.1.2.8305 > FMC.51509: Flags [P.], ack 248, win 122, options
[nop,nop,TS val 93423 ecr 258985], length 774
.
<Output Omitted>
.
! Press the Control+C keys to exit and stop capturing.
! On the FTD Interface
.
<Output Omitted>
.
[timestamp] IP 10.1.1.16.51509 > FTD.8305: Flags [S], seq 1804119299, win 14600,
options [mss 1460,sackOK,TS val 258976 ecr 0,nop,wscale 7], length 0
[timestamp] IP FTD.8305 > 10.1.1.16.51509: Flags [S.], seq 4103916511, ack
1804119300, win 14480, options [mss 1460,sackOK,TS val 93418 ecr 258976,nop,
wscale 7], length 0
[timestamp] IP 10.1.1.16.51509 > FTD.8305: Flags [.], ack 1, win 115, options
[nop,nop,TS val 258976 ecr 93418], length 0
[timestamp] IP 10.1.1.16.51509 > FTD.8305: Flags [P.], ack 1, win 115, options
[nop,nop,TS val 258985 ecr 93418], length 247
[timestamp] IP FTD.8305 > 10.1.1.16.51509: Flags [.], ack 248, win 122, options
[nop,nop,TS val 93422 ecr 258985], length 0
[timestamp] IP FTD.8305 > 10.1.1.16.51509: Flags [.], ack 248, win 122, options
[nop,nop,TS val 93423 ecr 258985], length 1448
[timestamp] IP FTD.8305 > 10.1.1.16.51509: Flags [P.], ack 248, win 122, options
[nop,nop,TS val 93423 ecr 258985], length 774
.
<Output Omitted>
.
! Press the Control+C keys to exit and stop capturing.
If you do not notice any activity on the management interfaces, check whether the TCP port 8305 is bidirectionally allowed on any intermediate network devices between the FMC and FTD. You can test this by connecting to the TCP port 8305 of FTD from the FMC directly.
Example 7-10 shows a successful telnet connection from the FMC to FTD port 8305. It confirms that FTD port 8305 (IP address 10.1.1.2) is allowed by any intermediate router or firewall.
Example 7-10 Successful Telnet Connection from the FMC to FTD Port 8305
admin@FMC:~$ telnet 10.1.1.2 8305
Trying 10.1.1.2...
Connected to 10.1.1.2.
Escape character is '^]'.
^] ! Press the Ctrl and ] keys together
telnet> quit
Connection closed.
admin@fmc:~$
Analyzing the Encrypted SFTunnel
The FMC and FTD complete their registration process through the SFTunnel—an encrypted communication channel between the management interfaces of the FMC and FTD. Using TCP port 8305, FTD and the FMC establish this channel to complete any administrative tasks between them, such as registering FTD with the FMC, exchanging keepalive heartbeats, receiving new security policies and configurations from the FMC, sending security events to the FMC, synchronizing time with the FMC, and so on.
The netstat or tcpdump command that you ran earlier confirms the establishment of a tunnel between the FMC and FTD. However, it does not display what happens inside an encrypted tunnel at the application level. The Firepower System provides a command-line tool, sftunnel-status, that shows the status of each of the services running through an encrypted secure tunnel.
Example 7-11 shows output of the sftunnel-status command on FTD. From the output, you can conclude that the logical management interface of FTD (name br1, IP address 10.1.1.2) is connected to the management interface of the FMC (name eth0, IP address 10.1.1.16). Two channels, A and B, are connected for control packets and event traffic, respectively. The tunnel is encrypted using the AES256-GCM-SHA384 cipher.
Example 7-11 Output of the sftunnel-status Command in FTD
> sftunnel-status
SFTUNNEL Start Time: Sun Dec 11 23:51:56 2016
Both IPv4 and IPv6 connectivity is supported
Broadcast count = 2
Reserved SSL connections: 0
Management Interfaces: 1
br1 (control events) 10.1.1.2,
***********************
**RUN STATUS****10.1.1.16*************
Cipher used = AES256-GCM-SHA384 (strength:256 bits)
ChannelA Connected: Yes, Interface br1
Cipher used = AES256-GCM-SHA384 (strength:256 bits)
ChannelB Connected: Yes, Interface br1
Registration: Completed.
IPv4 Connection to peer '10.1.1.16' Start Time: Mon Dec 12 00:13:44 2016
PEER INFO:
sw_version 6.1.0
sw_build 330
Management Interfaces: 1
eth0 (control events) 10.1.1.16,
Peer channel Channel-A is valid type (CONTROL), using 'br1', connected
to '10.1.1.16' via '10.1.1.2'
Peer channel Channel-B is valid type (EVENT), using 'br1', connected to
'10.1.1.16' via '10.1.1.2'
TOTAL TRANSMITTED MESSAGES <24> for Health Events service
RECEIVED MESSAGES <12> for Health Events service
SEND MESSAGES <12> for Health Events service
HALT REQUEST SEND COUNTER <0> for Health Events service
STORED MESSAGES for Health service (service 0/peer 0)
STATE <Process messages> for Health Events service
REQUESTED FOR REMOTE <Process messages> for Health Events service
REQUESTED FROM REMOTE <Process messages> for Health Events service
TOTAL TRANSMITTED MESSAGES <3> for Identity service
RECEIVED MESSAGES <2> for Identity service
SEND MESSAGES <1> for Identity service
HALT REQUEST SEND COUNTER <0> for Identity service
STORED MESSAGES for Identity service (service 0/peer 0)
STATE <Process messages> for Identity service
REQUESTED FOR REMOTE <Process messages> for Identity service
REQUESTED FROM REMOTE <Process messages> for Identity service
TOTAL TRANSMITTED MESSAGES <76> for RPC service
RECEIVED MESSAGES <38> for RPC service
SEND MESSAGES <38> for RPC service
HALT REQUEST SEND COUNTER <0> for RPC service
STORED MESSAGES for RPC service (service 0/peer 0)
STATE <Process messages> for RPC service
REQUESTED FOR REMOTE <Process messages> for RPC service
REQUESTED FROM REMOTE <Process messages> for RPC service
TOTAL TRANSMITTED MESSAGES <41> for IP(NTP) service
RECEIVED MESSAGES <27> for IP(NTP) service
SEND MESSAGES <14> for IP(NTP) service
HALT REQUEST SEND COUNTER <0> for IP(NTP) service
STORED MESSAGES for IP(NTP) service (service 0/peer 0)
STATE <Process messages> for IP(NTP) service
REQUESTED FOR REMOTE <Process messages> for IP(NTP) service
REQUESTED FROM REMOTE <Process messages> for IP(NTP) service
TOTAL TRANSMITTED MESSAGES <5> for IDS Events service
RECEIVED MESSAGES <0> for service IDS Events service
SEND MESSAGES <5> for IDS Events service
HALT REQUEST SEND COUNTER <0> for IDS Events service
STORED MESSAGES for IDS Events service (service 0/peer 0)
STATE <Process messages> for IDS Events service
REQUESTED FOR REMOTE <Process messages> for IDS Events service
REQUESTED FROM REMOTE <Process messages> for IDS Events service
.
.
<Output omitted for brevity>
.
.
Heartbeat Send Time: Mon Dec 12 00:28:17 2016
Heartbeat Received Time: Mon Dec 12 00:29:35 2016
***********************
**RPC STATUS****10.1.1.16*************
'ip' => '10.1.1.16',
'uuid' => '7d3aa42c-95c7-11e6-a825-2c6c588f5f38',
'ipv6' => 'IPv6 is not configured for management',
'name' => '10.1.1.16',
'active' => '1',
'uuid_gw' => '',
'last_changed' => 'Wed Oct 19 17:56:43 2016'
Check routes:
>
You can view similar statistics on an FMC by running the sftunnel_status.pl tool. By comparing the data on both devices, FMC and FTD, you can determine any potential issues with the SFTunnel. This is the command syntax on the FMC:
admin@FMC:~$ sudo sftunnel_status.pl <Management_IP_Address_of_the_FTD>
Example 7-12 shows output of the sftunnel_status.pl tool in the FMC. It confirms that the FMC (IP address 10.1.1.16) is registered with FTD (IP address 10.1.1.2) and is communicating actively.
Example 7-12 Output of the sftunnel_status.pl Tool in the FMC
admin@FMC:~$ sudo sftunnel_status.pl 10.1.1.2
Password:
Check peer 10.1.1.2 at /usr/local/sf/bin/sftunnel_status.pl line 19
SFTUNNEL Start Time: Mon Dec 12 01:17:21 2016
Key File = /etc/sf/keys/sftunnel-key.pem
Cert File = /etc/sf/keys/sftunnel-cert.pem
CA Cert = /etc/sf/ca_root/cacert.pem
FIPS,STIG,CC = 0,0,0
Both IPv4 and IPv6 connectivity is supported
Broadcast count = 1
Reserved SSL connections: 0
Management Interfaces: 1
eth0 (control events) 10.1.1.16,
***********************
**RUN STATUS****10.1.1.2*************
Cipher used = AES256-GCM-SHA384 (strength:256 bits)
ChannelA Connected: Yes, Interface eth0
Cipher used = AES256-GCM-SHA384 (strength:256 bits)
ChannelB Connected: Yes, Interface eth0
Registration: Completed.
IPv4 Connection to peer '10.1.1.2' Start Time: Mon Dec 12 02:58:54 2016
PEER INFO:
sw_version 6.1.0
sw_build 330
Management Interfaces: 1
br1 (control events) 10.1.1.2,
Peer channel Channel-A is valid type (CONTROL), using 'eth0', connected to '10.1.1.2' via '10.1.1.16'
Peer channel Channel-B is valid type (EVENT), using 'eth0', connected to '10.1.1.2' via '10.1.1.16'
TOTAL TRANSMITTED MESSAGES <20> for Health Events service
RECEIVED MESSAGES <10> for Health Events service
SEND MESSAGES <10> for Health Events service
HALT REQUEST SEND COUNTER <0> for Health Events service
STORED MESSAGES for Health service (service 0/peer 0)
STATE <Process messages> for Health Events service
REQUESTED FOR REMOTE <Process messages> for Health Events service
REQUESTED FROM REMOTE <Process messages> for Health Events service
TOTAL TRANSMITTED MESSAGES <3> for Identity service
RECEIVED MESSAGES <1> for Identity service
SEND MESSAGES <2> for Identity service
HALT REQUEST SEND COUNTER <0> for Identity service
STORED MESSAGES for Identity service (service 0/peer 0)
STATE <Process messages> for Identity service
REQUESTED FOR REMOTE <Process messages> for Identity service
REQUESTED FROM REMOTE <Process messages> for Identity service
.
.
<Output omitted>
After comparing the SFTunnel statistics on the FMC and FTD, if you notice any anomaly, you can use the manage_procs.pl tool in FTD to restart the channels between the FMC and FTD.
If you run the manage_procs.pl tool on the FMC, and the FMC is currently managing many FTD devices, it restarts the communication channel between the FMC and all the FTD devices at the same time. If you need to restart the channel between the FMC and one particular FTD device only, you should run the manage_procs.pl tool on the Expert Mode of the desired FTD.
Example 7-13 shows the operation of the manage_procs.pl tool on the Expert Mode of FTD. Select option 3 to restart the communication channel.
Example 7-13 Menu of the manage_procs.pl Tool
> expert
admin@FTD:~$ sudo manage_procs.pl
Password:
**************** Configuration Utility **************
1 Reconfigure Correlator
2 Reconfigure and flush Correlator
3 Restart Comm. channel
4 Update routes
5 Reset all routes
6 Validate Network
0 Exit
**************************************************************
Enter choice: 3
**************** Configuration Utility **************
1 Reconfigure Correlator
2 Reconfigure and flush Correlator
3 Restart Comm. channel
4 Update routes
5 Reset all routes
6 Validate Network
0 Exit
**************************************************************
Enter choice: 0
Thank you
admin@FTD:~$
While the channel restarts, the system generates debug logs for stopping and starting various services. These logs provide detailed insight about the Firepower System’s communication at the application level and allow you to determine any complex communication issues.
Example 7-14 shows the debugging of a restart process from the FMC CLI. As soon as you begin the process in FTD, the FMC fails to connect to FTD. After the connection to FTD (IP address 10.1.1.2) is closed, the FMC (IP address 10.1.1.16) automatically begins the connection reestablishment process with the FTD.
Example 7-14 Debugging Logs Generated During Communication Channel Restart
admin@FMC:~$ sudo tail -f /var/log/messages | grep 10.1.1.2
Password:
! The following message appears on an FMC as soon as you begin the process on the
FTD. It confirms that the FMC is unable to connect to the FTD.
[timestamp] sftunneld:sf_connections [INFO] Unable to receive message from peer
10.1.1.2:Closed
[timestamp] sftunneld:sf_channel [INFO] >> ChannelState dropChannel peer 10.1.1.2 /
channelA / CONTROL [ msgSock & ssl_context ] <<
[timestamp] sftunneld:sf_connections [INFO] Exiting channel (recv). Peer 10.1.1.2
closed connection on interface eth0.
[timestamp] sftunneld:sf_connections [INFO] Failed to send in control channel for
peer 10.1.1.2 (eth0)
[timestamp] sftunneld:sf_channel [INFO] >> ChannelState dropChannel peer 10.1.1.2 /
channelA / DROPPED [ msgSock & ssl_context ] <<
[timestamp] sftunneld:sf_channel [INFO] >> ChannelState freeChannel peer 10.1.1.2 /
channelA / DROPPED [ msgSock & ssl_context ] <<
[timestamp] sftunneld:sf_connections [INFO] Need to send SW version and Published
Services to 10.1.1.2
[timestamp] sftunneld:sf_channel [INFO] >> ChannelState do_dataio_for_heartbeat peer
10.1.1.2 / channelB / EVENT [ msgSock2 & ssl_context2 ] <<
[timestamp] sftunneld:control_services [INFO] Successfully Send Interfaces info to
peer 10.1.1.2 over eth0
[timestamp] sftunneld:sf_connections [INFO] Unable to receive message from peer
10.1.1.2:Closed
[timestamp] sftunneld:sf_channel [INFO] >> ChannelState dropChannel peer 10.1.1.2 /
channelB / EVENT [ msgSock2 & ssl_context2 ] <<
[timestamp] sftunneld:sf_connections [INFO] Exiting channel (recv). Peer 10.1.1.2
closed connection on interface eth0.
[timestamp] sftunneld:sf_connections [INFO] Failed to send in control channel for
peer 10.1.1.2 (eth0)
[timestamp] sftunneld:sf_channel [INFO] >> ChannelState dropChannel peer 10.1.1.2 /
channelB / DROPPED [ msgSock2 & ssl_context2 ] <<
[timestamp] sftunneld:sf_channel [INFO] >> ChannelState freeChannel peer 10.1.1.2 /
channelB / DROPPED [ msgSock2 & ssl_context2 ] <<
[timestamp] sftunneld:sf_connections [INFO] ChannelState Peer 10.1.1.2 TOP OF THE
LOOP CHANNEL COUNT 0
[timestamp] sftunneld:sf_connections [INFO] <<<<<<<<<<<<<<<<<<<<<< ShutDownPeer
10.1.1.2 >>>>>>>>>>>>>>>>>>>>>>>>
[timestamp] sfmgr:sfmanager [INFO] Exiting child-sftunnel for peer '10.1.1.2'.
(relocated unix socket?)
[timestamp] sfmgr:sfmanager [INFO] Exiting child thread for peer 10.1.1.2
[timestamp] sfmgr:sfmanager [INFO] WRITE_THREAD:Terminated sftunnel write thread for
peer 10.1.1.2
[timestamp] sftunneld:stream_file [INFO] Stream CTX destroyed for 10.1.1.2
[timestamp] sftunneld:sf_channel [INFO] >> ChannelState ShutDownPeer peer 10.1.1.2 /
channelA / DROPPED [ msgSock & ssl_context ] <<
[timestamp] sftunneld:sf_channel [INFO] >> ChannelState ShutDownPeer peer 10.1.1.2 /
channelB / NONE [ msgSock & ssl_context ] <<
[timestamp] sftunneld:sf_connections [INFO] Peer 10.1.1.2 needs re-connect
[timestamp] sfmbservice:sfmb_service [INFO] Bad read/Connection closed to host
10.1.1.2
[timestamp] sfmbservice:sfmb_service [INFO] Connection closed to host 10.1.1.2
[timestamp] sfmbservice:sfmb_service [INFO] (4)Exiting child for peer 10.1.1.2.
[timestamp] sfmbservice:sfmb_service [INFO] (2)Exiting child for peer 10.1.1.2
! Shortly after the FMC closes connection with the FTD, it automatically starts
accepting connections from the FTD, and reestablishes connections with the FTD.
[timestamp] sftunneld:tunnsockets [INFO] Accepted IPv4 connection from
10.1.1.2:34088/tcp
[timestamp] sftunneld:sf_ssl [INFO] Processing connection from 10.1.1.2:34088/tcp
(socket 10)
[timestamp] sftunneld:sf_ssl [INFO] Accepted SSL connection from: 10.1.1.2:34088/tcp
[timestamp] sftunneld:sf_peers [INFO] Peer 10.1.1.2 needs the first connection
[timestamp] sftunneld:sf_ssl [INFO] Verify accepted: Need a new connection for peer
10.1.1.2 (1)
[timestamp] sftunneld:sf_ssl [INFO] Peer 10.1.1.2 supports multiple ports
[timestamp] sftunneld:sf_ssl [INFO] Peer 10.1.1.2 supports separate events
connection
[timestamp] sftunneld:sf_ssl [INFO] Peer 10.1.1.2 registration is complete remotely
[timestamp] sftunneld:sf_peers [INFO] Peer 10.1.1.2 needs the first connection
[timestamp] sftunneld:sf_ssl [INFO] Accept: Will start a child thread for peer
'10.1.1.2'
[timestamp] sftunneld:sf_ssl [INFO] Accept: Start child thread for peer '10.1.1.2'
[timestamp] sftunneld:sf_channel [INFO] >>>>>>> initChannels peer: 10.1.1.2 <<<<<<
[timestamp] sftunneld:stream_file [INFO] Stream CTX initialized for 10.1.1.2
[timestamp] sftunneld:sf_connections [INFO] Peer 10.1.1.2 main thread started
[timestamp] sftunneld:control_services [INFO] Successfully Send Interfaces info to
peer 10.1.1.2 over eth0
[timestamp] sftunneld:sf_heartbeat [INFO] Saved SW VERSION from peer 10.1.1.2
(6.1.0)
[timestamp] sftunneld:sf_connections [INFO] Need to send SW version and Published
Services to 10.1.1.2
[timestamp] sftunneld:sf_channel [INFO] >> ChannelState do_dataio_for_heartbeat peer
10.1.1.2 / channelA / CONTROL [ msgSock & ssl_context ] <<
[timestamp] sftunneld:control_services [INFO] Interface br1 from 10.1.1.2 supports
'control events'
[timestamp] sftunneld:control_services [INFO] Interface br1 from 10.1.1.2 supports
events
[timestamp] sftunneld:control_services [INFO] Interface br1 (10.1.1.2) from 10.1.1.2
is up
[timestamp] sftunneld:control_services [INFO] Peer 10.1.1.2 Notified that it is NOT
configured for dedicated events interface
[timestamp] sftunneld:sf_connections [INFO] Need to send SW version and Published
Services to 10.1.1.2
[timestamp] sftunneld:sf_channel [INFO] >> ChannelState do_dataio_for_heartbeat peer
10.1.1.2 / channelA / CONTROL [ msgSock & ssl_context ] <<
[timestamp] sftunneld:sf_heartbeat [INFO] Saved SW VERSION from peer 10.1.1.2
(6.1.0)
[timestamp] sfmgr:sfmanager [INFO] Established connection to sftunnel for peer
10.1.1.2 (fd 8)
.
.
<Output omitted for brevity>
.
.
[timestamp] sftunneld:sf_heartbeat [INFO] Identity Service is published for peer
10.1.1.2
[timestamp] sftunneld:sf_peers [INFO] Using a 20 entry queue for 10.1.1.2 - 7770
[timestamp] sfmbservice:sfmb_service [INFO] Start getting MB messages for 10.1.1.2
[timestamp] sfmbservice:sfmb_service [INFO] Established connection to peer 10.1.1.2
[timestamp] sftunneld:sf_heartbeat [INFO] Message Broker Service is published for peer
10.1.1.2
Summary
This chapter describes licensing and registration—two important initial tasks in Firepower deployment. In this chapter, you have learned the capabilities of different Firepower licenses and the steps to register the FMC with a Smart Licensing Server. This chapter also discusses the registration process and the tools you can use to investigate communication issues.
Quiz
1. Which tool is used in FTD to view the statistics of events inside the encrypted tunnel between FTD and the FMC?
a. > sftunnel
b. > sftunnel-status
c. > sftunnel_status
d. > sftunnel status
2. Which command confirms whether FTD is registered with the FMC?
a. > show fmc
b. > show console
c. > show managers
d. > show registration
3. Which statement about registration is incorrect?
a. Always begin the registration process from FTD.
b. NAT ID is necessary only when there is an intermediate NAT device between the FMC and FTD.
c. Before registering FTD, the FMC must be connected to a license server.
d. FTD and FMC use port 8305 for registration and management communication purposes.
4. Which command shows the logs between the FMC and a Smart Licensing Server?
a. sudo tail -f /var/log/messages
b. sudo tail -f /var/log/messages.log
c. sudo tail -f /var/log/cssm.log
d. sudo tail -f /var/log/sam.log
5. Which tool allows you to restart the communication channel between the FMC and FTD?
a. sftunnel_status.pl
b. sftunnel_restart.pl
c. manage_procs.pl
d. manage_channel.pl
6. Which statement is correct about the Smart Licensing architecture?
a. Evaluation Mode allows you to test certain features but not all of them.
b. FTD connects to the Smart Licensing Server to obtain licenses.
c. The Cisco satellite server is an on-premises virtual machine.
d. To register the FMC with the Smart Licensing Server, run the command configure manager add <IP_Address_of_the_CSSM>