
Chapter 4. Troubleshooting Cisco ASA with FirePOWER Services and Firepower Threat Defense (FTD)
This chapter provides step-by-step guidance on how to troubleshoot common problems you may encounter when deploying the Cisco ASA with FirePOWER Services module and the Firepower Threat Defense software. The following topics are covered in this chapter:
![]() Useful show commands
Useful show commands
![]() Access control policy details
Access control policy details
![]() Network configuration details
Network configuration details
![]() Storage usage monitoring
Storage usage monitoring
![]() Running process analysis
Running process analysis
![]() System log (Syslog)
System log (Syslog)
![]() System task monitoring and troubleshooting
System task monitoring and troubleshooting
![]() Advanced troubleshooting logs
Advanced troubleshooting logs
![]() Useful ASA debugging commands
Useful ASA debugging commands
Useful show Commands
Several show commands can be very helpful when troubleshooting problems in the Cisco ASA with FirePOWER Services module. These show commands also apply to Cisco Firepower Threat Defense (FTD).
If you are running the Cisco ASA with FirePOWER Services module, connect to the module using the session command. Alternatively, you can connect directly to the module management interface using secure shell (SSH). Once you are in the module, to get an overview of all the show commands that are available, log in to the command-line interface (CLI) of the Cisco ASA with FirePOWER Services module and enter the show command as demonstrated in Example 4-1.
Example 4-1 Available show Commands
ASA-1# session sfr console
Opening console session with module sfr.
Connected to module sfr. Escape character sequence is 'CTRL-^X'.RTP-SF login: admin
Password:
Last login: Fri Jan 22 04:34:20 UTC 2016 on ttyS1
Copyright 2004-2015, Cisco and/or its affiliates. All rights reserved.
Cisco is a registered trademark of Cisco Systems, Inc.
All other trademarks are property of their respective owners.
Cisco Linux OS v5.4.1 (build 12)
Cisco ASA5508 v5.4.1.2 (build 23)
> show
Show>
access-control-config Show Current Access-Control Configuration
audit-log Show audit log
configure Change to Configuration mode
cpu Show CPU utilization
database Change to Show Database Mode
device-settings Show device settings
disk Show disk usage
disk-manager Display current status of local disk(s)
dns Show DNS configuration
end Return to the default mode
exit Exit Show Mode
expert Invoke a shell
help Display an overview of theLI syntax
history Display the current session's command line history
hostname Show hostname
hosts Show hosts
ifconfig Show currently configured interfaces
interfaces Show interface configuration
kdump Display status of kernel crash dump feature
log-ips-connection Display Logging of Connection Events setting
logout Logout of the current CLI session
managers Show managing Defense Centers
memory Show available memory
model Show model
netstat Show network connections
network Show configuration of management interface
network-static-routes Show static routes for management interfaces
ntp Show NTP configuration
perfstats Shoperfstats
process-tree Show processes in tree format
processes Show processes
route Show configured routes
serial-number Show serial number
show Change to Show Mode
summary Show summary
system Change to System Mode
time Show time
traffic-statistics Show traffic statistics
user Show specified users
users Show all users
version Show versions
The following sections cover some of the most useful show commands and when to use them.
Displaying the Access Control Policy Details
In Chapter 3, “Configuring Cisco ASA with FirePOWER Services,” you learned about the access control policies in the Cisco ASA FirePOWER module. You may encounter problems related to the configuration of those policies and perhaps configuration errors in Cisco’s Adaptive Security Device Manager (ASDM). An alternative way to view the access control policy configuration is by using the show access-control-config command, whose output can be useful when you’re troubleshooting configuration issues related to access control policies. Example 4-2 shows an example of output from the show access-control-config command.
Example 4-2 show access-control-config Command Output
Show> show access-control-config
! The following is the policy we already had configured in the system (myPolicy).
====================[ myPolicy ]====================
Description : my new access control policy
HTTP Block Response : Default
Interactive Block Response: Default
=================[ Default Action ]=================
! In this case, the default action is set to allow the traffic through the device.
Default Action : Allow
Default Policy : Balanced Security and Connectivity
Logging Configuration
DC : Disabled
Beginning : Disabled
End : Disabled
Rule Hits : 45894
Variable Set : Default Set
! The following two sections are the whitelist and blacklist from the global threat
intelligence coming from Cisco.
=======[ Security Intelligence - Whitelist ]========
Name : Global Whitelist (List)
Zone : any
=======[ Security Intelligence - Blacklist ]========
Logging Configuration : Enabled
DC : Enabled
---------------------[ Block ]----------------------
Name : Malware (Feed)
Zone : any
Name : Tor_exit_node (Feed)
Zone : any
Name : Bogon (Feed)
Zone : any
Name : CnC (Feed)
Zone : any
Name : Global Blacklist (List)
Zone : any
Name : Phishing (Feed)
Zone : any
! The following two main categories (admin_category and root_category) are default
built-in rules
======[ Category: admin_category (Built-in) ]=======
=====[ Category: standard_category (Built-in) ]=====
------------------[ Rule: rule1 ]-------------------
Action : Block
Source Zones : myNewZone
Destination Zones : myNewZone
Logging Configuration
DC : Disabled
Beginning : Disabled
End : Disabled
Files : Disabled
Rule Hits : 0
=======[ Category: root_category (Built-in) ]=======
===============[ Advanced Settings ]================
General Settings
Maximum URL Length : 1024
Interactive Block Bypass Timeout : 600
Network Analysis and Intrusion Policies
Initial Intrusion Policy : Balanced Severity and Connectivity
Initial Variable Set : Default Set
Default Network Analysis Policy : Balanced Security and Connectivity
Files and Malware Settings
File Type Inspect Limit : 1460
Cloud Lookup Timeout : 2
Minimum File Capture Size : 6144
Maximum File Capture Size : 1048576
Min Dynamic Analysis Size : 15360
Max Dynamic Analysis Size : 2097152
Malware Detection Limit : 10485760
Transport/Network Layer Preprocessor Settings
Detection Settings
Ignore VLAN Tracking Connections : False
Maximum Active Responses : No Maximum
Minimum Response Seconds : No Minimum
Session Termination Log Threshold : 1048576
Detection Enhancement Settings
Adaptive Profile : Disabled
Performance Settings
Event Queue
Maximum Queued Events : 5
Disable Reassembled Content Checks: False
Performance Statistics
Sample time (seconds) : 300
Minimum number of packets : 10000
Summary : False
Log Session/Protocol Distribution : False
Regular Expression Limits
Match Recursion Limit : Default
Match Limit : Default
Rule Processing Configuration
Logged Events : 5
Maximum Queued Eve : 8
Events Ordered By : Content Length
Latency-Based Performance Settings
Packet Handling
Threshold (microseconds) : 256
Rule Handling
Violations Before Suspending Rule : 3
Threshold (microseconds) : 512
Session Time : 10
! The following is the HTML code for the block response after a website or web
resource is blocked.
============[ HTTP Block Response HTML ]============
HTTP/1.1 403 Forbidden
Connection: close
Content-Length: 506
Content-Type: text/html; charset=UTF-8
<!DOCTYPE html>
<html>
<head>
<meta http-equiv="content-type" content="text/html; charset=UTF-8" />
<title>Access Denied</title>
<style type="text/css">body {margin:0;font-family:verdana,sans-serif;} h1 {margi
n:0;padding:12px 25px;background-color:#343434;color:#ddd} p {margin:12px 25px;}
strong {color:#E0042D;}</style>
</head>
<body>
<h1>Access Denied<1>
<p>
<strong>You are attempting to access a forbidden site.</strong><br/><br/>
Consult your system administrator for details.
</p>
</body>
</html>
=============[ Interactive Block HTML ]=============
HTTP/1.1 200 OK
Connection: close
Content-Length: 869
Content-Type: text/html; charset=UTF-8
<!DOCTYPE html>
<html>
<head>
<meta http-equiv="content-type" content="text/html; charset=UTF-8" />
<title>Access Denied</title>
<style type="text/css">body {margin:0;font-family:verdana,sans-serif;} h1 {margi
n:0;padding:12px 25px;background-color:#343434;color:#ddd} p {margin:12px 25px;}
/head>g {color:#E0042D;}</style>
<body>
<h1>Access Denied</h1>
<p>
<strong>You are attempting to access a forbidden site.</strong><br/><br/>
You may continue to the site by clicking on the button below.<br/>
<em>Note:</em> You must have cookies enabled in your browser to continue.</br><b
r/>
Consult your system administrator for details.<br/><br/>
<noscript><em>This page uses JavaScript. Your browser either doesn't support
JavaScript or you have it turned off.<br/>
To continue to the site, please use a Javascript enabled browser.</em></noscript
>
</p>
</body>
</html>
Displaying the Network Configuration
A good way to display the network configuration in the Cisco ASA FirePOWER module is by using the show network command, as shown in Example 4-3.
Example 4-3 show network Command Output
Show> show network
===============[ System Information ]===============
Hostname : RTP-SF
Domains : cisco.com
DNS Servers : 208.67.222.222
Management port : 8305
IPv4 Default route
Gateway : 192.168.78.1
======================[ eth0 ]======================
State : Enabled
Channels : Management & Events
Mode :
MDI/MDIX : Auto/MDIX
MTU : 1500
MAC Address : 18:8B:9D:AD:79:C0
----------------------[ IPv4 ]----------------------
Configuration : Manual
Address : 192.168.78.2
Netmask : 255.255.255.0
Broadst : 192.168.78.255
----------------------[ IPv6 ]----------------------
Configuration : Disabled
===============[ Proxy Information ]================
State : Disabled
Authentication : Disabled
The show network command displays the system information, including the module host name, configured domain name, DNS servers, management port, and default gateway. It also provides the configured IPv4 and IPv6, netmask, and broadcast addresses. It shows whether the management port is enabled or disabled, as well as the interface MAC address, configured MTU size, and other information.
To display the IPv4 and IPv6 routing table, you can use the show route command, as shown in Example 4-4.
Example 4-4 Displaying the Routing Table
Show> show route
Kernel IP routing table
Destination Gateway Netmask Flags Metric Ref Use Iface
192.168.78.0 0.0.0.0 255.255.255.0 U 0 0 0 eth0
127.0.0.0 0.0.0.0 255.255.0.0 U 0 0 0 cplane
0.0.0.0 192.168.78.1 0.0.0.0 UG 0 0 0 eth0
Kernel IPv6 routing table
Destination Next Hop Flags Metric Ref Use Iface
::1/128 :: U 0 16 1 lo
fe80::200:ff:fe02:1/128 :: U 0 0 1 lo
fe80::1a8b:9dff:fead:79c0/128 :: U 0 0 1 lo
fe80::/64 :: U 256 0 0 cplane
fe80::/64 :: U 256 0 0 eth0
ff00::/8 :: U 256 0 0 cplane
ff00::/8 :: U 256 0 0 eth0
In Example 4-4 you can see that the IPv4 default gateway is set to 192.168.78.1, and the other two routes are the local networks assigned to the management interface (eth0) and loopback address. In this example, IPv6 is disabled, and you see only locally specific IPv6 information.
To display configured static routes, you can use the show network-static-routes command.
The show ifconfig command provides similar output to the Linux ifconfig command, as shown in Example 4-5.
Example 4-5 show ifconfig Command Output
Show> show ifconfig
cplane Link encap:Ethernet HWaddr 00:00:00:02:00:01
inet addr:127.0.2.1 Bcast:127.0.255.255 Mask:255.255.0.0
inet6 addr: fe80::200:ff:fe02:1/64 Scope:Link
UP BROADCAST RUNNING MULTICAST MTU:1500 Metric:1
RX packets:1480872 errors:0 dropped:0 overruns:0 frame:0
TX packets:248543 errors:0 dropped:0 overruns:0 carrier:0
collisions:0 txqueuelen:1000
RX bytes:88914526 (84.7 Mb) TX bytes:22370811 (21.3 Mb)
eth0 Link encap:Ethernet HWaddr 18:8B:9D:AD:79:C0
inet addr:192.168.78.2 Bcast:192.168.78.255 Mask:255.255.255.0
inet6 addr: fe80::1a8b:9dff:fead:79c0/64 Scope:Link
UP BROADCAST RUNNING MULTICAST MTU:1500 Metric:1
RX packets:2562033 errors:0 dropped:0 overruns:0 frame:0
TX packets:284558 errors:0 dropped:0 overruns:0 carrier:0
collisions:0 txqueuele1000
RX bytes:1123651792 (1071.5 Mb) TX bytes:102970664 (98.2 Mb)
lo Link encap:Local Loopback
inet addr:127.0.0.1 Mask:255.255.255.0
inet6 addr: ::1/128 Scope:Host
UP LOOPBACK RUNNING MTU:16436 Metric:1
RX pack:147207 errors:0 dropped:0 overruns:0 frame:0
TX packets:147207 errors:0 dropped:0 overruns:0 carrier:0
collisions:0 txqueuelen:0
RX bytes:59089295 (56.3 Mb) TX bytes:59089295 (56.3 Mb)
The output shown in Example 4-5 is very similar to the output of the ifconfig command in most Linux operating systems. The highlighted lines show the network configuration of eth0, which is the management interface. A better way to display the interface configuration is to use the show interfaces command, as demonstrated in Example 4-6.
Example 4-6 show interfaces Command Output
Show> show interfaces
! This is the outside interface of the ASA. It is associated with the "Internet"
security zone.
--------------------[ outside ]---------------------
Physical Interface : GigabitEthernet1/1
Type : ASA
Security Zone : Internet
Status : Enabled
Load Balancing Mode : N/A
! This is the inside interface of the ASA. It is associated with the "myNewZone"
security zone.
---------------------[ inside ]---------------------
Physical Interface : GigabitEthernet1/2
Type : ASA
Security Zone : myNewZone
Status : Enabled
Load Balancing Mode : N/A
---------------------[ cplane ]---------------------
IPv4 Address : 127.0.2.1
! Ethernet 0 (eth0) is the management interface.
----------------------[ eth0 ]----------------------
Physical Interface : ethType : Management
Status : Enabled
MDI/MDIX : Auto
MTU : 1500
MAC Address : 18:8B:9D:AD:79:C0
IPv4 Address : 192.168.78.2
---------------------[ tunl0 ]----------------------
----------------------------------------------------
Monitoring Storage Usage
It is very important to monitor disk/storage usage by module to understand the available resources. A good CLI command to use to monitor storage usage and health is the show disk command. Example 4-7 shows an example of the output generated by this command.
Example 4-7 show disk Command Output
Show> show disk
Filesystem Size Used Avail Use% Mounted on
/dev/root 3.7G 692M 2.9G 20% /
devtmpfs 1.7G 60K 1.7G 1% /dev
/dev/sda1 92M 35M 53M 40% /boot
/dev/vda7 65G 9.4G 53G 16% /var
none 1.7G 7.0M 1.7G 1% /dev/shm
The output shown in Example 4-7 includes a few columns: Filesystem (partition), Used, Avail, Use%, and Mounted on. This is very similar to the output of the df command in Linux.
You can run out of disk space on the Firepower Management Center, the Firepower appliances, or the Cisco ASA FirePOWER Services module for many different reasons. When this happens, the high disk utilization may trigger a health alert or the system may fail a software update attempt.
Storing large volumes of old backup files on the system can take excessive space on your disk. In order to correct this, delete the old backup files using the web management interface under System > Tools > Backup/Restore.
The system may also run out of space if you always keep the previous software update, upgrade, and patch files. To correct this, delete the older update and patch files that are no longer necessary under System > Updates.
You have to be careful not to oversubscribe the FMC—for instance, if the module or any other managed device has stopped sending events to the FMC or if a device is generating more events than the FMC is designed to receive (per second). Also, if the FMC is unable to receive new IPS events, you should check to see if there are any communication issues between the managed device and the management center.
The root (/) partition is a fixed size and is not intended for personal storage. If the root (/) partition is full, you should check for unnecessary files in the /root, /home, and /tmp folders. Because these folders are not meant for personal storage, you can delete any personal files in them by using the rm command.
In ASDM, you can monitor the disk usage by navigating to Monitoring > ASA FirePOWER Monitoring > Statistics, as shown in Figure 4-1.

Analyzing Running Processes
In ASDM, you can display and analyze all running processes much the way you display process information in Linux: just navigate to Monitoring > ASA FirePOWER Monitoring > Statistics, as shown in Figure 4-1. You can obtain similar output by using the show processes command in the CLI, as shown in Example 4-8.
Example 4-8 Displaying the Running Processes in the CLI
Show> show processes
PID USER PR NI VIRT RES SHR S %CPU %MEM TIME+ COMMAND
4203 root 20 0 7964 2120 1024 S 4 0.1 5:02.35 pmmon.sh
4280 root 20 0 140m 7640 1260 S 4 0.2 293:38.98 diskmanager
4281 root 20 0 9388 952 700 S 4 0.0 269:27.89 UEChanneld
25195 sfsnort 1 -19 1042m 402m 20m S 4 11.6 15:03.18 snort
4323 root 0 -20 0 0 0 S 2 0.0 254:39.37 kvm_ivshmem_rxt
24135 admin 20 0 17376 1364 984 R 2 0.0 0:00.01 top
25194 sfsnort 1 -19 970m 387m 13m S 2 11 17:52.33 snort
1 root 20 0 4168 640 588 S 0 0.0 0:07.31 init
2 root 20 0 0 0 0 S 0 0.0 0:00.00 kthreadd
3 root RT 0 0 0 0 S 0 0.0 0:00.06 migration/0
4 root 20 0 0 0 0 S 0 0.0 0:.54 ksoftirqd/0
5 root RT 0 0 0 0 S 0 0.0 0:00.03 migration/1
6 root 20 0 0 0 0 S 0 0.0 0:12.69 ksoftirqd/1
7 root RT 0 0 0 0 S 0 0.0 0:00.06 migration/2
8 root 20 0 0 0 0 S 0.0 0:05.53 ksoftirqd/2
9 root RT 0 0 0 0 S 0 0.0 0:09.59 migration/3
10 root 20 0 0 0 0 S 0 0.0 0:15.40 ksoftirqd/3
11 root RT 0 0 0 0 S 0 0.0 0:11.04 migration/4
12 root 20 0 0 0 0 0 0.0 0:18.08 ksoftirqd/4
13 root RT 0 0 0 0 S 0 0.0 0:12.15 migration/5
14 root 20 0 0 0 0 S 0 0.0 0:19.53 ksoftirqd/5
<output omitted for brevity>
The show process command output shown in Example 4-8 is very similar to the output of the ps command in Linux. Understanding what processes are running on your system and what they are doing is important. You need to know which processes are using the most memory and which ones are using the most CPU. You also need to know how to find a particular process. A key process is the snort process (highlighted in Example 4-8), which is the IPS engine of the system.
You can also use the show process-tree command to show the processes in a tree format that indicates which processes are dependent of each other, as shown in Example 4-9.
Example 4-9 show process-tree Command Output
Show> show process-tree
init(1)-+-agetty(4199)
|-agetty(4200)
|-agetty(4201)
|-crond(2661)
|-klogd(2651)
|-login(20653)---clish(20656)-+-sh(24269)-+-more(24271)
| | '-pstree(24270)
| '-{clish}(20659)
|-nscd(14774)-+-{nscd}(14777)
| |-{nscd}(14778)
| |-{nscd}(14779)
| |-{nscd}(14780)
| |-{nscd(14781)
| '-{nscd}(14782)
|-pm(4214)-+-ASAConfig.pl(4269)
| |-ActionQueueScra(4277)
| |-CloudAgent(4289)-+-{CloudAgent}(4316)
| | |-{CloudAgent}(4317)
| | |-{CloudAgent}(4318)
| | '-{CloudAgent}(4319)
| |-Pruner.pl(4276)
| |-SFDataCorrelato(4272)-+-{SFDataCorrelato}(4375)
| | |-{SFDataCorrelato}(4376)
| | |-{SFDataCorrelato}(4377)
| | |-{SFDataCorrelato}(4380)
| | |-{SFDataCorrelato}(4382)
| | |-{SFDataCorrelato}(4384)
| | |-{SFDataCorrelato}(4387)
| | |-{SFDataCorrelato}(4469)
| | |-{SFDataCorrelato}(4470)
<output omitted for brevity>
The output shown in Example 4-9 is very similar to the output of the pstree command in Linux. Example 4-9 shows running processes as a tree so that you can see what processes are related to each other.
Using the System Log (Syslog)
The syslog is one of the most useful tools for troubleshooting problems you might encounter in the Cisco ASA FirePOWER module. You can view the syslog in ASDM by navigating to Monitoring > ASA FirePOWER Monitoring > Syslog, as shown in Figure 4-2.

You can also view real-time event information of all functions of the Cisco ASA FirePOWER module by navigating to Monitoring > ASA FirePOWER Monitoring > Real Time Eventing, as shown in Figure 4-3. You can see all ASA FirePOWER events by selecting the All ASA FirePOWER Events tab, as shown in Figure 4-3. You can also see events related to connections passing through the module, intrusion, file inspection, or malware file events and security intelligence events by selecting the corresponding tabs. This screen also allows you to filter by many different criteria.

You can access very detailed logs by using the expert command to go into the “expert” mode. This command brings you to a Linux prompt, as shown in Example 4-10.
Example 4-10 Generating Detailed Logs with Expert Mode
Show> expert
admin@RTP-SF:~$ cd /
admin@RTP-SF:/$ ls
DBCheck.log boot dyn-preproc-upgrade-log lib mnt sbin upgraded
Volume cisco etc lib64 proc sys usr
Bin dev home lost+found root tmp var
While in expert mode, you can access many logs by changing directories to /var/log/, as shown in Example 4-11.
Example 4-11 Accessing Detailed Logs in Expert Mode
admin@RTP-SF:~$ cd /var/log
admin@RTP-SF:/var/log$ ls
SMART_STATUS_sda_20160119050740.txt
action_queue.log
action_queue.log.1.gz
action_queue.log.2.gz
action_queue.log.3.gz
action_queue.log.4.gz
asacx_init.log
audit
btmp
cisco
configure-model.log
configure.log
configure.log.old
cron
cron.1.gz
cron.2.gz
cron.3.gz
cron.4.gz
diskmanager.log
dmesg
eth0.down.log
eth0.down.log.old
th0.up.log.old
faillog
firesight-query.log
firesight-query.log.1.gz
firesight-query.log.2.gz
firesight-query.log.3.gz
firesight-query.log.4.gz
firstboot.S01reset_failopen_if
firstboot.S03install-math-pari.sh
firstboot.S04fix-httpd.sh
firstboot.S05set-mgmnt-port
firstboot.6addusers
firstboot.S07uuid-init
firstboot.S09configure_mysql
firstboot.S10database
firstboot.S10database.15vulndb-init.log
firstboot.S12install_infodb
firstboot.S15set-locale.sh
<output omitted for brevity>
You can view each log by using the cat command. For example, to view the scheduled tasks log, you can use the cat schedule_tasks.log command, as shown in Example 4-12.
Instead of using the cat command, you can use the tail command, which is basically the same as the Linux tail command. To view new log lines as they are generated, you can use the tail -f command.
Example 4-12 Viewing the Scheduled Tasks Log
admin@RTP-SF:/var/log$ cat schedule_tasks.log
Jan 17 08:00:01 RTP-SF schedule_wrapper.pl[31159]: Starting run of task 2...
Jan 17 08:00:02 RTP-SF schedule_wrapper.pl[31159]: Task 2 should not be run now. at
/usr/local/sf/bin/schedule_wrapper.pl line 217.
Jan 17 08:00:02 RTP-SF schedule_wrapper.pl[31159]: Ending run of task 2 ().
Jan 17 08:00:02 RTP-SF schedule_wrapper.pl[31159]:
Jan 17 08:00:02 RTP-SF schedule_wrapper.pl[31159]:
Jan 17 09:00:02 RTP-SF schedule_wrapper.pl[2879]: Starting run of task 2...
Jan 17 09:00:03 RTP-SF schedule_wrapper.pl[2879]: Validating task 2...
Jan 17 0:00:03 RTP-SF schedule_wrapper.pl[2879]: VALIDATING 1 1 on on at /usr/local/
sf/lib/perl/5.10.1/SF/ScheduleTask/UpdateSRU.pm line 47.
Jan 17 09:00:03 RTP-SF schedule_wrapper.pl[2879]: Task 2 was validated successfully.
Jan 17 09:00:03 RTP-SF schedule_wrapper.pl[2879]: Executing task ..
Jan 17 09:00:03 RTP-SF schedule_wrapper.pl[2879]: RUN UpdateSRU task...
Jan 17 09:00:03 RTP-SF schedule_wrapper.pl[2879]: ---------------
Jan 17 09:00:03 RTP-SF schedule_wrapper.pl[2879]:
Jan 17 09:00:03 RTP-SF schedule_wrapper.pl[2879]: https://support.sourcefire.com/
auto-upde/auto-dl.cgi/72:18:8B:9D:AD:79:C0/
Jan 17 09:00:03 RTP-SF schedule_wrapper.pl[2879]:
Jan 17 09:00:03 RTP-SF schedule_wrapper.pl[2879]: https://support.sourcefire.com/
auto-update/auto-dl.cgi/72:18:8B:9D:AD:79:C0/GetCurrent/sf.xml------------------
Jan 17 09:00:03 RTP-SF schedule_wpper.pl[2879]:
Jan 17 09:00:03 RTP-SF schedule_wrapper.pl[2879]:
Jan 17 09:00:05 RTP-SF schedule_wrapper.pl[2879]: We have SF::System::Md5Sum
--a8ebe509a002cbe7f26a3879eb553d85 ./Sourcefire_Rule_Update-2016-01-13-002-vrt.
sh.
Jan 17 09:00:16 RTP-SF schedule_wrapper.pl[2879]: CaughSFSystem Exception!
Jan 17 09:00:16 RTP-SF schedule_wrapper.pl[2879]: System (/usr/local/sf/bin/
install_rule.pl /var/sf/SRU/Sourcefire_Rule_Update-2016-01-13-002-vrt.sh) Failed
at /usr/local/sf/lib/perl/5.10.1/SF/System/Privileged.pm line 2636.
Jan 17 09:00:16 RTP-SF schedule_wrapr.pl[2879]:
Jan 17 09:00:16 RTP-SF schedule_wrapper.pl[2879]: Request stdout!
Jan 17 09:00:16 RTP-SF schedule_wrapper.pl[2879]: The package is /var/sf/SRU//var/
sf/SRU/Sourcefire_Rule_Update-2016-01-13-002-vrt.sh
Jan 17 09:00:16 RTP-SF schedule_wrapper.pl[2879]: Verifying archive egrity... All
good.
<output omitted for brevity>
Monitoring and Troubleshooting System Tasks
You can display complete, pending, or failed jobs (system tasks) by navigating to Monitoring > ASA FirePOWER Monitoring > Task Status, as shown in Figure 4-4.
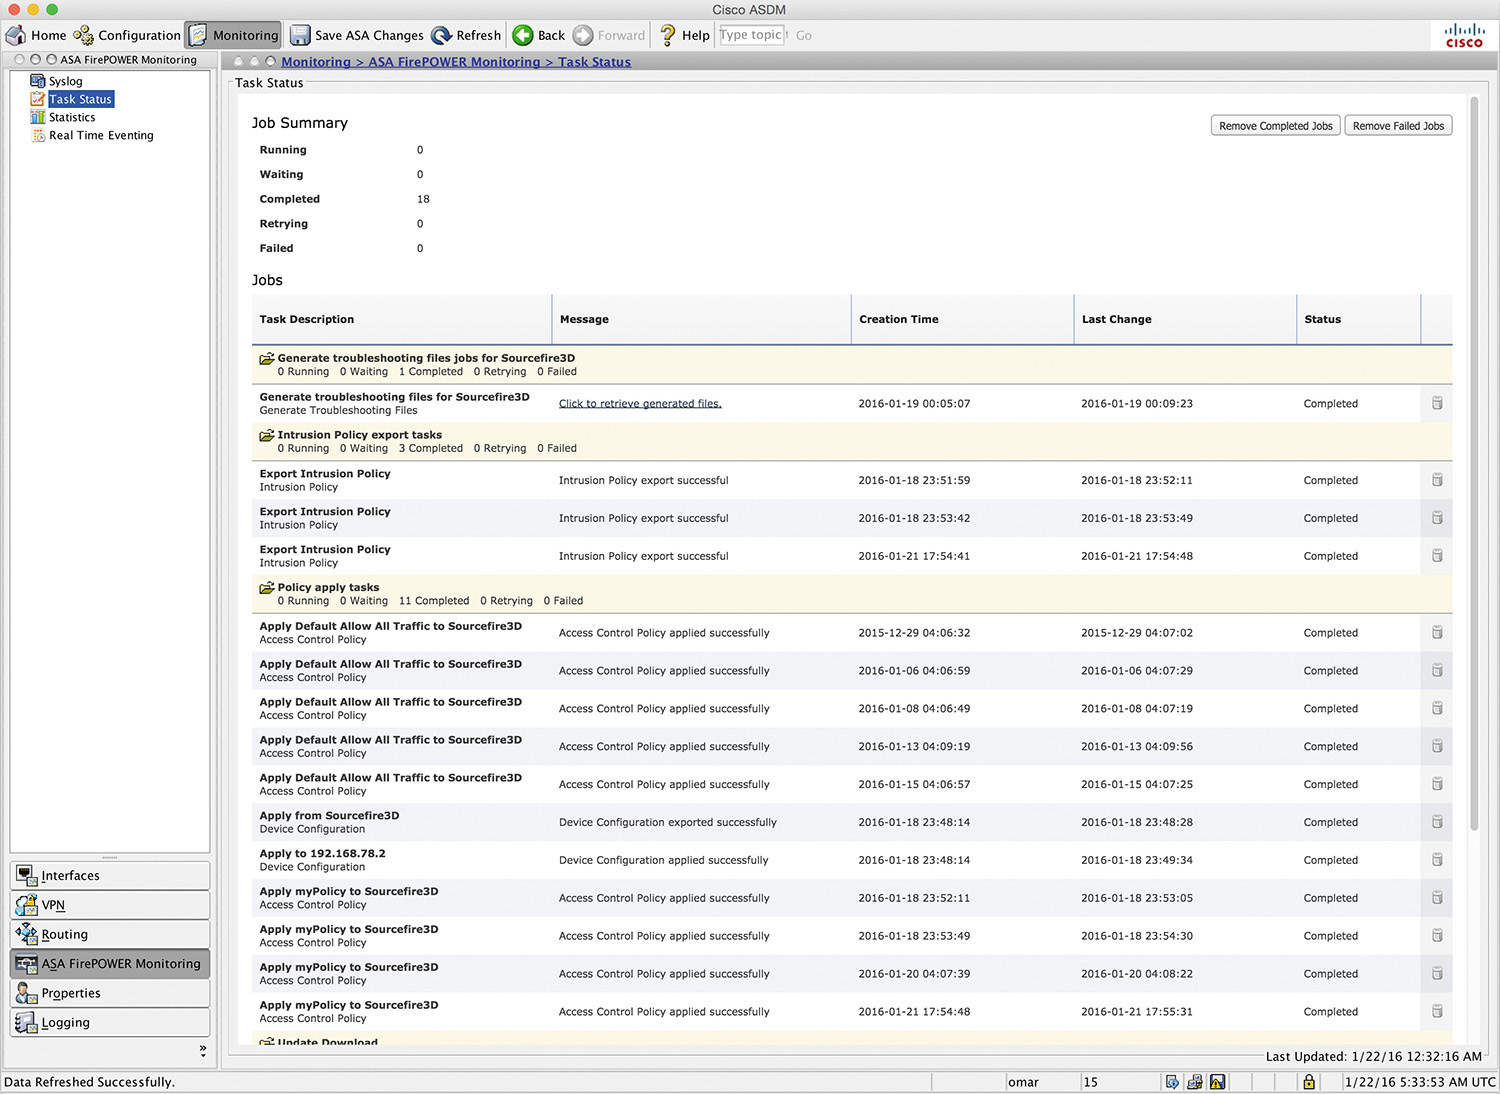
This screen is useful for viewing and troubleshooting problems with specific tasks, such as intrusion policy tasks, access policies, device update downloads and installations, and more.
Generating Advanced Troubleshooting Logs
You can use the system generate-troubleshoot command to generate very advanced and detailed logs that can be used for troubleshooting, as shown in Example 4-13.
Example 4-13 The system generate-troubleshoot Command
> system generate-troubleshoot
One or more subset options required. Displaying list of options:
ALL - Run ALL Of The Following Options
SNT - Snort Performance and Configuration
PER - Hardware Performance and Logs
SYS - System Configuration, Policy, and Logs
DES - Detection Configuration, Policy, and Logs
NET - Interface and Network Related Data
VDB - Discovery,wareness, VDB Data, and Logs
UPG - Upgrade Data and Logs
DBO - All Database Data
LOG - All Log Data
NMP - Network Map Information
Example 4-14 demonstrates the use of the all keyword to generate logs for all the aforementioned options.
Example 4-14 system generate-troubleshoot all Command Output
> system generate-troubleshoot all
Starting /usr/local/sf/bin/sf_troubleshoot.pl...
Please, be patient. This may take several minutes.
The troubleshoot option code specified is ALL.
Troubleshooting information successfully created at /var/common/
results-01-22-2016--184950.tar.gz
The system generate-troubleshoot all command can take several minutes to run, as the warning message in Example 4-14 indicates. This command generates and collects an incredible number of logs that are extremely useful for troubleshooting many problems.
After the command finishes and stores all the logs, you can then transfer the archive to your local machine or to an admin server using secure copy (SCP), as shown in Example 4-15.
Example 4-15 Transferring Troubleshooting Logs to a Local Machine/Admin Server
System> system file secure-copy omar.cisco.com omar dest_dir /var/common/
results-01-22-2016--184950.tar.gz
The authenticity of host 'omar.cisco.com (172.18.104.139)' can't be established.
ECDSA key fingerprint is 9b:f1:b2:62:04:65:be:29:94:af:09:9a:04:50:2c:0a.
Are you sure you want to continue connecting (yes/no)? yes
[email protected]'s password:*******************
copy successful.
You can also generate the troubleshooting files in ASDM by navigating to Configuration > ASA FirePOWER Configuration > Tools > Troubleshooting, as shown in Figure 4-5.

Sometimes you may run into trouble when trying to determine what access control rule is blocking or allowing traffic. The restricted shell in the Firepower software provides a utility that can help you determine the status of each flow as the system receives packets in real time. You can invoke this utility by using the system support firewall-engine-debug command, which prompts you to enter the following information:
![]() IP protocol, either TCP or UDP
IP protocol, either TCP or UDP
![]() Client IP
Client IP
![]() Client port
Client port
![]() Server IP
Server IP
![]() Server port
Server port
Example 4-16 shows output from the system support firewall-engine-debug command after you enter the required information.
Example 4-16 system support firewall-engine-debug Command Output
10.10.10.123-33533 and 10.20.20.21-80 6 Starting VLan first with intfs 2 -> 1, vlan
0, svc 0, payload 0, client 0, misc 0, user 0, url
10.10.10.123-33533 and 10.20.20.21-80 6 pending rule order 1, 'Block social media',
URL
10.10.10.123-33533 and 10.20.20.21-80 6 Starting VLan first with intfs 2 -> 1, vlan
0, svc 0, payload 0, client 0, misc 0, user 0, url
10.10.10.123-33533 and 10.20.20.21-80 6 pending rule order 1, 'Block social media',
URL
10.10.10.123-33533 and 10.20.20.21-80 6 Starting VLan first with intfs 2 -> 1, vlan
0, svc 0, payload 0, client 0, misc 0, user 0, url
10.10.10.123-33533 and 10.20.20.21-80 6 pending rule order 1, 'Block social media',
URL
10.10.10.123-33533 and 10.20.20.21-80 6 Starting VLan first with intfs 2 -> 1, vlan
0, svc 676, payload 629, client 638, misc 0, user 0, url http://cisco.com/
10.10.10.123-33533 and 10.20.20.21-80 6 match rule order 1, 'Block social media',
action Block
The Cisco ASA drops packets if they are not compliant with the enterprise’s configured security policy or if something is wrong in the system. These drops could be related to the deny statements in the ACLs, illegitimate VPN packets, a malformed TCP segment, or a packet with invalid header information. In some cases, you will want to get the statistical information about the packets or connections dropped by the security appliance within its accelerated security path (ASP). You can use the show asp drop ASA command to view the reasons that a packet was dropped, as shown in Example 4-17.
Example 4-17 show asp drop Command Output
ASA# show asp drop
Frame drop:
No route to host (no-route) 618
Interface is down (interface-down) 4
Last clearing: Never
Flow drop:
Last clearing: Never
The highlighted lines in Example 4-17 shows that the frame was dropped because there was no route to the destination. In this case, it was because the egress interface was down.
Useful ASA Debugging Commands
A few debugging commands in the Cisco ASA are useful when you’re troubleshooting problems with the module. The following are the most popular ones:
![]() debug sfr error: Used to display errors related to the Cisco ASA FirePOWER module
debug sfr error: Used to display errors related to the Cisco ASA FirePOWER module
![]() debug sfr event: Used to display general events related to the Cisco ASA FirePOWER module
debug sfr event: Used to display general events related to the Cisco ASA FirePOWER module
![]() debug sfr message: Used to display hardware messages between the Cisco ASA and the module
debug sfr message: Used to display hardware messages between the Cisco ASA and the module
Example 4-18 shows the output of the debug sfr event command.
Example 4-18 Debugging Module Events
ASA-1# debug sfr event
debug sfr event enabled at level 1
ASA-1# debug sfr event
DP SFR Event: Sending Conn Unique ID (3790083) TLV for 192.168.78.2/123 -
184.105.192.247/123
DP SFR Event: Sending Conn Unique ID (3790084) TLV for 192.168.78.138/59782 -
204.141.57.101/443
DP SFR Event: Sending Conn Unique ID (3790085) TLV for 192.168.78.132/27646 -
208.67.222.222/53
DP SFR Event: Sending Conn Unique ID (3790086) TLV for 192.168.78.132/49148 -
173.194.206.95/443
DP SFR Event: Sending Conn Unique ID (3790089) TLV for 192.168.78.132/12363 -
208.67.222.222/53
DP SFR Event: Sending Conn Unique ID (3790090) TLV for 192.168.78.132/37421 -
74.125.228.243/443
DP SFR Event: Sending Conn Unique ID (3790093) TLV for 192.168.78.135/777 -
8.8.8.8/0
<output omitted for brevity>
Summary
In this chapter, you have learned about several commands and utilities that are useful when troubleshooting problems in the Cisco ASA FirePOWER module. These commands are also useful when you’re troubleshooting problem in FTD software. You have learned how to perform basic monitoring, and you have learned how to use expert-level commands to view and analyze detailed logs in the module. You have also learned how to generate detailed troubleshooting files in the CLI and in ASDM. You have also learned about the available debugging commands in the ASA for troubleshooting problems in the module.