
Chapter 5. Introduction to and Architecture of Cisco AMP
This chapter covers the following topics:
![]() The architecture, components, and types of AMP
The architecture, components, and types of AMP
![]() The AMP public cloud architecture
The AMP public cloud architecture
![]() The AMP private cloud architecture
The AMP private cloud architecture
![]() AMP private cloud air gap mode
AMP private cloud air gap mode
This chapter provides an introduction to the Cisco Advanced Malware Protection (AMP) solution, the AMP architecture, and AMP cloud types.
Introduction to Advanced Malware Protection (AMP)
In Chapter 1, “Fundamentals of Cisco Next-Generation Security,” you learned about the different Cisco next-generation security products and technologies. You learned that those security technologies and processes should not only focus on detection but also should provide the capability to mitigate the impact of an attack. Organizations must maintain visibility and control across the extended network during the full attack continuum:
![]() Before an attack takes place
Before an attack takes place
![]() During an active attack
During an active attack
![]() After an attacker starts to damage systems or steal information
After an attacker starts to damage systems or steal information
In Chapter 1 you also learned about the many different types of malicious software (malware). The AMP solution enables you to detect and block malware, continuously analyze for malware, and get retrospective alerts. It has the following features:
![]() File reputation: AMP allows you to analyze files inline and block or apply policies.
File reputation: AMP allows you to analyze files inline and block or apply policies.
![]() File sandboxing: AMP allows you to analyze unknown files to understand true file behavior.
File sandboxing: AMP allows you to analyze unknown files to understand true file behavior.
![]() File retrospection: AMP allows you to continue to analyze files for changing threat levels.
File retrospection: AMP allows you to continue to analyze files for changing threat levels.
There are major architectural benefits to the AMP solution, which leverages a cloud infrastructure for the heavy lifting.
The architecture of AMP can be broken down into three main components: the AMP cloud, AMP client connectors, and intelligence sources. AMP client connectors include AMP for Networks, AMP for Endpoints, and AMP for Content Security.
Figure 5-1 illustrates the cloud architecture, showing how AMP receives intelligence from many sources and a variety of client connectors.

The AMP cloud contains many different analysis tools and technologies to detect malware in files, including the Threat Grid analysis solution. Cisco’s research teams, including the Cisco Talos security intelligence and research group, feed information about malware into the AMP cloud. Threat intelligence from Cisco products, services, and third-party relationships is also sent to the AMP cloud. The following are some examples:
![]() Snort, ClamAV, and Immunet AV open source communities: Users of these open source projects contribute threat information daily.
Snort, ClamAV, and Immunet AV open source communities: Users of these open source projects contribute threat information daily.
![]() Talos: The Cisco Talos security intelligence and research group is a team of leading threat researchers that contributes to the threat information ecosystem of Cisco security products. Talos team members get threat information from a variety of sources and their own internal research efforts. Talos maintains the official rule sets of Snort.org, ClamAV, SenderBase.org, and SpamCop. Talos is also the primary team that contributes to the Cisco Collective Security Intelligence (CSI) ecosystem. You can follow Talos on Twitter @talos and subscribe to the official Talos blog at http://blogs.cisco.com/author/talos.
Talos: The Cisco Talos security intelligence and research group is a team of leading threat researchers that contributes to the threat information ecosystem of Cisco security products. Talos team members get threat information from a variety of sources and their own internal research efforts. Talos maintains the official rule sets of Snort.org, ClamAV, SenderBase.org, and SpamCop. Talos is also the primary team that contributes to the Cisco Collective Security Intelligence (CSI) ecosystem. You can follow Talos on Twitter @talos and subscribe to the official Talos blog at http://blogs.cisco.com/author/talos.
![]() Threat Grid: This deep threat analysis solution leverages many identification techniques, including sandboxing. Threat Grid is built as a cloud architecture and is used to do deep analysis of file samples submitted to the AMP Threat Grid cloud. The analysis results are fed into the AMP cloud and can be used to update file disposition (the result).
Threat Grid: This deep threat analysis solution leverages many identification techniques, including sandboxing. Threat Grid is built as a cloud architecture and is used to do deep analysis of file samples submitted to the AMP Threat Grid cloud. The analysis results are fed into the AMP cloud and can be used to update file disposition (the result).
![]() Over 100 TB of threat intelligence data daily: A variety of sources contribute to the vast amount of data provided to Cisco through submitted malware samples, data from the web, and email traffic monitored by Cisco products and other third-party sources.
Over 100 TB of threat intelligence data daily: A variety of sources contribute to the vast amount of data provided to Cisco through submitted malware samples, data from the web, and email traffic monitored by Cisco products and other third-party sources.
![]() 1.6 million global sensors: Cisco has programs designed to foster cooperation and information sharing of threat intelligence data. Cisco therefore has access to data from more than 1.6 million sensors worldwide.
1.6 million global sensors: Cisco has programs designed to foster cooperation and information sharing of threat intelligence data. Cisco therefore has access to data from more than 1.6 million sensors worldwide.
![]() Advanced Microsoft and industry disclosures: Cisco has cooperative relationships with many industry-leading vendors of software products that yield advanced information about vulnerabilities and threats. AMP customers benefit from access to the vast amount of information gathered by Cisco through quick release of signature updates and threat protection.
Advanced Microsoft and industry disclosures: Cisco has cooperative relationships with many industry-leading vendors of software products that yield advanced information about vulnerabilities and threats. AMP customers benefit from access to the vast amount of information gathered by Cisco through quick release of signature updates and threat protection.
Role of the AMP Cloud
The most critical item of the Cisco AMP architecture is the AMP cloud itself. The AMP cloud has two deployment methods—public and private—and regardless of the deployment chosen, the role of the cloud is the same.
The AMP cloud houses all the detection signatures. A major benefit of storing these signatures in the cloud is that it reduces the client connector size and reduces the processing requirements on the client, since the bulk of the work is handled in the cloud.
An interesting and fairly unique feature is that AMP administrators can create custom signatures in the cloud, and then those custom signatures are pushed to the connectors. In addition, the cross-referencing of files and signatures is done in the AMP cloud, so the cloud can be self-updating, without having to constantly communicate updates to the connectors.
The AMP cloud is also responsible for large-scale data processing, or big data. The data comes to the AMP cloud from multiple sources, including honeypots, threat feeds, open source communities, AV solutions such as Immunet AV and ClamAV, and more. File samples are provided to the AMP cloud, where they are processed. If the disposition of a sample file is deemed to be malicious, it is stored in the cloud and reported to the client connectors that see the same file.
Note
AMP customer data is never shared with any other entity.
Advanced analytic engines, including Threat Grid, are part of the AMP cloud and are constantly correlating the incoming data. The analytical results are used to update the AMP signatures. In addition to the advanced analytics, machine-learning engines are employed to further refine signatures and reevaluate detections that have already been performed. The cloud is not just a repository of signatures; the decision making is performed in real time, evolving constantly based on the data received.
Doing Security Differently
There is this brilliant engineer from Cisco SourceFire named Eric Howard. Eric is one of the world’s foremost experts in AMP, and he presents security, particularly the AMP solution, in a unique way that brings tremendous clarity. This section of the book is designed to mirror his presentation style.
Eric talks about the need to “do security differently.” He says that companies need two security plans: Security Plan A is prevention, and Security Plan B is retrospection.
The Prevention Framework
Prevention involves keeping malware at bay. With prevention, speed is critical. It requires real-time, dynamic decisions to be made from real-world data. The data must have high accuracy, with low false positives and false negatives. Prevention could also be viewed as the “security control mode.”
As illustrated in Figure 5-2, the AMP cloud’s prevention framework is made up of seven core components: 1-to-1 signatures, Ethos, Spero, indicators of compromise (IOCs), device flow correlation, advanced analytics, and dynamic analysis.

1-to-1 Signatures
1-to-1 signatures are a traditional technology that is used all over the security industry in various forms. With these signatures, a hash is created of a file, and that hash is compared to a database. If a match is found, the specific file is known, and a verdict—clean or malicious—is returned. If the hash has not been seen before, the cloud returns a verdict of unknown. The benefit of this method is that it can quickly identify and block malicious files. The downside is that a simple change to a file also changes the hash, thereby evading the signature.
AMP differentiates itself from other 1-to-1 signature solutions by storing the signature database in the cloud instead of on the client. The database is quite large, and many solutions cut corners by including only a subset of the signatures in the full database. Storing the database in the cloud allows AMP to leverage the entire database. Comparing the files to the database can be quite resource intensive. AMP does the comparison in the cloud, freeing those resources from the client connector. AMP is also able to collect, process, and detect in near real time.
Ethos Engine
The next component of the protection framework is the Ethos engine. Ethos is a “fuzzy fingerprinting” engine that uses static or passive heuristics. The engine creates generic file signatures that can match polymorphic variants of a threat. This is useful because when a threat morphs or a file is changed, the structural properties of that file often remain the same, even though the content has changed.
Unlike most other signature tools, Ethos uses distributed data mining to identify suitable files. It uses in-field data for sources, which provides a highly relevant collection from which to generate the signatures. Ethos is completely automated and provides rapid generation of the generic signatures that are based on in-field data instead of relying on individual “rockstar” engineers to generate a limited number of generic signatures.
Note
At this writing, Ethos applies only to AMP for Endpoints.
Spero Engine
Spero is a machine learning–based technology that proactively identifies threats that were previously unknown. It uses active heuristics to gather execution attributes, and because the underlying algorithms come up with generic models, it can identify malicious software based on its general appearance rather than based on specific patterns or signatures.
Indicators of Compromise
If you look up “indicator of compromise” on Wikipedia (http://en.wikipedia.org/wiki/Indicator_of_compromise), this is what you see: “an artifact observed on a network or in an operating system that with high confidence indicates a computer intrusion.”
There may be artifacts left on a system after an intrusion or a breach, and they can be expressed in a language that describes the threat information, known as indicators of compromise (IOCs). The sets of information describe how and where to detect the signs of the intrusion or breach. IOCs can be host-based and/or network-based artifacts, but the scan actions are carried out on the host only.
IOCs are very high-confidence indicators, and they may describe numerous specific items, including FileItem, RegistryItem, EventLogItem, ProcessItem, and ServiceItem. You can lean the IOC language in more detail at http://www.openioc.org.
Figure 5-3 shows an example of an IOC.

Device Flow Correlation
Device flow correlation provides a kernel-level view into network I/O. It allows for blocking or alerting on network activity, traced back to the initiating process itself. It enables internal and external networks to be monitored, leverages IP reputation data, and offers URL/domain logging. The flow points are extra telemetry data and are not file disposition specific.
Cisco provides intelligence on many malicious destinations, including generic command and control (CnC) servers, phishing hosts, zero-access CnC servers, and more.
Advanced Analytics
Advanced analytics consists of a set of multifaceted engines that provide big data context beyond a single host and beyond a single file. Advanced analytics highlights files executed in an environment, from least common to most. This can aid in identifying previously undetected threats that may have only been seen by a small number of users.
Dynamic Analysis with Threat Grid
Cisco AMP Threat Grid is not a single tool. It is a full solution for dynamic malware analysis and threat intelligence. It performs high-speed, automated analysis with adjustable runtimes while not exposing any tags or other indicators that malware could use to detect that it is being observed.
Threat Grid provides video playbacks, a glovebox for malware interaction and operational troubleshooting, a process graph for visual representation of process lineage, and a threat score with behavior indicators.
It searches and correlates all data elements of a single sample against billions of sample artifacts collected and analyzed over years, leveraging global and historic context. This enables an analyst to better understand the relevancy of a questionable sample as it pertains to the analyst’s own environment.
Threat Grid was architected from the ground up as a cloud solution with an API designed to integrate with existing IT security solutions and to create custom threat intelligence feeds. It can automatically receive submissions from other solutions and pull the results into your environment.
Many think that Threat Grid is a sandboxing solution. It is much more than just that, however; sandboxing is a piece of the solution, and Threat Grid’s sandboxing functions are performed in a way that evades detection by malware. Threat Grid uses an outside-in approach, with no presence in the virtual machine. The sandboxing’s dynamic analysis includes an external kernel monitor, dynamic disk analysis that illuminates any modifications to the physical disk (such as the master boot record), monitoring user interaction, video capture and playback, process information, artifacts, and network traffic.
Threat Grid supports the following samples and object types:
![]() Executable files (.EXE) and libraries (.DLL)
Executable files (.EXE) and libraries (.DLL)
![]() Java archives (.JAR)
Java archives (.JAR)
![]() Portable document format (.PDF)
Portable document format (.PDF)
![]() Office documents (.RTF, .DOC, .DOCX, .XLS, .XLSX, .PPT, .PPTX)
Office documents (.RTF, .DOC, .DOCX, .XLS, .XLSX, .PPT, .PPTX)
![]() ZIP containers (.ZIP)
ZIP containers (.ZIP)
![]() Quarantine containers
Quarantine containers
![]() URLs
URLs
![]() HTML documents
HTML documents
![]() Flash
Flash
Note
At this writing, Threat Grid is a key part of the Cisco AMP cloud, but it is not yet available as part of the private cloud (local/onsite) offering.
The Retrospective Framework
Retrospection means taking a look at what has already transpired; it involves tracking system behavior regardless of disposition, focusing on uncovering malicious activity. Retrospection could be viewed as the “incident response mode,” using continuous analysis to reactively act on a file that was assigned a clean disposition once but was later found to have a bad disposition.
The retrospective framework is designed to show the trajectory of a malicious file, with a goal of 30 days of telemetry data, as illustrated in Figure 5-4. Even files that are originally given a clean verdict are tracked, and if a clean file is later found to be malicious, all connectors that have seen the file are notified to quarantine the file retrospectively.

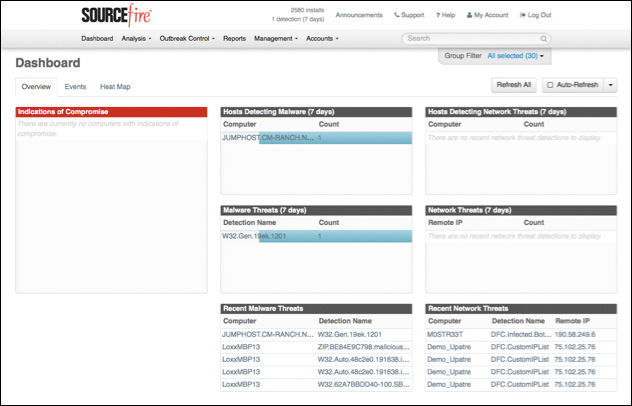
The Cloud
As you will see throughout this book, the AMP cloud is the centralized location for all management and reporting. Figure 5-5 shows an example of an AMP cloud dashboard. The dashboard shows indicators of compromise and allows you to drill into them.
From the dashboard, you can provision endpoints, download agents, run reports, and more.
Private Cloud
The AMP cloud is available in a private version. Administrators can run their own private cloud with many of the features from the public cloud, but not all. With the private offering, you may choose to host all components within your own data center or perhaps in another cloud environment, like Cisco’s InterCloud or Amazon Web Services (AWS).
The option to host the AMP cloud in your own data center is often selected by organizations that reside outside the United States and have very strict controls on where data may reside. In addition, some organizations, such as government agencies, have requirements for data storage being on premises.
The private cloud product is shipped as a virtual machine that you can run in your own VMware environment. The private cloud may be operated in two ways: in cloud proxy mode and in air gap mode.
Note
At this writing, the private cloud is available only for AMP for Endpoints and AMP for Networks. In addition, support of Threat Grid with the private cloud is planned but not yet available.
Cloud Proxy Mode
Cloud proxy mode operates the private cloud within the confines of your own data center or other cloud infrastructure. The AMP for Networks and AMP for Endpoints connectors all communicate to the private cloud. However, the private cloud maintains a connection to the public cloud for certain communications:
![]() File disposition checks: File disposition is still determined by the public cloud. The file hashes are passed on to the public cloud over an SSL session using TCP port 443 or TCP port 32137. The public cloud is known as the upstream server, and the FQDN that you connect to is cloud-pc.amp.sourcefire.com.
File disposition checks: File disposition is still determined by the public cloud. The file hashes are passed on to the public cloud over an SSL session using TCP port 443 or TCP port 32137. The public cloud is known as the upstream server, and the FQDN that you connect to is cloud-pc.amp.sourcefire.com.
![]() Product updates: The AMP private cloud can be configured for automatic or manual updates, leveraging a yum repository named packages.amp.sourcefire.com that uses an SSL session over TCP port 443.
Product updates: The AMP private cloud can be configured for automatic or manual updates, leveraging a yum repository named packages.amp.sourcefire.com that uses an SSL session over TCP port 443.
![]() Support: Cisco TAC is able to remotely access the device for diagnostic purposes and customer assistance. The remote access uses SSH over TCP port 443.
Support: Cisco TAC is able to remotely access the device for diagnostic purposes and customer assistance. The remote access uses SSH over TCP port 443.
Figure 5-6 illustrates the cloud proxy mode.

Air Gap Mode
As its name indicates, air gap mode creates a private cloud instance that is completely isolated and has no external access to the public cloud. Updates must be completed manually, and remote support is challenging. However, this mode provides the highest levels of confidentiality. Figure 5-7 illustrates air gap mode.

Installing the Cisco AMP Private Cloud
The AMP private cloud is available as an Open Virtualization Archive (.ova) format file, for import into a VMware virtual environment. At this writing, the only supported virtual environment for the private cloud is VMware ESX 5 or newer. Unofficially, however, the virtual appliance works on VMware Fusion and VMware Workstation, though this is unsupported.
Installing the private cloud in air gap mode requires more resources than the cloud proxy mode installation. These are the minimum requirements:
![]() Cloud proxy mode: 32 GB RAM, 8 CPUs, 238 GB minimum free disk space
Cloud proxy mode: 32 GB RAM, 8 CPUs, 238 GB minimum free disk space
![]() Air gap mode: 128 GB RAM, 8 CPUs, 1 TB minimum free disk space
Air gap mode: 128 GB RAM, 8 CPUs, 1 TB minimum free disk space
After you deploy the OVA template, you connect to the console of the VM in order to configure the private cloud, as shown in Figure 5-8. You need to configure the network so the private cloud configuration can be completed through its web interface.

DHCP is required if you will be installing in demo mode, while a static IP address and external DNS servers are required for a production install. You need to click No and provide valid IP stack information, as shown in Figures 5-9 and 5-10.


You then click Yes to apply the changes to the interface, as shown in Figure 5-11. The main menu returns, with a randomized password that you use to administer the private cloud through the web interface, as shown in Figure 5-12.


Connect to your private cloud with a web browser using HTTPS, as shown in Figure 5-13, and log in with a random password such as the one displayed in Figure 5-12.

Once you have successfully logged in, you are prompted to change the one-time password that the system generated, as shown in Figure 5-14, and then you have to accept the license agreement, shown in Figure 5-15. If you step away from the browser for an extended period of time, it times out, and you need to log in with the newly set password of your choosing instead of the one-time system-generated password.


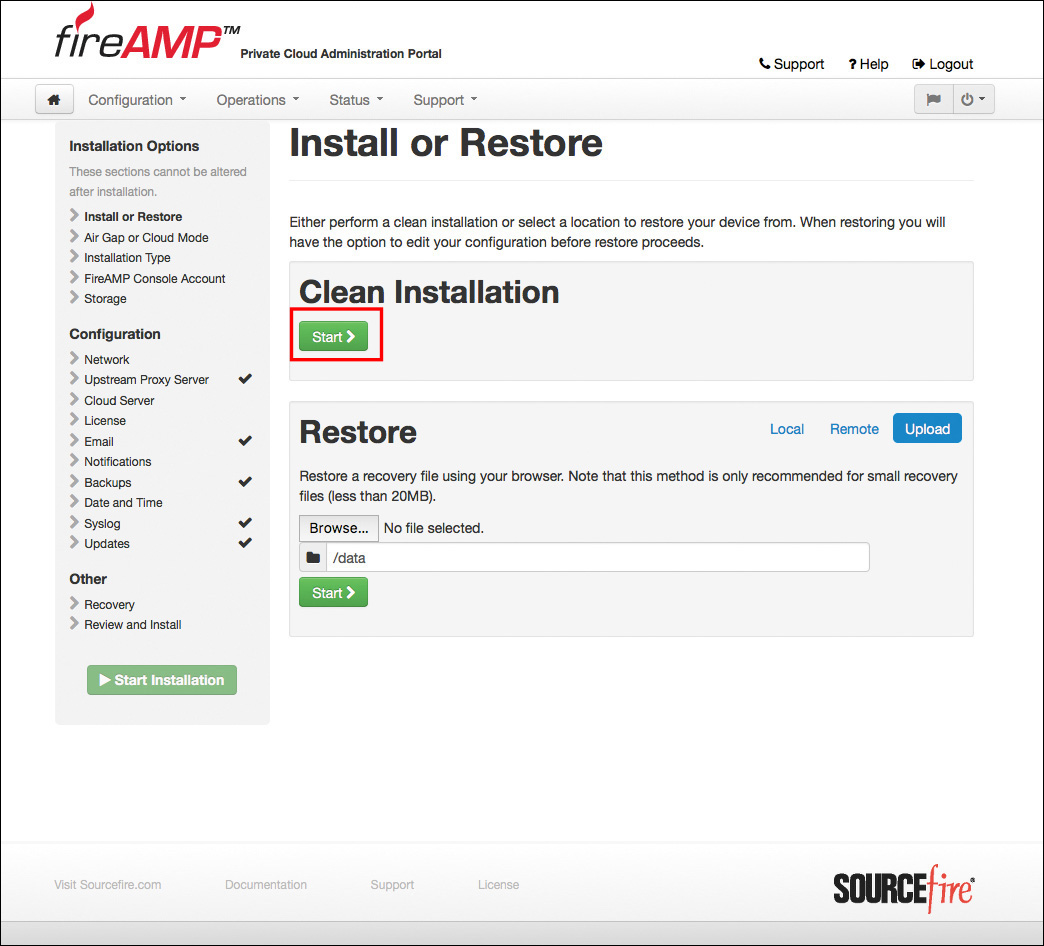
At this point, you can restore a previously backed up private cloud or proceed with a clean installation. To install a new private cloud, you click Start for a clean installation, as shown in Figure 5-16.
You are now prompted to choose between air gap and cloud proxy mode, as shown in Figure 5-17. Cloud proxy mode requires an Internet connection to send disposition queries to the public cloud and to receive content updates as well as software updates, as described earlier in this chapter.

Next, you choose the installation type. In this case, you can choose demo mode, which requires DHCP to be used rather than a static IP address. Demo mode also skips some of the installation requirements, so it can be installed on a laptop or other smaller VM host.
In order to see all the installation options, you click Next under Production, as shown in Figure 5-18.

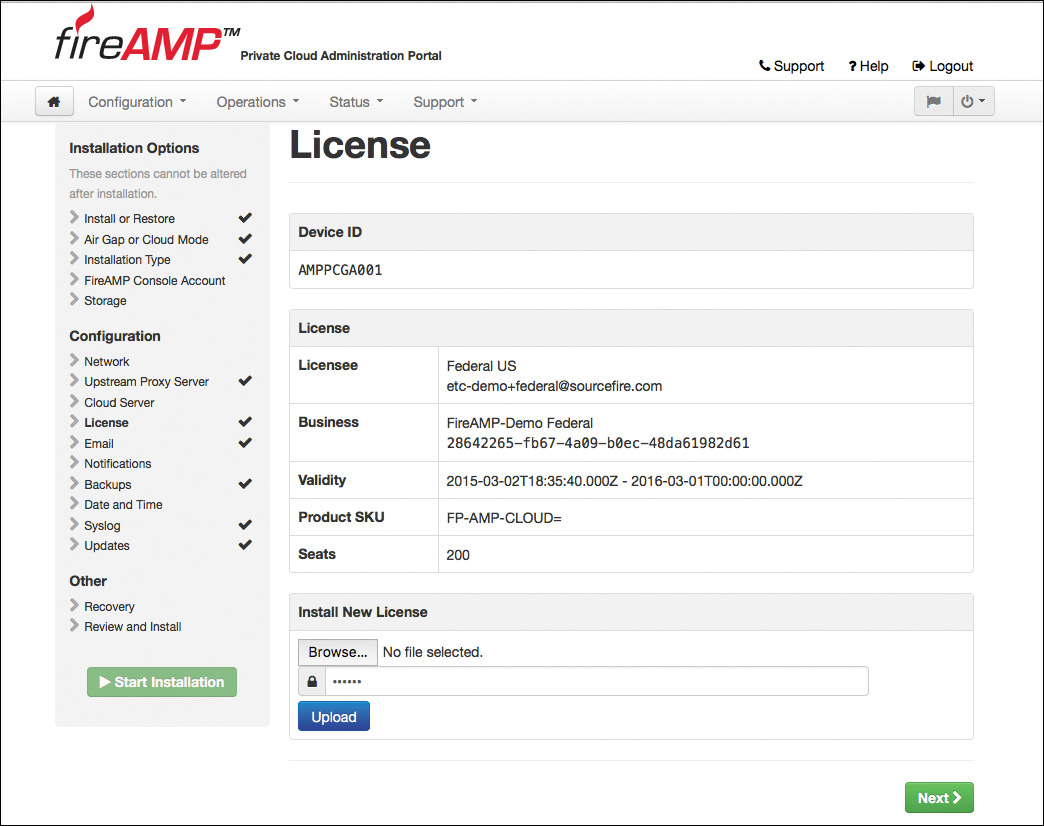
For a production installation, a license file is required. Click Browse to locate the license file, enter the passphrase to decrypt the key, and then click Upload, as shown in Figure 5-19. The license is then installed.
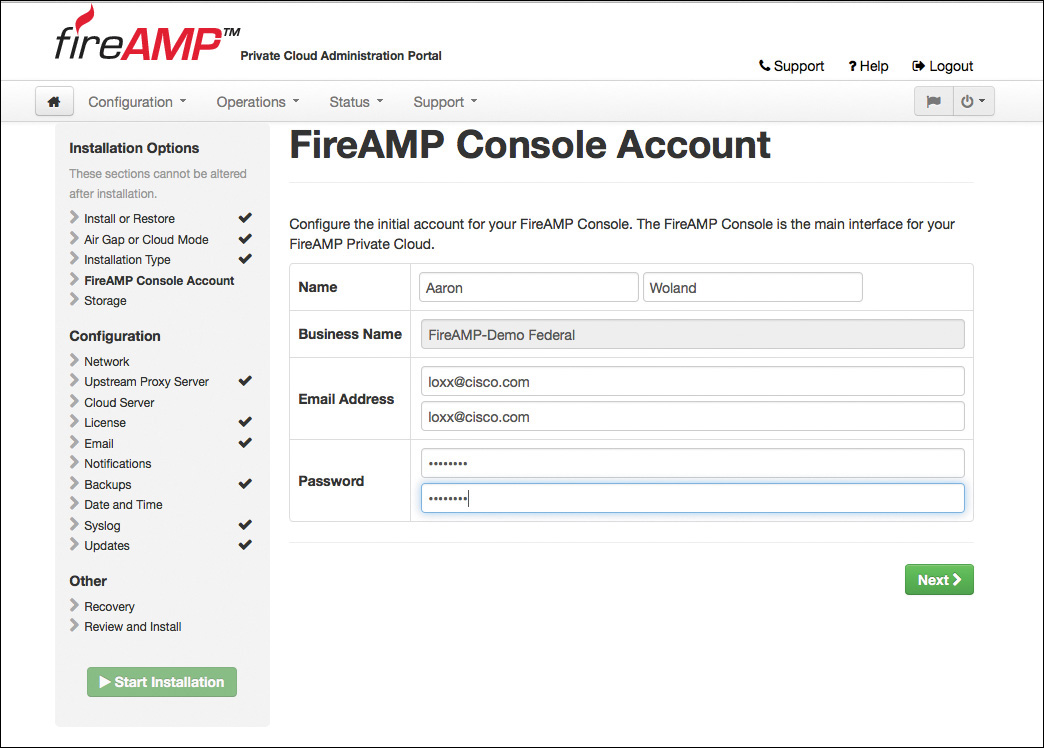
Next, you are asked to create a console account, which you use to initially log into the cloud, create additional accounts, and set up groups. Create your console account and password and click Next, as shown in Figure 5-20.
After creating the console account, you see a summary screen for your storage capabilities. There are two main tabs: Automatic Configuration and Manual Configuration. The automatic configuration adjusts partition sizes based on the number of connectors that you configure the cloud for and the number of days of history that you wish to retain. Figure 5-21 shows the automatic configuration screen. With this mode, you simply state the number of connectors to plan for and the number of days to store the data. The connectors are the endpoints or network AMP devices that will be using this private cloud. Warnings appear for any misconfigurations where not enough storage is available.

As shown in Figure 5-22, the manual configuration gives you more control, and you can determine how much space to allocate for each of the collections (archives, default, documents, executables, events, and DFC). Again, warnings appear for any misconfigurations where not enough storage is available.

Note
If you manually misconfigure the file system and the database grows too large for the disk partition, you will need to do a full backup, reinstallation, and restoration in order to change the partition sizes. Therefore, it is recommended that you use the automatic option.
The next screen is the Network Configuration page. The top half of the screen is fairly self-explanatory. Here you see the administrative portal being hosted on the interface (eth0) and the IP address that you configured at the command line. What is new here is that the second interface (eth1) needs to be configured. The eth1 interface is known as the production interface and is used to connect to the Internet for updates, communication with the public cloud, and communication with all the connectors (endpoints and network AMP systems).
Figure 5-23 shows the VMware configuration, where you can see two network adapters. Both NICs can be on the same network segment, as shown in Figure 5-23. They do not have to be in the same VLAN, but they can be. Figure 5-24 shows the top half of the network configuration page, with both eth0 and eth1 configurations displayed.


With the eth1 configuration complete, you come to a rather confusing part of the setup. You need to enter two required fully qualified domain names (FQDNs) and one optional one. What confuses people with this portion of the setup is that the FireAMP Console FQDN, the Cloud Server FQDN, and the Defense Center FQDN are all referring to exactly the same host—the host that you are currently configuring. That’s right: You need to have two or three entries in DNS that all point to the IP address configured for the eth1 interface, as shown for the DNS server displayed in Figure 5-25.

You need to enter these FQDNs into the corresponding fields of the configuration screen, as shown in Figure 5-26. When you are sure that the names exist correctly in both the DNS server and the configuration screen, click Next (Applies Configuration) to move on.

Note
The endpoints and the private cloud need the ability to resolve these DNS names. If the endpoints cannot resolve these names, they will fail to register to the cloud.
When the network configuration is complete, the next step is to select which upstream cloud should be used, along with the port and security settings related to that cloud connection, as shown in Figure 5-27.

The upstream server selection can be either the North American cloud, the European cloud, or a custom cloud name, as shown in Figure 5-28.

Note
The custom server is not used in the majority of deployments because it is designed for multitiered private cloud deployments, which are rare.
There are no geographical requirements for the upstream public cloud infrastructure. The cloud server selection that you make should be based on latency: Choose the one with the lowest latency. The next drop-down is the protocol selection: either SSL (TCP port 443) or TCP (port 32137). Cisco best practice is to use TCP port 32137 because the communication is already encrypted and the SSL port adds additional overhead and uses more bandwidth. Figure 5-29 shows the drop-down choices.
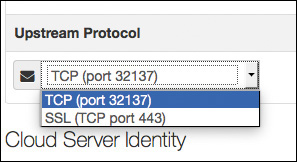
The cloud server identity section shown in Figure 5-27 and Figure 5-29 lists this AMP cloud server’s unique identity and the certificates that represent this cloud server’s identity for any downstream private clouds.
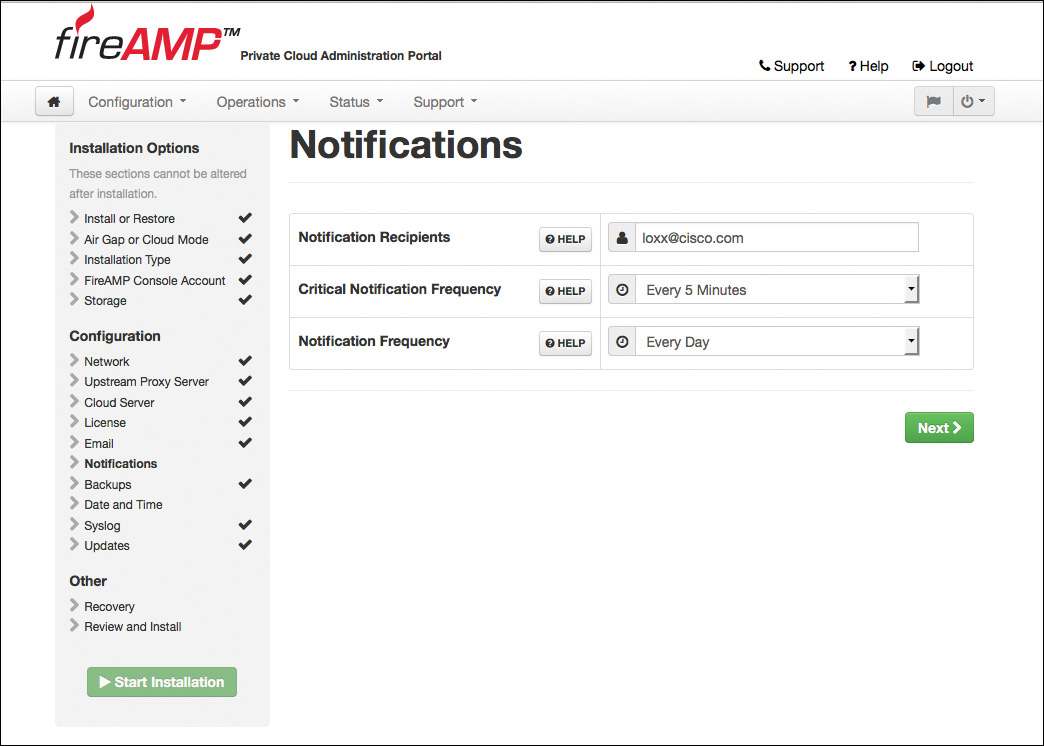
Click Next to move on from the cloud server configuration and set up a recipient or recipients of administrative email notifications, as shown in Figure 5-30. The emails may contain notices of low disk space, backup success or failure, failed sanity checks, and more items of this nature.
Date and time configuration is next. Network Time Protocol (NTP) plays a critical role in all network security solutions, ensuring time accuracy and synchronization. It ensures that log entries will always be accurate and provide valid, useful reports. All events are stored in UTC time, so selecting a time zone is not necessary. The time zone will be adjusted upon display to the console UI, so the admin is not stuck working in UTC. Figure 5-31 shows the date and time configuration screen.

NTP updates occur through the public interface (eth1), allowing you to choose an NTP source on the public Internet, if that is preferred.
The next screen is for a recovery file. A recovery file is like a backup, and it contains all the cloud configuration and the server keys shown in Figure 5-27. You should store the recovery file in a very safe location because if you lose the recovery key, you will never be able to restore your configuration. In addition, every one of your FireAMP connectors will need to be reinstalled. In other words, without the original key, you have to reinstall the private cloud infrastructure with all new keys.
To complete this step, simply download the backup file through your browser by clicking the blue Download button (see Figure 5-32) and save the pre-install-backup.tgz file to your local disk. Then upload it right back to the server by clicking the Browse button on the same page. You can click Next and proceed with the installation after the file is validated.

Finally, you see the Review and Install screen, as shown in Figure 5-33. This is your last chance to review all the configuration options before you install. When you are certain you have selected all the correct options, click Start Installation, and the installation proceeds, with a status screen like the one shown in Figure 5-34.

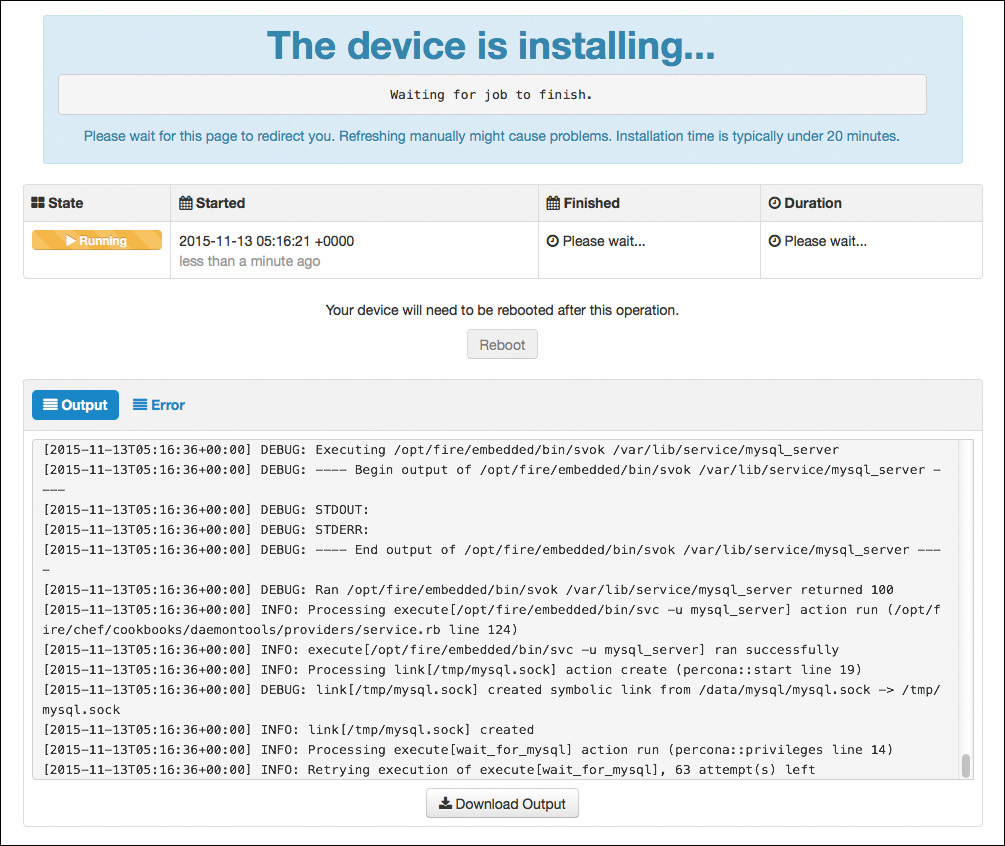
As the screen warns, you should leave your browser on the page and not try to refresh it manually. As the installation finishes, it sends an email notification like the one shown in Figure 5-35.

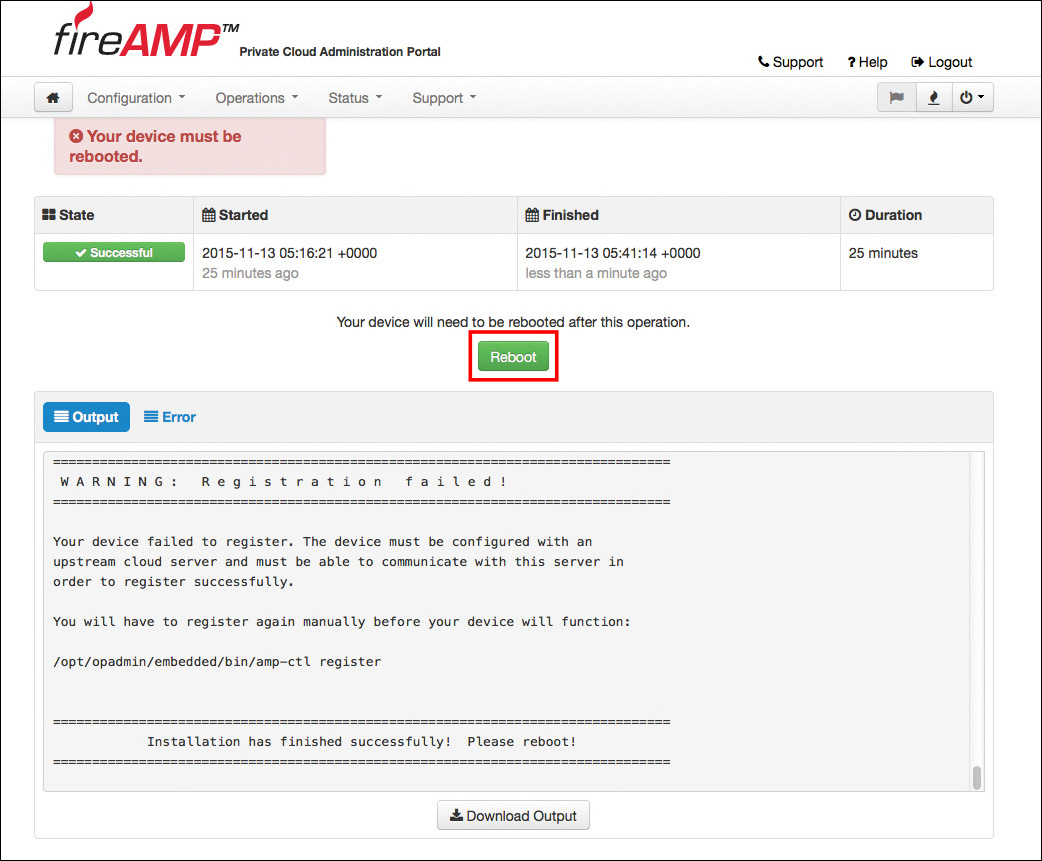
When the installation is complete, the Reboot button becomes active (see Figure 5-36). Click Reboot when the process finishes to reboot the appliance, and the server reboots and displays the message shown in Figure 5-37.

After the appliance reboots, the web interface for the administrative interface (eth0) that you were using to configure the appliance displays key metrics like those shown in Figure 5-38.

Now you can connect to the web interface for the eth1 interface by connecting to the console FQDN that you configured, as shown in Figure 5-39. You log in using the console account you created during the setup process.

The subscription agreement is displayed next. Scroll to the bottom and select the check box, as shown in Figure 5-40, and click Continue.

After logging in, you are presented with a setup wizard to configure your first policies for Windows or Mac AMP connectors. The endpoint policies are examined in more detail in Chapter 8, “Cisco AMP for Endpoints.”
Summary
In this chapter you have learned all about the role of the AMP cloud for performing file disposition checks. You have learned about the intelligence that feeds the AMP cloud and the AMP view of security as including a prevention framework and a retrospection framework. You have learned about public and private clouds and seen how to complete an installation of a private cloud instance.