Chapter 7. Kubernetes Power Tools
My mechanic told me, “I couldn’t repair your brakes, so I made your horn louder.”
Steven Wright
People always ask us, “What about all these Kubernetes tools? Do I need them? If so, which ones? And what do they all do?”
In this chapter, we’ll explore a small part of the landscape of tools and utilities that help you work with Kubernetes. We’ll show you some advanced techniques with kubectl, and a few useful utilities such as jq, kubectx, kubens, kube-ps1, kube-shell, Click, kubed-sh, Stern, and BusyBox.
Mastering kubectl
We’ve already met kubectl, starting in Chapter 2, and as it’s the primary tool for interacting with Kubernetes, you may already be comfortable with the basics. Let’s look at some more advanced features of kubectl now, including some tips and tricks that may be new to you.
Shell Aliases
One of the first things that most Kubernetes users do to make their life easier is to create a shell alias for the kubectl command. For example, we have the following alias set up in our .bash_profile files:
aliask=kubectl
Now instead of having to type out kubectl in full for every command, we can just use k:
k get podsIf there are some kubectl commands that you use a lot, you might like to create aliases for them too. Here are some possible examples:
aliaskg=kubectlgetaliaskgdep=kubectlgetdeploymentaliasksys=kubectl--namespace=kube-systemaliaskd=kubectldescribe
Google engineer Ahmet Alp Balkan has worked out a logical system of aliases like these, and created a script to generate them all for you (currently around 800 aliases):
You don’t have to use those, though; we suggest you start with k, and add aliases that are memorable to you, for the commands you use most frequently.
Using Short Flags
Like most command-line tools, kubectl supports abbreviated forms of many of its flags and switches. This can save you a lot of typing.
For example, you can abbreviate the --namespace flag to just -n (see “Using Namespaces”):
kubectl get pods -n kube-systemIt’s very common to have kubectl operate on resources matching a set of labels, with the --selector flag (see “Labels”). Fortunately, this can be shortened to -l (labels):
kubectl get pods -l environment=stagingAbbreviating Resource Types
A common use for kubectl is to list resources of various types, such as Pods, Deployments, Services, and namespaces. The usual way to do this is to use kubectl get followed by, for example, deployments.
To speed this up, kubectl supports short forms of these resource types:
kubectl get pokubectl get deploykubectl get svckubectl get ns
Other useful abbreviations include no for nodes, cm for configmaps, sa for serviceaccounts, ds for daemonsets, and pv for persistentvolumes.
Auto-Completing kubectl Commands
If you’re using the bash or zsh shells, you can have them auto-complete kubectl commands. Run this command to see instructions on how to enable auto-completion for your shell:
kubectl completion -hFollow the instructions, and you should be able to press Tab to complete partial kubectl commands. Try it now:
kubectl cl<TAB>The command should complete to kubectl cluster-info.
If you type just kubectl and hit Tab twice, you’ll see all the commands available:
kubectl <TAB><TAB>alpha attach cluster-info cordon describe ...
You can use the same technique to list all the flags that you can use with the current command:
kubectl get pods --<TAB><TAB>--all-namespaces --cluster= --label-columns= ...
Usefully, kubectl will also auto-complete the names of Pods, Deployments, namespaces, and so on:
kubectl -n kube-system describe pod <TAB><TAB>event-exporter-v0.1.9-85bb4fd64d-2zjngkube-dns-autoscaler-79b4b844b9-2wglcfluentd-gcp-scaler-7c5db745fc-h7ntr...
Getting Help
The best command-line tools include thorough documentation, and kubectl is no exception. You can get a complete overview of the available commands with kubectl -h:
kubectl -hYou can go further and get detailed documentation on each command, with all the available options, and a set of examples, by typing kubectl COMMAND -h:
kubectl get -hGetting Help on Kubernetes Resources
As well as documenting itself, kubectl can also give you help on Kubernetes objects, such as Deployments or Pods. The kubectl explain command will show documentation on the specified type of resource:
kubectl explain podsYou can get further information on a specific field of a resource, with kubectl explain RESOURCE.FIELD. In fact, you can drill down as far as you like with explain:
kubectl explain deploy.spec.template.spec.containers.livenessProbe.execAlternatively, try kubectl explain --recursive, which shows fields within fields within fields… just be careful you don’t get dizzy!
Showing More Detailed Output
You already know that kubectl get will list resources of various types, such as Pods:
kubectl get podsNAME READY STATUS RESTARTS AGEdemo-54f4458547-pqdxn 1/1 Running 6 5d
You can see extra information, such as the node each Pod is running on, by using the -o wide flag:
kubectl get pods -o wideNAME ... IP NODEdemo-54f4458547-pqdxn ... 10.76.1.88 gke-k8s-cluster-1-n1-standard...
(We’ve omitted the information that you see without -o wide, just for reasons of space.)
Depending on the resource type, -o wide will show you different information. For example, with nodes:
kubectl get nodes -o wideNAME ... EXTERNAL-IP OS-IMAGE KERNEL-VERSIONgke-k8s-...8l6n ... 35.233.136.194 Container... 4.14.22+gke-k8s-...dwtv ... 35.227.162.224 Container... 4.14.22+gke-k8s-...67ch ... 35.233.212.49 Container... 4.14.22+
Working with JSON Data and jq
The default output format for kubectl get is plain text, but it can also print information in JSON format:
kubectl get pods -n kube-system -o json{"apiVersion": "v1","items": [{"apiVersion": "v1","kind": "Pod","metadata": {"creationTimestamp": "2018-05-21T18:24:54Z",...
Not surprisingly, this produces a lot of output (about 5,000 lines on our cluster). Fortunately, because the output is in the widely used JSON format, you can use other tools to filter it, such as the invaluable jq.
If you don’t have jq already, install it in the usual way for your system (brew install jq for macOS, apt install jq for Debian/Ubuntu, and so on).
Once you’ve got jq installed, you can use it to query and filter kubectl output:
kubectl get pods -n kube-system -o json | jq '.items[].metadata.name'"event-exporter-v0.1.9-85bb4fd64d-2zjng""fluentd-gcp-scaler-7c5db745fc-h7ntr""fluentd-gcp-v3.0.0-5m627""fluentd-gcp-v3.0.0-h5fjg"...
jq is a very powerful tool for querying and transforming JSON data.
For example, to list your busiest nodes, by the number of Pods running on each:
kubectl get pods -o json --all-namespaces | jq '.items |group_by(.spec.nodeName) | map({"nodeName": .[0].spec.nodeName,"count": length}) | sort_by(.count) | reverse'
There’s a handy online playground for jq where you can paste in JSON data and try out different jq queries to get the exact result you want.
If you don’t have access to jq, kubectl also supports JSONPath queries. JSONPath is a JSON query language that isn’t quite as powerful as jq, but useful for quick one-liners:
kubectl get pods -o=jsonpath={.items[0].metadata.name}
demo-66ddf956b9-pnknx
Watching Objects
When you’re waiting for a bunch of Pods to start up, it can be annoying to have to keep typing kubectl get pods... every few seconds to see if anything’s happened.
kubectl provides the --watch flag (-w for short) to save you having to do this. For example:
kubectl get pods --watchNAME READY STATUS RESTARTS AGEdemo-95444875c-z9xv4 0/1 ContainerCreating 0 1s... [time passes] ...demo-95444875c-z9xv4 0/1 Completed 0 2sdemo-95444875c-z9xv4 1/1 Running 0 2s
Every time the status of one of the matching Pods changes, you’ll see an update in your terminal. (See “Watching Kubernetes Resources with kubespy” for a neat way to watch any kind of resource.)
Describing Objects
For really detailed information about Kubernetes objects, you can use the kubectl describe command:
kubectl describe pods demo-d94cffc44-gvgzmThe Events section can be particularly useful for troubleshooting containers that aren’t working properly, as it records each stage of the container’s life cycle, along with any errors that occurred.
Working with Resources
So far, you’ve used kubectl mostly for querying or listing things, as well as applying declarative YAML manifests with kubectl apply. However, kubectl also has a complete set of imperative commands: operations that create or modify resources directly.
Imperative kubectl Commands
We showed one example of this in “Running the Demo App”, using the kubectl run command, which implicitly creates a Deployment to run the specified container.
You can also explicitly create most resources using kubectl create:
kubectl create namespace my-new-namespacenamespace "my-new-namespace" created
Similarly, kubectl delete will delete a resource:
kubectl delete namespace my-new-namespacenamespace "my-new-namespace" deleted
The kubectl edit command gives you the power to view and modify any resource:
kubectl edit deployments my-deploymentThis will open your default editor with a YAML manifest file representing the specified resource.
This is a good way to get a detailed look at the configuration of any resource, but you can also make any changes you like in the editor. When you save the file and quit the editor, kubectl will update the resource, exactly as though you had run kubectl apply on the manifest file for the resource.
If you introduced any errors, such as invalid YAML, kubectl will tell you and reopen the file for you to fix the problem.
When Not to Use Imperative Commands
Throughout this book we’ve emphasized the importance of using declarative infrastructure as code. So it shouldn’t come as a surprise that we don’t recommend you use imperative kubectl commands.
Although they can be very useful for quickly testing things or trying out ideas, the major problem with imperative commands is that you have no single source of truth. There’s no way to know who ran what imperative commands on the cluster at what time, and what the effect was. As soon as you run any imperative command, the state of the cluster becomes out of sync with the manifest files stored in version control.
The next time someone applies the YAML manifests, whatever changes you made imperatively will be overwritten and lost. This can lead to surprising results, and potentially adverse effects on critical services:
Alice is on-call, when suddenly there is a large increase in load on the service she is managing. Alice uses thekubectl scalecommand to increase the number of replicas from 5 to 10. Several days later, Bob edits the YAML manifests in version control to use a new container image, but he doesn’t notice that the number of replicas in the file is currently 5, not the 10 that are active in production. Bob proceeds with the rollout, which cuts the number of replicas by half, causing an immediate overload or outage.Kelsey Hightower et al., Kubernetes Up & Running
Alice forgot to update the files in version control after she made her imperative change, but that’s easy to do, especially under the stress of an incident (see “On-call Should Not Be Hell”). Real life doesn’t always follow best practices.
Similarly, before reapplying the manifest files, Bob should have checked the diff using kubectl diff (see “Diffing Resources”) to see what would change. But if you’re not expecting something to be different, it’s easy to overlook it. And maybe Bob hasn’t read this book.
The best way to avoid this kind of problem is to always make changes by editing and applying the resource files under version control.
Best Practice
Don’t use kubectl imperative commands such as create or edit on production clusters. Instead, always manage resources with version-controlled YAML manifests, applied with kubectl apply (or Helm charts).
Generating Resource Manifests
Even though we don’t recommend using kubectl in imperative mode to make changes to your cluster, imperative commands can be a great time-saver when creating Kubernetes YAML files from scratch.
Rather than typing a lot of boilerplate into an empty file, you can use kubectl to give you a head start, by generating the YAML manifest for you:
kubectl run demo --image=cloudnatived/demo:hello --dry-run -o yamlapiVersion: extensions/v1beta1kind: Deployment...
The --dry-run flag tells kubectl not to actually create the resource, but merely to print out what it would have created. The -o yaml flag gives you the resource manifest in YAML format. You can save this output to a file, edit it if you need to, and finally apply it to create the resource in the cluster:
kubectl run demo --image=cloudnatived/demo:hello --dry-run -o yaml>deployment.yaml
Now make some edits, using your favorite editor, save, and apply the result:
kubectl apply -f deployment.yamldeployment.apps "demo" created
Exporting Resources
As well as helping you create new resource manifests, kubectl can also produce manifest files for resources that already exist in the cluster. For example, maybe you created a Deployment using imperative commands (kubectl run), edited and adjusted it to get the settings just right, and now you want to write a declarative YAML manifest for it that you can add to version control.
To do this, use the --export flag with kubectl get:
kubectl run newdemo --image=cloudnatived/demo:hello --port=8888--labels app=newdemodeployment.apps "newdemo" createdkubectl get deployments newdemo -o yaml --export >deployment.yaml
This output is in the right format for you to save with your other manifests, update, and apply with kubectl apply -f.
If you’ve been using imperative kubectl commands to manage your cluster up to now, and you’d like to switch to the declarative style that we recommend in this book, this is a great way to do it. Export all the resources in your cluster to manifest files using kubectl with the --export flag, as shown in the example, and you’ll be all set.
Diffing Resources
Before you apply Kubernetes manifests using kubectl apply, it’s very useful to be able to see exactly what would change on the cluster. The kubectl diff command will do this for you.
kubectl diff -f deployment.yaml- replicas: 10+ replicas: 5
You can use this diff output to check whether the changes you made will actually have the effect you expected. Also, it will warn you if the state of the live resource is out of sync with the YAML manifest, perhaps because someone edited it imperatively since you last applied it.
Best Practice
Use kubectl diff to check what would change before applying any updates to your production cluster.
Working with Containers
Most of what goes on in a Kubernetes cluster happens inside containers, so when things go wrong, it can be hard to see what’s happening. Here are a few useful ways to work with running containers using kubectl.
Viewing a Container’s Logs
When you’re trying to get a container working and it’s not behaving as it should, one of the most useful sources of information is the container’s logs. In Kubernetes, logs are considered to be whatever a container writes to the standard output and standard error streams; if you were running the program in a terminal, these are what you would see printed in the terminal.
In production applications, especially distributed ones, you’ll need to be able to aggregate logs from multiple services, store them in a persistent database, and query and graph them. This is a big topic, and one we’ll treat in much more detail in Chapter 15.
Inspecting the log messages from specific containers is still a very useful troubleshooting technique, though, and you can do this directly with kubectl logs, followed by the name of a Pod:
kubectl logs -n kube-system --tail=20 kube-dns-autoscaler-69c5cbdcdd-94h7fautoscaler.go:49] Scaling Namespace: kube-system, Target: deployment/kube-dnsautoscaler_server.go:133] ConfigMap not found: configmaps "kube-dns-autoscaler"k8sclient.go:117] Created ConfigMap kube-dns-autoscaler in namespace kube-systemplugin.go:50] Set control mode to linearlinear_controller.go:59] ConfigMap version change (old: new: 526) - rebuilding
Most long-running containers will generate a lot of log output, so you’ll usually want to restrict it to just the most recent lines, using the --tail flag, as in this example. (The container logs will be shown with timestamps, but we’ve trimmed those here to fit the messages on the page.)
To watch a container as it’s running, and stream its log output to your terminal, use the --follow flag (-f for short):
kubectl logs --namespace kube-system --tail=10 --follow etcd-docker-for-desktopetcdserver: starting server... [version: 3.1.12, cluster version: 3.1]embed: ClientTLS: cert = /var/lib/localkube/certs/etcd/server.crt, key = ......
As long as you leave the kubectl logs command running, you’ll continue to see output from the etcd-docker-for-desktop container.
It can be particularly useful to view the Kubernetes API server’s logs; for example, if you have RBAC permission errors (see “Introducing Role-Based Access Control (RBAC)”), they’ll show up here. If you have access to your master nodes, you can find the kube-apiserver Pod in the kube-system namespace and use kubectl logs to see its output.
If you’re using a managed service like GKE, where the master nodes are not visible to you, check your provider’s documentation to see how to find the control plane logs (for example, on GKE they’ll be visible in the Stackdriver Logs Viewer).
Tip
When there are multiple containers in a Pod, you can specify which one you want to see the logs for using the --container flag (-c for short):
kubectl logs -n kube-system metrics-server-c metrics-server-nanny...
For more sophisticated log watching, you may want to use a dedicated tool like Stern instead (see “Stern”).
Attaching to a Container
When looking at the logs of a container isn’t enough, you might need to attach your local terminal to the container instead. This lets you see the container’s output directly. To do this, use kubectl attach:
kubectl attach demo-54f4458547-fcx2nDefaulting container name to demo.Usekubectl describe pod/demo-54f4458547-fcx2nto see all of the containersin this pod.If you don't see a command prompt, try pressing enter.
Watching Kubernetes Resources with kubespy
When you deploy changes to your Kubernetes manifests, there’s often an anxious period of waiting to see what happens next.
Often when you deploy an application, lots of things need to happen behind the scenes, as Kubernetes creates your resources, spins up Pods, and so on.
Because this happens automagically, as engineers like to say, it can be difficult to tell what’s going on. kubectl get and kubectl describe can give you snapshots of individual resources, but what we’d really like is a way to see the state of Kubernetes resources changing in real time.
Enter kubespy, a neat tool from the Pulumi project.1 kubespy can watch an individual resource in the cluster and show you what’s happening to it over time.
For example, if you point kubespy at a Service resource, it will show you when the Service is created, when it’s allocated an IP address, when its endpoints are connected, and so on.
Forwarding a Container Port
We’ve used kubectl port-forward before, in “Running the Demo App”, to forward a Kubernetes Service to a port on your local machine. But you can also use it to forward a container port, if you want to connect directly to a specific Pod. Just specify the Pod name and the local and remote ports:
kubectl port-forward demo-54f4458547-vm88z 9999:8888Forwarding from 127.0.0.1:9999 -> 8888Forwarding from [::1]:9999 -> 8888
Now port 9999 on your local machine will be forwarded to port 8888 on the container, and you can connect to it with a web browser, for example.
Executing Commands on Containers
The isolated nature of containers is great when you want to run reliable, secure workloads. But it can be a little inconvenient when something’s not working right, and you can’t see why.
When you’re running a program on your local machine and it misbehaves, you have the power of the command line at your disposal to troubleshoot it: you can look at the running processes with ps, list and display files with ls and cat, and even edit them with vi.
Very often, with a malfunctioning container, it would be useful to have a shell running in the container so that we can do this kind of interactive debugging.
Using the kubectl exec command, you can run a specified command in any container, including a shell:
kubectl run alpine --image alpine --command -- sleep 999deployment.apps "alpine" createdkubectl get podsNAME READY STATUS RESTARTS AGEalpine-7fd44fc4bf-7gl4n 1/1 Running 0 4skubectl exec -it alpine-7fd44fc4bf-7gl4n /bin/sh/ #psPID USER TIME COMMAND1 root 0:00 sleep 9997 root 0:00 /bin/sh11 root 0:00 ps
If the Pod has more than one container in it, kubectl exec will run the command in the first container by default. Alternatively, you can specify the container with the -c flag:
kubectl exec -it -c container2 POD_NAME /bin/sh(If the container doesn’t have a shell, see “Adding BusyBox to Your Containers”.)
Running Containers for Troubleshooting
As well as running commands on an existing container, sometimes it’s handy to be able to run commands like wget or nslookup in the cluster, to see the results that your application would get. You’ve already learned how to run containers in the cluster with kubectl run, but here are a few useful examples of running one-off container commands for debugging purposes.
First, let’s run an instance of the demo application to test against:
kubectl run demo --image cloudnatived/demo:hello --expose --port 8888service "demo" createddeployment.apps "demo" created
The demo service should have been allocated an IP address and a DNS name of demo that is accessible from inside the cluster. Let’s check that, using the nslookup command running inside a container:
kubectl run nslookup --image=busybox:1.28 --rm -it --restart=Never--command -- nslookup demoServer: 10.79.240.10Address 1: 10.79.240.10 kube-dns.kube-system.svc.cluster.localName: demoAddress 1: 10.79.242.119 demo.default.svc.cluster.local
Good news: the DNS name works, so we should be able to make an HTTP request to it using wget and see the result:
kubectl run wget --image=busybox:1.28 --rm -it --restart=Never--command -- wget -qO- http://demo:8888Hello, 世界
You can see that this pattern of kubectl run commands uses a common set of flags:
kubectl run NAME --image=IMAGE--rm -it --restart=Never --command -- ...
What do these do?
--rm-
This tells Kubernetes to delete the container image after it’s finished running, so that it doesn’t clutter up your nodes’ local storage.
-it-
This runs the container interactively (
i), via a terminal (t), so that you see the output from the container in your own terminal, and can send keystrokes to it if you need to. --restart=Never-
This tells Kubernetes to skip its usual helpful behavior of restarting a container whenever it exits. Since we only want to run the container one time, we can disable the default restart policy.
--command ---
This specifies a command to run, instead of the container’s default entrypoint. Everything following the
--will be passed to the container as a command line, complete with arguments.
Using BusyBox Commands
Although you can run any container available to you, the busybox image is particularly useful, because it contains a wealth of the most commonly used Unix commands, such as cat, echo, find, grep, and kill. You can see a complete list of BusyBox commands at their website.
BusyBox also includes a lightweight bash-like shell, called ash, which is compatible with standard /bin/sh shell scripts. So to get an interactive shell in your cluster, you can run:
kubectl run busybox --image=busybox:1.28 --rm -it --restart=Never /bin/shBecause the pattern for running commands from the BusyBox image is always the same, you could even make a shell alias for it (see “Shell Aliases”):
alias bb=kubectl run busybox --image=busybox:1.28 --rm -it --restart=Never
    --command --
bb nslookup demo
...
bb wget -qO- http://demo:8888
...
bb sh
If you don't see a command prompt, try pressing enter.
/ #
Adding BusyBox to Your Containers
If your container already has a shell in it (for example, if it’s built from a Linux base image, such as alpine), then you can get shell access on the container by running:
kubectl exec -it POD /bin/shBut what if there’s no /bin/sh in the container? For example, if you’re using a minimal, scratch image as described in “Understanding Dockerfiles”.
The simplest way to make your containers easily debuggable, while keeping the images very small, is to copy the busybox executable into them at build time. It’s only 1 MiB, which is a small price to pay for having a usable shell and a set of Unix utilities.
You learned in the earlier discussion of multistage builds that you can copy a file from a previously built container into a new container using the Dockerfile COPY --from command. A lesser-known feature of this command is that you can also copy a file from any public image, not just one that you built locally.
The following Dockerfile shows how to do this with the demo image:
FROMgolang:1.11-alpine AS buildWORKDIR/src/COPYmain.gogo.*/src/RUNCGO_ENABLED=0gobuild-o/bin/demoFROMscratchCOPY--from=build/bin/demo/bin/demoCOPY--from=busybox:1.28/bin/busybox/bin/busyboxENTRYPOINT["/bin/demo"]
Here, the --from=busybox:1.28 references the public BusyBox library image.2 You could copy a file from any image you like (such as alpine, for example).
Now you still have a very small container, but you can also get a shell on it, by running:
kubectl exec -it POD_NAME /bin/busybox shInstead of executing /bin/sh directly, you execute /bin/busybox followed by the name of the command you want; in this case, sh.
Installing Programs on a Container
If you need some programs that aren’t included in BusyBox, or aren’t available in a public container image, you can run a Linux image such as alpine or ubuntu instead, and install whatever you need on it:
kubectl run alpine --image alpine --rm -it --restart=Never /bin/shIf you don't see a command prompt, try pressing enter./ #apk --update add emacs
Live Debugging with kubesquash
We’ve talked somewhat loosely about debugging containers in this chapter, in the sense of figuring out what’s wrong with them. But what if you want to attach a real debugger, like gdb (the GNU Project debugger) or dlv (the Go debugger) to one of your running processes in a container?
A debugger, such as dlv, is a very powerful tool that can attach to a process, show you which source code lines are being executed, inspect and change the values of local variables, set breakpoints, and step through code line by line. If something mysterious is going on that you can’t figure out, it’s likely that eventually you’ll have to resort to a debugger.
When you’re running a program on your local machine, you have direct access to its processes, so this is no problem. If it’s in a container, then like most things, it’s a little bit more complicated than that.
The kubesquash tool is designed to help you attach a debugger to a container. To install it, follow the instructions on GitHub.
Once kubesquash is installed, all you need to do to use it is to give it the name of a running container:
/usr/local/bin/kubesquash-osx demo-6d7dff895c-x8pfd? Going to attach dlv to pod demo-6d7dff895c-x8pfd. continue?YesIf you don't see a command prompt, try pressing enter.(dlv)
Behind the scenes, kubesquash creates a Pod in the squash namespace that runs the debugger binary, and takes care of attaching it to the running process in the Pod you specified.
For technical reasons, kubesquash relies on the ls command being available in the target container. If you’re using a scratch container, you can bake in the BusyBox executable to make this work, like we did in “Adding BusyBox to Your Containers”:
COPY--from=busybox:1.28/bin/busybox/bin/ls
Instead of copying the executable to /bin/busybox, we copy it to /bin/ls. This makes kubesquash work perfectly.
We won’t go into the details of using dlv here, but if you’re writing Kubernetes applications in Go, it’s an invaluable tool, and kubesquash is a very easy way to use it with containers.
You can read more about dlv in the official documentation.
Contexts and Namespaces
So far in this book we’ve been working with a single Kubernetes cluster, and all the kubectl commands you’ve run have naturally applied to that cluster.
So what happens when you have more than one cluster? For example, maybe you have a Kubernetes cluster on your machine, for local testing, and a production cluster in the cloud, and perhaps another remote cluster for staging and development. How does kubectl know which one you mean?
To solve this problem, kubectl has the concept of contexts. A context is a combination of a cluster, a user, and a namespace (see “Using Namespaces”).
When you run kubectl commands, they’re always executed in the current context. Let’s look at an example:
kubectl config get-contextsCURRENT NAME CLUSTER AUTHINFO NAMESPACEgke gke_test_us-w gke_test_us myapp* docker-for-desktop docker-for-d docker-for-d
These are the contexts kubectl currently knows about. Each context has a name, and refers to a particular cluster, a username that authenticates to the cluster, and a namespace within the cluster. The docker-for-desktop context, as you might expect, refers to my local Kubernetes cluster.
The current context is shown with a * in the first column (in the example, it’s docker-for-desktop). If I run a kubectl command now, it will operate on the Docker Desktop cluster, in the default namespace (because the NAMESPACE column is blank, indicating that the context refers to the default namespace):
kubectl cluster-info
Kubernetes master is running at https://192.168.99.100:8443
KubeDNS is running at https://192.168.99.100:8443/api/v1/...

To further debug and diagnose cluster problems, use 'kubectl cluster-info dump'.
You can switch to another context using the kubectl config use-context command:
kubectl config use-context gkeSwitched to context "gke".
You could think of contexts as being like bookmarks: they let you switch easily to a particular cluster and a particular namespace. To create a new context, use kubectl config set-context:
kubectl config set-context myapp --cluster=gke --namespace=myappContext "myapp" created.
Now whenever you switch to the myapp context, your current context will be the myapp namespace on the Docker Desktop cluster.
If you forget what your current context is, kubectl config current-context will tell you:
kubectl config current-contextmyapp
kubectx and kubens
If, like us, you type for a living, you probably don’t like typing any more keystrokes than you have to. For faster switching of kubectl contexts, you can use the kubectx and kubens tools. Follow the instructions on GitHub to install both kubectx and kubens.
Now you can use the kubectx command to switch contexts:
kubectx docker-for-desktopSwitched to context "docker-for-desktop".
One nice feature of kubectx is that kubectx - will switch to your previous context, so you can quickly toggle between two contexts:
kubectx -Switched to context "gke".kubectx -Switched to context "docker-for-desktop".
Just kubectx on its own will list all the contexts you have stored, with the current context highlighted.
Switching namespaces is something you’ll probably do more often than switching contexts, so the kubens tool is ideal for this:
kubensdefaultkube-publickube-systemkubens kube-systemContext "docker-for-desktop" modified.Active namespace is "kube-system".kubens -Context "docker-for-desktop" modified.Active namespace is "default".
Tip
The kubectx and kubens tools do one thing well, and they’re very useful additions to your Kubernetes toolbox.
kube-ps1
If you use the bash or zsh shells, there’s a little utility that will add the current Kubernetes context to your prompt.
With kube-ps1 installed, you can’t forget which context you’re in:
source "/usr/local/opt/kube-ps1/share/kube-ps1.sh"PS1="[$(kube_ps1)]$ "[(⎈ |docker-for-desktop:default)]kubectx cloudnativedevopsSwitched to context "cloudnativedevops".(⎈ |cloudnativedevops:cloudnativedevopsblog)
Kubernetes Shells and Tools
While using kubectl in an ordinary shell is perfectly sufficient for most things you’ll want to do with a Kubernetes cluster, there are other options.
kube-shell
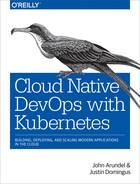
If kubectl auto-completion isn’t fancy enough for you, there’s always kube-shell, a wrapper for kubectl that provides a pop-up menu of possible completions for each command (see Figure 7-1).

Figure 7-1. kube-shell is an interactive Kubernetes client
Click
A more sophisticated Kubernetes terminal experience is provided by Click.
Click is like an interactive version of kubectl, which remembers the current object you’re working with. For example, when you want to find and describe a Pod in kubectl, you usually have to list all the matching Pods first, then copy and paste the unique name of the Pod you’re interested in into a new command.
Instead, with Click, you can select any resource from a list by typing its number (for example, 1 for the first item). That’s now the current resource, and the next Click command will operate on that resource by default. To make finding the object you want easier, Click supports searching by regular expressions.
Click is a powerful tool that provides a very pleasant environment for working with Kubernetes. While it’s described as beta and experimental, it’s already perfectly usable for everyday cluster administration tasks, and it’s well worth trying out.
kubed-sh
While kube-shell and Click provide essentially local shells that know a little about Kubernetes, kubed-sh (pronounced kube-dash) is a more intriguing idea: a shell that runs, in some sense, on the cluster itself.
kubed-sh will pull and run the necessary containers to execute JavaScript, Ruby, or Python programs on your current cluster. You can create, for example, a Ruby script on your local machine, and use kubed-sh to execute the script as a Kubernetes Deployment.
Stern
While kubectl logs is a useful command (see “Viewing a Container’s Logs”), it’s not as convenient as it could be. For example, before you can use it, you first have to find out the unique name of the Pod and container whose logs you want to see, and specify these on the command line, which generally means at least one copy and paste.
Also, if you’re using -f to follow logs from a particular container, whenever the container is restarted, your log stream will stop. You’ll have to find out the new name of the container and run kubectl logs again to follow it. And you can only follow logs from one Pod at a time.
A more sophisticated log-streaming tool would allow you to specify a group of Pods with a regular expression matching their names, or a set of labels, and it would be able to keep on streaming logs even if individual containers are restarted.
Fortunately, that’s exactly what the Stern tool does. Stern tails the logs from all Pods matching a regular expression (for example demo.*). If there are multiple containers within the Pod, Stern will show you log messages from each, prefixed by its name.
The --since flag lets you limit the output to recent messages (within the last 10 minutes, in the example).
Instead of matching specific Pod names with a regular expression, you can use any Kubernetes label selector expression, just as with kubectl. Combined with the --all-namespaces flag, this is ideal for watching logs from multiple containers.
Building Your Own Kubernetes Tools
Combined with query tools like jq and the standard set of Unix utilities (cut, grep, xargs, and friends), kubectl can be used for some fairly sophisticated scripting of Kubernetes resources. As we’ve seen in this chapter, there are also many third-party tools available that you can use as part of automated scripts.
This approach has its limits, however. It’s fine to cook up ingenious one-liners and ad hoc shell scripts for interactive debugging and exploration, but they can be hard to understand and maintain.
For real systems programs, automating your production workflows, we strongly recommend you use a real systems programming language. Go is the logical choice, since it was good enough for the Kubernetes authors, and naturally Kubernetes includes a full-featured client library for use in Go programs.
Because the client-go library gives you complete access to the Kubernetes API, you can do anything with it that kubectl can do, and more. The following snippet shows how to list all the Pods in your cluster, for example:
...podList,err:=clientset.CoreV1().Pods("").List(metav1.ListOptions{})iferr!=nil{log.Fatal(err)}fmt.Println("There are",len(podList.Items),"pods in the cluster:")for_,i:=rangepodList.Items{fmt.Println(i.ObjectMeta.Name)}...
You can also create or delete Pods, Deployments, or any other resources. You can even implement your own custom resource types.
If you need a feature that’s missing from Kubernetes, you can implement it yourself, using the client library.
Other programming languages, such as Ruby, Python, and PHP, also have Kubernetes client libraries you can use in the same way.
Summary
There is a bewildering profusion of Kubernetes tools available, and more are released every week. You could be forgiven for feeling a little weary when reading about yet another tool you apparently can’t do without.
The fact is, you don’t need most of these tools. Kubernetes itself, via kubectl, can do most everything you want it to. The rest is just for fun and convenience.
Nobody knows everything, but everybody knows something. In writing this chapter, we’ve incorporated tips and tricks from lots of experienced Kubernetes engineers, from books, blog posts, and documentation, and one or two little discoveries of our own. Everybody we’ve shown it to, no matter how expert, learned at least one useful thing. That makes us happy.
It’s worth taking a little time to get familiar with kubectl and explore its possibilities; it’s the most important Kubernetes tool you have, and you’ll be using it a lot.
Here are a few of the most important things to know:
-
kubectlincludes complete and exhaustive documentation on itself, available withkubectl -h, and on every Kubernetes resource, field, or feature, usingkubectl explain. -
When you want to do complicated filtering and transformations on
kubectloutput, for example in scripts, select JSON format with-o json. Once you have JSON data, you can use power tools likejqto query it. -
The
--dry-runoption tokubectl, combined with-o YAMLto get YAML output, lets you use imperative commands to generate Kubernetes manifests. This is a big time-saver when creating manifest files for new applications, for example. -
You can turn existing resources into YAML manifests, too, using the
--exportflag tokubectl get. -
kubectl diffwill tell you what would change if you applied a manifest, without actually changing it. -
You can see the output and error messages from any container with
kubectl logs, stream them continuously with the--followflag, or do more sophisticated multi-Pod log tailing with Stern. -
To troubleshoot problem containers, you can attach to them with
kubectl attachor get a shell on the container withkubectl exec -it ... /bin/sh. -
You can run any public container image with
kubectl runto help solve problems, including the multitalented BusyBox tool, which contains all your favorite Unix commands. -
Kubernetes contexts are like bookmarks, marking your place in a particular cluster and namespace. You can switch conveniently between contexts and namespaces using the
kubectxandkubenstools. -
Click is a powerful Kubernetes shell that gives you all the functionality of
kubectl, but with added state: it remembers the currently selected object from one command to the next, so you don’t have to specify it every time. -
Kubernetes is designed to be automated and controlled by code. When you need to go beyond what
kubectlprovides, the Kubernetesclient-golibrary gives you complete control over every aspect of your cluster using Go code.
1 Pulumi is a cloud native, infrastructure as code framework.
2 Versions of the BusyBox image later than 1.28 have a problem doing DNS lookups in Kubernetes.