Chapter 5. Managing Resources
Nothing is enough to the man for whom enough is too little.
Epicurus
In this chapter we’ll look at how to make the most of your cluster: how to manage and optimize resource usage, how to manage the life cycle of containers, and how to partition the cluster using namespaces. We’ll also outline some techniques and best practices for keeping down the cost of your cluster, while getting the most for your money.
You’ll learn how to use resource requests, limits, and defaults, and how to optimize them with the Vertical Pod Autoscaler; how to use readiness probes, liveness probes, and Pod disruption budgets to manage containers; how to optimize cloud storage; and how and when to use preemptible or reserved instances to control costs.
Understanding Resources
Suppose you have a Kubernetes cluster of a given capacity, with a reasonable number of nodes of the right kind of size. How do you get the most bang for your buck out of it? That is, how do you get the best possible utilization of the available cluster resources for your workload, while still ensuring that you have enough headroom to deal with demand spikes, node failures, and bad deployments?
To answer this, put yourself in the place of the Kubernetes scheduler and try to see things from its point of view. The scheduler’s job is to decide where to run a given Pod. Are there any nodes with enough free resources to run the Pod?
This question is impossible to answer unless the scheduler knows how much resource the Pod will need to run. A Pod that needs 1 GiB of memory cannot be scheduled on a node with only 100 MiB of free memory.
Similarly, the scheduler has to be able to take action when a greedy Pod is grabbing too many resources and starving other Pods on the same node. But how much is too much? In order to schedule Pods effectively, the scheduler has to know the minimum and maximum allowable resource requirements for each Pod.
That’s where Kubernetes resource requests and limits come in. Kubernetes understands how to manage two kinds of resources: CPU and memory. There are other important types of resources, too, such as network bandwidth, disk I/O operations (IOPS), and disk space, and these may cause contention in the cluster, but Kubernetes doesn’t yet have a way to describe Pods’ requirements for these.
Resource Units
CPU usage for Pods is expressed, as you might expect, in units of CPUs. One Kubernetes CPU unit is equivalent to one AWS vCPU, one Google Cloud Core, one Azure vCore, or one hyperthread on a bare-metal processor that supports hyperthreading. In other words, 1 CPU in Kubernetes terms means what you think it does.
Because most Pods don’t need a whole CPU, requests and limits are usually expressed in millicpus (sometimes called millicores). Memory is measured in bytes, or more handily, mebibytes (MiB).
Resource Requests
A Kubernetes resource request specifies the minimum amount of that resource that the Pod needs to run. For example, a resource request of 100m (100 millicpus) and 250Mi (250 MiB of memory) means that the Pod cannot be scheduled on a node with less than those resources available. If there isn’t any node with enough capacity available, the Pod will remain in a pending state until there is.
For example, if all your cluster nodes have two CPU cores and 4 GiB of memory, a container that requests 2.5 CPUs will never be scheduled, and neither will one that requests 5 GiB of memory.
Let’s see what resource requests would look like, applied to our demo application:
spec:containers:-name:demoimage:cloudnatived/demo:helloports:-containerPort:8888resources:requests:memory:"10Mi"cpu:"100m"
Resource Limits
A resource limit specifies the maximum amount of resource that a Pod is allowed to use. A Pod that tries to use more than its allocated CPU limit will be throttled, reducing its performance.
A Pod that tries to use more than the allowed memory limit, though, will be terminated. If the terminated Pod can be rescheduled, it will be. In practice, this may mean that the Pod is simply restarted on the same node.
Some applications, such as network servers, can consume more and more resources over time in response to increasing demand. Specifying resource limits is a good way to prevent such hungry Pods from using more than their fair share of the cluster’s capacity.
Here’s an example of setting resource limits on the demo application:
spec:containers:-name:demoimage:cloudnatived/demo:helloports:-containerPort:8888resources:limits:memory:"20Mi"cpu:"250m"
Knowing what limits to set for a particular application is a matter of observation and judgment (see “Optimizing Pods”).
Kubernetes allows resources to be overcommitted; that is, the sum of all the resource limits of containers on a node can exceed the total resources of that node. This is a kind of gamble: the scheduler is betting that, most of the time, most containers will not need to hit their resource limits.
If this gamble fails, and total resource usage starts approaching the maximum capacity of the node, Kubernetes will start being more aggressive in terminating containers. Under conditions of resource pressure, containers that have exceeded their requests, but not their limits, may still be terminated.1
All other things being equal, if Kubernetes needs to terminate Pods, it will start with the ones that have most exceeded their requests. Pods that are within their requests will not be terminated except in very rare circumstances where Kubernetes would otherwise be unable to run its system components, such as the kubelet.
Best Practice
Always specify resource requests and limits for your containers. This helps Kubernetes schedule and manage your Pods properly.
Keep Your Containers Small
We mentioned in “Minimal Container Images” that keeping your container images as small as possible is a good idea, for lots of reasons:
-
Small containers build faster.
-
The images take up less storage.
-
Image pulls are faster.
-
The attack surface is reduced.
If you’re using Go, you’re already way ahead, because Go can compile your application into a single statically linked binary. If there’s only one file in your container, it’s about as small as it can be!
Managing the Container Life Cycle
We’ve seen that Kubernetes can best manage your Pods when it knows what their CPU and memory requirements are. But it also has to know when a container is working: that is, when it’s functioning properly and ready to handle requests.
It’s quite common for containerized applications to get into a stuck state, where the process is still running, but it’s not serving any requests. Kubernetes needs a way to detect this situation, so that it can restart the container to fix the problem.
Liveness Probes
Kubernetes lets you specify a liveness probe as part of the container spec: a health check that determines whether or not the container is alive (that is, working).
For an HTTP server container, the liveness probe specification usually looks something like this:
livenessProbe:httpGet:path:/healthzport:8888initialDelaySeconds:3periodSeconds:3
The httpGet probe makes an HTTP request to a URI and port you specify; in this case, /healthz on port 8888.
If your application doesn’t have a specific endpoint for a health check, you could use /, or any valid URL for your application. It’s common practice, though, to create a /healthz endpoint just for this purpose. (Why the z? Just to make sure it doesn’t collide with an existing path like health, which could be a page about health information, for example).
If the application responds with an HTTP 2xx or 3xx status code, Kubernetes considers it alive. If it responds with anything else, or doesn’t respond at all, the container is considered dead, and will be restarted.
Probe Delay and Frequency
How soon should Kubernetes start checking your liveness probe? No application can start instantly. If Kubernetes tried the liveness probe immediately after starting the container, it would probably fail, causing the container to be restarted—and this loop would repeat forever!
The initialDelaySeconds field lets you tell Kubernetes how long to wait before trying the first liveness probe, avoiding this loop of death situation.
Similarly, it wouldn’t be a good idea for Kubernetes to hammer your application with requests for the healthz endpoint thousands of times a second. The periodSeconds field specifies how often the liveness probe should be checked; in this example, every three seconds.
Other Types of Probes
httpGet isn’t the only kind of probe available; for network servers that don’t speak HTTP, you can use tcpSocket:
livenessProbe:tcpSocket:port:8888
If a TCP connection to the specified port succeeds, the container is alive.
You can also run an arbitrary command on the container, using an exec probe:
readinessProbe:exec:command:-cat-/tmp/healthy
The exec probe runs the specified command inside the container, and the probe succeeds if the command succeeds (that is, exits with a zero status). exec is usually more useful as a readiness probe, and we’ll see how they’re used in the next section.
gRPC Probes
Although many applications and services communicate via HTTP, it’s increasingly popular to use the gRPC protocol instead, especially for microservices. gRPC is an efficient, portable, binary network protocol developed by Google and hosted by the Cloud Native Computing Foundation.
httpGet probes will not work with gRPC servers, and although you could use a tcpSocket probe instead, that only tells you that you can make a connection to the socket, not that the server itself is working.
gRPC has a standard health checking protocol, which most gRPC services support, and to interrogate this health check with a Kubernetes liveness probe you can use the grpc-health-probe tool. If you add the tool to your container, you can check it using an exec probe.
Readiness Probes
Related to the liveness probe, but with different semantics, is the readiness probe. Sometimes an application needs to signal to Kubernetes that it’s temporarily unable to handle requests; perhaps because it’s performing some lengthy initialization process, or waiting for some subprocess to complete. The readiness probe serves this function.
If your application doesn’t start listening for HTTP until it’s ready to serve, your readiness probe can be the same as your liveness probe:
readinessProbe:httpGet:path:/healthzport:8888initialDelaySeconds:3periodSeconds:3
A container that fails its readiness probe will be removed from any Services that match the Pod. This is like taking a failing node out of a load balancer pool: no traffic will be sent to the Pod until its readiness probe starts succeeding again.
Normally, when a Pod starts, Kubernetes will start sending it traffic as soon as the container is in a running state. However, if the container has a readiness probe, Kubernetes will wait until the probe succeeds before sending it any requests, so that users won’t see errors from unready containers. This is critically important for zero-downtime upgrades (see “Deployment Strategies” for more about these).
A container that is not ready will still be shown as Running, but the READY column will show one or more unready containers in the Pod:
kubectl get podsNAME READY STATUS RESTARTS AGEreadiness-test 0/1 Running 0 56s
Note
Readiness probes should only return HTTP 200 OK status. Although Kubernetes itself considers both 2xx and 3xx status codes as ready, cloud load balancers may not. If you’re using an Ingress resource coupled with a cloud load balancer (see “Ingress Resources”), and your readiness probe returns a 301 redirect, for example, the load balancer may flag all your Pods as unhealthy. Make sure your readiness probes only return a 200 status code.
File-Based Readiness Probes
Alternatively, you could have the application create a file on the container’s filesystem called something like /tmp/healthy, and use an exec readiness probe to check for the presence of that file.
This kind of readiness probe can be useful, because if you want to take the container temporarily out of service to debug a problem, you can attach to the container and delete the /tmp/healthy file. The next readiness probe will fail, and Kubernetes will remove the container from any matching Services. (A better way to do this, though, is to adjust the container’s labels so that it no longer matches the service: see “Service Resources”.)
You can now inspect and troubleshoot the container at your leisure. Once you’re done, you can either terminate the container and deploy a fixed version, or put the probe file back in place, so that the container will start receiving traffic again.
Best Practice
Use readiness probes and liveness probes to let Kubernetes know when your application is ready to handle requests, or when it has a problem and needs to be restarted.
minReadySeconds
By default, a container or Pod is considered ready the moment its readiness probe succeeds. In some cases, you may want to run the container for a short while to make sure it is stable. During a deployment, Kubernetes waits until each new Pod is ready before starting the next (see “Rolling Updates”). If a faulty container crashes straight away, this will halt the rollout, but if it takes a few seconds to crash, all its replicas might be rolled out before you discover the problem.
To avoid this, you can set the minReadySeconds field on the container. A container or Pod will not be considered ready until its readiness probe has been up for minReadySeconds (default 0).
Pod Disruption Budgets
Sometimes Kubernetes needs to stop your Pods even though they’re alive and ready (a process called eviction). Perhaps the node they’re running on is being drained prior to an upgrade, for example, and the Pods need to be moved to another node.
However, this needn’t result in downtime for your application, provided enough replicas can be kept running. You can use the PodDisruptionBudget resource to specify, for a given application, how many Pods you can afford to lose at any given time.
For example, you might specify that no more than 10% of your application’s Pods can be disrupted at once. Or perhaps you want to specify that Kubernetes can evict any number of Pods, provided that at least three replicas are always running.
minAvailable
Here’s an example of a PodDisruptionBudget that specifies a minimum number of Pods to be kept running, using the minAvailable field:
apiVersion:policy/v1beta1kind:PodDisruptionBudgetmetadata:name:demo-pdbspec:minAvailable:3selector:matchLabels:app:demo
In this example, minAvailable: 3 specifies that at least three Pods matching the label app: demo should always be running. Kubernetes can evict as many demo Pods as it wants, so long as there are always at least three left.
maxUnavailable
Conversely, you can use maxUnavailable to limit the total number or percentage of Pods that Kubernetes is allowed to evict:
apiVersion:policy/v1beta1kind:PodDisruptionBudgetmetadata:name:demo-pdbspec:maxUnavailable:10%selector:matchLabels:app:demo
Here, no more than 10% of demo Pods are allowed to be evicted at any one time. This only applies to so-called voluntary evictions, though; that is to say, evictions initiated by Kubernetes. If a node suffers a hardware failure or gets deleted, for example, the Pods on it will be involuntarily evicted, even if that would violate the disruption budget.
Since Kubernetes will tend to spread Pods evenly across nodes, all other things being equal, this is worth bearing in mind when considering how many nodes your cluster needs. If you have three nodes, the failure of one could result in the loss of a third of all your Pods, and that may not leave enough to maintain an acceptable level of service (see “High Availability”).
Using Namespaces
Another very useful way of managing resource usage across your cluster is to use namespaces. A Kubernetes namespace is a way of partitioning your cluster into separate subdivisions, for whatever purpose you like.
For example, you might have a prod namespace for production applications, and a test namespace for trying things out. As the term namespace suggests, names in one namespace are not visible from a different namespace.
This means that you could have a service called demo in the prod namespace, and a different service called demo in the test namespace, and there won’t be any conflict.
To see the namespaces that exist on your cluster, run the following command:
kubectl get namespacesNAME STATUS AGEdefault Active 1ykube-public Active 1ykube-system Active 1y
You can think of namespaces as being a bit like folders on your computer’s hard disk. While you could keep all your files in the same folder, it would be inconvenient. Looking for a particular file would be time-consuming, and it wouldn’t be easy to see which files belong with which others. A namespace groups related resources together, and makes it easier to work with them. Unlike folders, however, namespaces can’t be nested.
Working with Namespaces
So far when working with Kubernetes we’ve always used the default namespace. If you don’t specify a namespace when running a kubectl command, such as kubectl run, your command will operate on the default namespace. If you’re wondering what the kube-system namespace is, that’s where the Kubernetes internal system components run, so that they’re segregated from your own applications.
If, instead, you specify a namespace with the --namespace flag (or -n for short), your command will use that namespace. For example, to get a list of Pods in the prod namespace, run:
kubectl get pods --namespace prodWhat Namespaces Should I Use?
It’s entirely up to you how to divide your cluster into namespaces. One idea that makes intuitive sense is to have one namespace per application, or per team. For example, you might create a demo namespace to run the demo application in. You can create a namespace using a Kubernetes Namespace resource like the following:
apiVersion:v1kind:Namespacemetadata:name:demo
To apply this resource manifest, use the kubectl apply -f command (see “Resource Manifests in YAML Format” for more about this.) You’ll find the YAML manifests for all the examples in this section in the demo application repo, in the hello-namespace directory:
cd demo/hello-namespacels k8sdeployment.yaml limitrange.yaml namespace.yaml resourcequota.yamlservice.yaml
You could go further and create namespaces for each environment your app runs in, such as demo-prod, demo-staging, demo-test, and so on. You could use a namespace as a kind of temporary virtual cluster, and delete the namespace when you’re finished with it. But be careful! Deleting a namespace deletes all the resources within it. You really don’t want to run that command against the wrong namespace. (See “Introducing Role-Based Access Control (RBAC)” for how to grant or deny user permissions on individual namespaces.)
In the current version of Kubernetes, there is no way to protect a resource such as a namespace from being deleted (though a proposal for such a feature is under discussion). So don’t delete namespaces unless they really are temporary, and you’re sure they don’t contain any production resources.
Best Practice
Create separate namespaces for each of your applications or each logical component of your infrastructure. Don’t use the default namespace: it’s too easy to make mistakes.
If you need to block all network traffic in or out of a particular namespace, you can use Kubernetes Network Policies to enforce this.
Service Addresses
Although namespaces are isolated from one another, they can still communicate with Services in other namespaces. You may recall from “Service Resources” that every Kubernetes Service has an associated DNS name that you can use to talk to it. Connecting to the hostname demo will connect you to the Service whose name is demo. How does that work across different namespaces?
Service DNS names always follow this pattern:
SERVICE.NAMESPACE.svc.cluster.localThe .svc.cluster.local part is optional, and so is the namespace. But if you want to talk to the demo Service in the prod namespace, for example, you can use:
demo.prodEven if you have a dozen different Services called demo, each in its own namespace, you can add the namespace to the DNS name for the Service to specify exactly which one you mean.
Resource Quotas
As well as restricting the CPU and memory usage of individual containers, which you learned about in “Resource Requests”, you can (and should) restrict the resource usage of a given namespace. The way to do this is to create a ResourceQuota in the namespace. Here’s an example ResourceQuota:
apiVersion:v1kind:ResourceQuotametadata:name:demo-resourcequotaspec:hard:pods:"100"
Applying this manifest to a particular namespace (for example, demo) sets a hard limit of 100 Pods running at once in that namespace. (Note that the metadata.name of the ResourceQuota can be anything you like. The namespaces it affects depends on which namespaces you apply the manifest to.)
cd demo/hello-namespacekubectl create namespace demonamespace "demo" createdkubectl apply --namespace demo -f k8s/resourcequota.yamlresourcequota "demo-resourcequota" created
Now Kubernetes will block any API operations in the demo namespace that would exceed the quota. The example ResourceQuota limits the namespace to 100 Pods, so if there are 100 Pods already running and you try to start a new one, you will see an error message like this:
Error from server (Forbidden): pods "demo" is forbidden: exceeded quota:demo-resourcequota, requested: pods=1, used: pods=100, limited: pods=100
Using ResourceQuotas is a good way to stop applications in one namespace from grabbing too many resources and starving those in other parts of the cluster.
Although you can also limit the total CPU and memory usage of Pods in a namespace, we don’t recommend this. If you set these totals quite low, they’ll likely cause you unexpected and hard-to-spot problems when your workloads are getting close to the limit. If you set them very high, there’s not much point in setting them at all.
However, a Pod limit is useful to prevent a misconfiguration or typing error from generating a potentially unlimited number of Pods. It’s easy to forget to clean up some object from a regular task, and find one day that you’ve got thousands of them clogging up your cluster.
Best Practice
Use ResourceQuotas in each namespace to enforce a limit on the number of Pods that can run in the namespace.
To check if a ResourceQuota is active in a particular namespace, use the kubectl get resourcequotas command:
kubectl get resourcequotas -n demoNAME AGEdemo-resourcequota 15d
Default Resource Requests and Limits
It’s not always easy to know what your container’s resource requirements are going to be in advance. You can set default requests and limits for all containers in a namespace using a LimitRange resource:
apiVersion:v1kind:LimitRangemetadata:name:demo-limitrangespec:limits:-default:cpu:"500m"memory:"256Mi"defaultRequest:cpu:"200m"memory:"128Mi"type:Container
Tip
As with ResourceQuotas, the metadata.name of the LimitRange can be whatever you want. It doesn’t correspond to a Kubernetes namespace, for example. A LimitRange or ResourceQuota takes effect in a particular namespace only when you apply the manifest to that namespace.
Any container in the namespace that doesn’t specify a resource limit or request will inherit the default value from the LimitRange. For example, a container with no cpu request specified will inherit the value of 200m from the LimitRange. Similarly, a container with no memory limit specified will inherit the value of 256Mi from the LimitRange.
In theory, then, you could set the defaults in a LimitRange and not bother to specify requests or limits for individual containers. However, this isn’t good practice: it should be possible to look at a container spec and see what its requests and limits are, without having to know whether or not a LimitRange is in effect. Use the LimitRange only as a backstop to prevent problems with containers whose owners forgot to specify requests and limits.
Best Practice
Use LimitRanges in each namespace to set default resource requests and limits for containers, but don’t rely on them; treat them as a backstop. Always specify explicit requests and limits in the container spec itself.
Optimizing Cluster Costs
In “Cluster Sizing and Scaling”, we outlined some considerations for choosing the initial size of your cluster, and scaling it over time as your workloads evolve. But assuming that your cluster is correctly sized and has sufficient capacity, how should you run it in the most cost-effective way?
Optimizing Deployments
Do you really need quite so many replicas? It may seem an obvious point, but every Pod in your cluster uses up some resources that are thus unavailable to some other Pod.
It can be tempting to run a large number of replicas for everything, so that quality of service will never be reduced if individual Pods fail, or during rolling upgrades. Also, the more replicas, the more traffic your apps can handle.
But you should use replicas wisely. Your cluster can only run a finite number of Pods. Give them to applications that really need maximum availability and performance.
If it really doesn’t matter that a given Deployment is down for a few seconds during an upgrade, it doesn’t need a lot of replicas. A surprisingly large number of applications and services can get by perfectly well with one or two replicas.
Review the number of replicas configured for each Deployment, and ask:
-
What are the business requirements for performance and availability for this service?
-
Can we meet those requirements with fewer replicas?
If an app is struggling to handle demand, or users get too many errors when you upgrade the Deployment, it needs more replicas. But in many cases you can reduce the size of a Deployment considerably before you get to the point where the degradation starts to be noticeable.
Best Practice
Use the minimum number of Pods for a given Deployment that will satisfy your performance and availability requirements. Gradually reduce the number of replicas to just above the point where your service level objectives are met.
Optimizing Pods
Earlier in this chapter, in “Resource Requests”, we emphasized the importance of setting the correct resource requests and limits for your containers. If the resource requests are too small, you’ll soon know about it: Pods will start failing. If they are too large, however, the first time you find about it may be when you get your monthly cloud bill.
You should regularly review the resource requests and limits for your various workloads, and compare them against what was actually used.
Most managed Kubernetes services offer some kind of dashboard showing the CPU and memory usage of your containers over time—we’ll see more about this in “Monitoring Cluster Status”.
You can also build your own dashboards and statistics using Prometheus and Grafana, and we’ll cover this in detail in Chapter 15.
Setting the optimal resource requests and limits is something of an art, and the answer will be different for every kind of workload. Some containers may be idle most of the time, occasionally spiking their resource usage to handle a request; others may be constantly busy, and gradually use more and more memory until they hit their limits.
In general, you should set the resource limits for a container to a little above the maximum it uses in normal operation. For example, if a given container’s memory usage over a few days never exceeds 500 MiB of memory, you might set its memory limit to 600 MiB.
Note
Should containers have limits at all? One school of thought says that containers should have no limits in production, or that the limits should be set so high that the containers will never exceed them. With very large and resource-hungry containers that are expensive to restart, this may make some sense, but we think it’s better to set limits anyway. Without them, a container that has a memory leak, or that uses too much CPU, can gobble up all the resources available on a node, starving other containers.
To avoid this resource Pac-Man scenario, set a container’s limits to a little more than 100% of normal usage. This will ensure it’s not killed as long as it’s working properly, but still minimize the blast radius if something goes wrong.
Request settings are less critical than limits, but they still should not be set too high (as the Pod will never be scheduled), or too low (as Pods that exceed their requests are first in line for eviction).
Vertical Pod Autoscaler
There is a Kubernetes add-on called the Vertical Pod Autoscaler, which can help you work out the ideal values for resource requests. It will watch a specified Deployment and automatically adjust the resource requests for its Pods based on what they actually use. It has a dry-run mode that will just make suggestions, without actually modifying the running Pods, and this can be helpful.
Optimizing Nodes
Kubernetes can work with a wide range of node sizes, but some will perform better than others. To get the best cluster capacity for your money, you need to observe how your nodes perform in practice, under real demand conditions, with your specific workloads. This will help you determine the most cost-effective instance types.
It’s worth remembering that every node has to have an operating system on it, which consumes disk, memory, and CPU resources. So do the Kubernetes system components and the container runtime. The smaller the node, the bigger a proportion of its total resources this overhead represents.
Larger nodes, therefore, can be more cost-effective, because a greater proportion of their resources are available for your workloads. The trade-off is that losing an individual node has a bigger effect on your cluster’s available capacity.
Small nodes also have a higher percentage of stranded resources: chunks of memory space and CPU time that are unused, but too small for any existing Pod to claim them.
A good rule of thumb is that nodes should be big enough to run at least five of your typical Pods, keeping the proportion of stranded resources to around 10% or less. If the node can run 10 or more Pods, stranded resources will be below 5%.
The default limit in Kubernetes is 110 Pods per node. Although you can increase this limit by adjusting the --max-pods setting of the kubelet, this may not be possible with some managed services, and it’s a good idea to stick to the Kubernetes defaults unless there is a strong reason to change them.
The Pods-per-node limit means that you may not be able to take advantage of your cloud provider’s largest instance sizes. Instead, consider running a larger number of smaller nodes to get better utilization. For example, instead of 6 nodes with 8 vCPUs, run 12 nodes with 4 vCPUs.
Tip
Look at the percentage resource utilization of each node, using your cloud provider’s dashboard or kubectl top nodes. The bigger the percentage of CPU in use, the better the utilization. If the larger nodes in your cluster have better utilization, you may be well advised to remove some of the smaller nodes and replace them with larger ones.
On the other hand, if larger nodes have low utilization, your cluster may be over capacity and you can therefore either remove some nodes, or make them smaller, reducing the total bill.
Best Practice
Larger nodes tend to be more cost-effective, because less of their resources are consumed by system overhead. Size your nodes by looking at real-world utilization figures for your cluster, aiming for between 10 and 100 Pods per node.
Optimizing Storage
One cloud cost that is often overlooked is that of disk storage. Cloud providers offer varying amounts of disk space with each of their instance sizes, and the price of large-scale storage varies too.
While it’s possible to achieve quite high CPU and memory utilization using Kubernetes resource requests and limits, the same is not true of storage, and many cluster nodes are significantly over-provisioned with disk space.
Not only do many nodes have more storage space than they need, the class of storage can also be a factor. Most cloud providers offer different classes of storage depending on the number of I/O operations per second (IOPS), or bandwidth, allocated.
For example, databases that use persistent disk volumes often need a very high IOPS rating, for fast, high-throughput storage access. This is expensive. You can save on cloud costs by provisioning low-IOPS storage for workloads that don’t need so much bandwidth. On the other hand, if your application is performing poorly because it’s spending a lot of time waiting for storage I/O, you may want to provision more IOPS to handle this.
Your cloud or Kubernetes provider console can usually show you how many IOPS are actually being used on your nodes, and you can use these figures to help you decide where to cut costs.
Ideally, you would be able to set resource requests for containers that need high bandwidth or large amounts of storage. However, Kubernetes does not currently support this, though support for IOPS requests may be added in the future.
Best Practice
Don’t use instance types with more storage than you need. Provision the smallest, lowest-IOPS disk volumes you can, based on the throughput and space that you actually use.
Cleaning Up Unused Resources
As your Kubernetes clusters grow, you will find many unused, or lost resources hanging around in dark corners. Over time, if these lost resources are not cleaned up, they will start to represent a significant fraction of your overall costs.
At the highest level, you may find cloud instances that are not part of any cluster; it’s easy to forget to terminate a machine when it’s no longer in use.
Other types of cloud resources, such as load balancers, public IPs, and disk volumes, also cost you money even though they’re not in use. You should regularly review your usage of each type of resource, to find and remove unused instances.
Similarly, there may be Deployments and Pods in your Kubernetes cluster that are not actually referenced by any Service, and so cannot receive traffic.
Even container images that are not running take up disk space on your nodes. Fortunately, Kubernetes will automatically clean up unused images when the node starts running short of disk space.2
Using owner metadata
One helpful way to minimize unused resources is to have an organization-wide policy that each resource must be tagged with information about its owner. You can use Kubernetes annotations to do this (see “Labels and Annotations”).
For example, you could annotate each Deployment like this:
apiVersion:extensions/v1beta1kind:Deploymentmetadata:name:my-brilliant-appannotations:example.com/owner:"CustomerAppsTeam"...
The owner metadata should specify the person or team to be contacted about this resource. This is useful anyway, but it’s especially handy for identifying abandoned or unused resources. (Note that it’s a good idea to prefix custom annotations with the domain name of your company, such as example.com, to prevent collisions with other annotations that might have the same name.)
You can regularly query the cluster for all resources that do not have an owner annotation and make a list of them for potential termination. An especially strict policy might terminate all unowned resources immediately. Don’t be too strict, though, especially at first: developer goodwill is as important a resource as cluster capacity, if not more so.
Best Practice
Set owner annotations on all your resources, giving information about who to contact if there’s a problem with this resource, or if it seems abandoned and liable for termination.
Finding underutilized resources
Some resources may be receiving very low levels of traffic, or none at all. Perhaps they became disconnected from a Service front end due to a change in labels, or maybe they were temporary or experimental.
Every Pod should expose the number of requests it receives as a metric (see Chapter 16 for more about this). Use these metrics to find Pods that are getting low or zero traffic, and make a list of resources that can potentially be terminated.
You can also check the CPU and memory utilization figures for each Pod in your web console and find the least-utilized Pods in your cluster. Pods which don’t do anything probably aren’t a good use of resources.
If the Pods have owner metadata, contact their owners to find out whether these Pods are actually needed (for example, they might be for an application still in development).
You could use another custom Kubernetes annotation (perhaps example.com/lowtraffic) to identify Pods that receive no requests, but are still needed for one reason or another.
Best Practice
Regularly review your cluster to find underutilized or abandoned resources and eliminate them. Owner annotations can help.
Cleaning up completed Jobs
Kubernetes Jobs (see “Jobs”) are Pods that run once to completion and are not restarted. However, the Job objects still exist in the Kubernetes database, and once there are a significant number of completed Jobs, this can affect API performance. A handy tool for cleaning up completed Jobs is kube-job-cleaner.
Checking Spare Capacity
There should always be enough spare capacity in the cluster to handle the failure of a single worker node. To check this, try draining your biggest node (see “Scaling down”). Once all Pods have been evicted from the node, check that all your applications are still in a working state with the configured number of replicas. If this is not the case, you need to add more capacity to the cluster.
If there isn’t room to reschedule its workloads when a node fails, your services could be degraded at best, and unavailable at worst.
Using Reserved Instances
Some cloud providers offer different instance classes depending on the machine’s life cycle. Reserved instances offer a trade-off between price and flexibility.
For example, AWS reserved instances are about half the price of on-demand instances (the default type). You can reserve instances for various periods: a year, three years, and so on. AWS reserved instances have a fixed size, so if it turns out in three months time that you need a larger instance, your reservation will be mostly wasted.
The Google Cloud equivalent of reserved instances is Committed Use Discounts, which allow you to prepay for a certain number of vCPUs and an amount of memory. This is more flexible than AWS reservations, as you can use more resources than you have reserved; you just pay the normal on-demand price for anything not covered by your reservation.
Reserved instances and committed use discounts can be a good choice when you know your requirements for the foreseeable future. However, there’s no refund for reservations that you don’t end up using, and you have to pay up front for the whole reservation period. So you should only choose to reserve instances for a period over which your requirements aren’t likely to change significantly.
If you can plan a year or two ahead, however, using reserved instances could deliver a considerable saving.
Best Practice
Use reserved instances when your needs aren’t likely to change for a year or two—but choose your reservations wisely, because they can’t be altered or refunded once they’re made.
Using Preemptible (Spot) Instances
Spot instances, as AWS calls them, or preemptible VMs in Google’s terminology, provide no availability guarantees, and are often limited in life span. Thus, they represent a trade-off between price and availability.
A spot instance is cheap, but may be paused or resumed at any time, and may be terminated altogether. Fortunately, Kubernetes is designed to provide high-availability services despite the loss of individual cluster nodes.
Variable price or variable preemption
Spot instances can therefore be a cost-effective choice for your cluster. With AWS spot instances, the per-hour pricing varies according to demand. When demand is high for a given instance type in a particular region and availability zone, the price will rise.
Google Cloud’s preemptible VMs, on the other hand, are billed at a fixed rate, but the rate of preemption varies. Google says that on average, about 5–15% of your nodes will be preempted in a given week. However, preemptible VMs can be up to 80% cheaper than on-demand, depending on the instance type.
Preemptible nodes can halve your costs
Using preemptible nodes for your Kubernetes cluster, then, can be a very effective way to reduce costs. While you may need to run a few more nodes to make sure that your workloads can survive preemption, anecdotal evidence suggests that an overall 50% reduction in the cost per node is achievable.
You may also find that using preemptible nodes is a good way to build a little chaos engineering into your cluster (see “Chaos Testing”)—provided that your application is ready for chaos testing in the first place.
Bear in mind, though, that you should always have enough nonpreemptible nodes to handle your cluster’s minimum workload. Never bet more than you can afford to lose. If you have a lot of preemptible nodes, it might be a good idea to use cluster autoscaling to make sure any preempted nodes are replaced as soon as possible (see “Autoscaling”).
In theory, all your preemptible nodes could disappear at the same time. Despite the cost savings, therefore, it’s a good idea to limit your preemptible nodes to no more than, say, two-thirds of your cluster.
Best Practice
Keep costs down by using preemptible or spot instances for some of your nodes, but no more than you can afford to lose. Always keep some nonpreemptible nodes in the mix, too.
Using node affinities to control scheduling
You can use Kubernetes node affinities to make sure Pods that can’t tolerate failure are not scheduled on preemptible nodes (see “Node Affinities”).
For example, Google Kubernetes Engine preemptible nodes carry the label cloud.google.com/gke-preemptible. To tell Kubernetes to never schedule a Pod on one of these nodes, add the following to the Pod or Deployment spec:
affinity:nodeAffinity:requiredDuringSchedulingIgnoredDuringExecution:nodeSelectorTerms:-matchExpressions:-key:cloud.google.com/gke-preemptibleoperator:DoesNotExist
The requiredDuringScheduling... affinity is mandatory: a Pod with this affinity will never be scheduled on a node that matches the selector expression (known as a hard affinity).
Alternatively, you might want to tell Kubernetes that some of your less critical Pods, which can tolerate occasional failures, should preferentially be scheduled on preemptible nodes. In this case, you can use a soft affinity with the opposite sense:
affinity:nodeAffinity:preferredDuringSchedulingIgnoredDuringExecution:-preference:matchExpressions:-key:cloud.google.com/gke-preemptibleoperator:Existsweight:100
This effectively means “Please schedule this Pod on a preemptible node if you can; if not, it doesn’t matter.”
Best Practice
If you’re running preemptible nodes, use Kubernetes node affinities to make sure critical workloads are not preempted.
Keeping Your Workloads Balanced
We’ve talked about the work that the Kubernetes scheduler does, ensuring that workloads are distributed fairly, across as many nodes as possible, and trying to place replica Pods on different nodes for high availability.
In general, the scheduler does a great job, but there are some edge cases you need to watch out for.
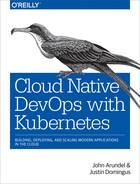
For example, suppose you have two nodes, and two services, A and B, each with two replicas. In a balanced cluster, there will be one replica of service A on each node, and one of service B on each node (Figure 5-1). If one node should fail, both A and B will still be available.
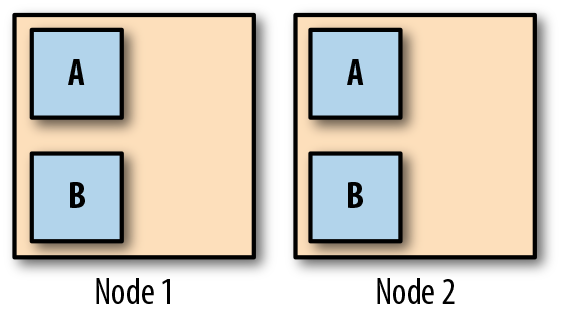
Figure 5-1. Services A and B are balanced across the available nodes
So far, so good. But suppose Node 2 does fail. The scheduler will notice that both A and B need an extra replica, and there’s only one node for it to create them on, so it does. Now Node 1 is running two replicas of service A, and two of service B.
Now suppose we spin up a new node to replace the failed Node 2. Even once it’s available, there will be no Pods on it. The scheduler never moves running Pods from one node to another.
We now have an unbalanced cluster, where all the Pods are on Node 1, and none are on Node 2 (Figure 5-2).
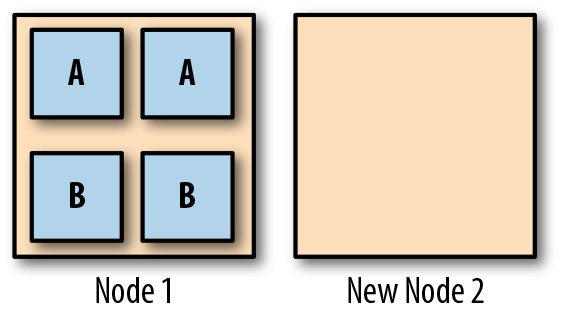
Figure 5-2. After the failure of Node 2, all replicas have moved to Node 1
But it gets worse. Suppose you deploy a rolling update to service A (let’s call the new version service A*). The scheduler needs to start two new replicas for service A*, wait for them to come up, and then terminate the old ones. Where will it start the new replicas? On the new Node 2, because it’s idle, while Node 1 is already running four Pods. So two new service A* replicas are started on Node 2, and the old ones removed from Node 1 (Figure 5-3).
Figure 5-3. After the rollout of service A*, the cluster is still unbalanced
Now you’re in a bad situation, because both replicas of service B are on the same node (Node 1), while both replicas of service A* are also on the same node (Node 2). Although you have two nodes, you have no high availability. The failure of either Node 1 or Node 2 will result in a service outage.
The key to this problem is that the scheduler never moves Pods from one node to another unless they are restarted for some reason. Also, the scheduler’s goal of placing workloads evenly across nodes is sometimes in conflict with maintaining high availability for individual services.
One way around this is to use a tool called Descheduler. You can run this tool every so often, as a Kubernetes Job, and it will do its best to rebalance the cluster by finding Pods that need to be moved, and killing them.
Descheduler has various strategies and policies that you can configure. For example, one policy looks for underutilized nodes, and kills Pods on other nodes to force them to be rescheduled on the idle nodes.
Another policy looks for duplicate Pods, where two or more replicas of the same Pod are running on the same node, and evicts them. This fixes the problem that arose in our example, where workloads were nominally balanced, but in fact neither service was highly available.
Summary
Kubernetes is pretty good at running workloads for you in a reliable, efficient way with no real need for manual intervention. Providing you give the scheduler accurate estimates of your containers’ resource needs, you can largely leave Kubernetes to get on with it.
The time you would have spent fixing operations issues can thus be put to better use, like developing applications. Thanks, Kubernetes!
Understanding how Kubernetes manages resources is key to building and running your cluster correctly. The most important points to take away:
-
Kubernetes allocates CPU and memory resources to containers on the basis of requests and limits.
-
A container’s requests are the minimum amounts of resources it needs to run. Its limits specify the maximum amount it’s allowed to use.
-
Minimal container images are faster to build, push, deploy, and start. The smaller the container, the fewer the potential security vulnerabilities.
-
Liveness probes tell Kubernetes whether the container is working properly. If a container’s liveness probe fails, it will be killed and restarted.
-
Readiness probes tell Kubernetes that the container is ready and able to serve requests. If the readiness probe fails, the container will be removed from any Services that reference it, disconnecting it from user traffic.
-
PodDisruptionBudgets let you limit the number of Pods that can be stopped at once during evictions, preserving high availability for your application.
-
Namespaces are a way of logically partitioning your cluster. You might create a namespace for each application, or group of related applications.
-
To refer to a Service in another namespace, you can use a DNS address like this:
SERVICE.NAMESPACE. -
ResourceQuotas let you set overall resource limits for a given namespace.
-
LimitRanges specify default resource requests and limits for containers in a namespace.
-
Set resource limits so that your applications almost, but don’t quite exceed them in normal usage.
-
Don’t allocate more cloud storage than you need, and don’t provision high-bandwidth storage unless it’s critical for your application’s performance.
-
Set owner annotations on all your resources, and scan the cluster regularly for unowned resources.
-
Find and clean up resources that aren’t being used (but check with their owners).
1 It’s possible to customize this behavior for individual containers using Quality of Service (QoS) classes.
2 You can customize this behavior by adjusting the kubelet garbage collection settings.