
13 Observability and monitoring
- Logging with Spring Boot, Loki, and Fluent Bit
- Using health probes with Spring Boot Actuator and Kubernetes
- Producing metrics with Spring Boot Actuator, Prometheus, and Grafana
- Configuring distributed tracing with OpenTelemetry and Tempo
- Managing applications with Spring Boot Actuator
In the previous chapters, you learned about several patterns and technologies you can use to build secure, scalable, and resilient applications. However, we still lack visibility into the Polar Bookshop system, especially when something goes wrong. Before going to production, we should ensure our applications are observable and that the deployment platform provides all the tools needed to monitor and gain insights into the system.
Monitoring involves checking the telemetry available for the application and defining alerts for known failure states. Observability goes beyond that and aims at reaching a state where we can ask arbitrary questions about the system without knowing the question in advance. The product team should ensure their applications expose relevant information; and the platform team should provide an infrastructure for consuming that information and asking questions about their operations.
As you’ll remember from chapter 1, observability is one of the properties of cloud native applications. Observability is a measure of how well we can infer the internal state of an application from its outputs. In chapter 2, you learned about the 15-Factor methodology, which contains two factors that help build observable applications. Factor 14 suggests treating your applications as space probes and reasoning about what kind of telemetry you’d need to monitor and control your applications remotely, such as logs, metrics, and traces. Factor 6 recommends treating logs as a stream of events rather than dealing with log files.
In this chapter, you’ll learn how to ensure your Spring Boot applications expose relevant information to infer their internal states, such as logs, health probes, metrics, traces, and additional valuable data regarding schema migrations and builds. I’ll also show you how to use the Grafana open source observability stack to validate the changes you’ll make to your applications. However, I won’t go into too many details, because that’s something the platform team deploys and operates.
Note The source code for the examples in this chapter is available in the Chapter13/13-begin and Chapter13/13-end folders, which contain the initial and final states of the project (https://github.com/ThomasVitale/cloud-native-spring-in-action).
13.1 Logging with Spring Boot, Loki, and Fluent Bit
Logs (or event logs) are discrete records of something that happened over time in a software application. They are composed of a timestamp necessary to answer the question “when did the event happen?” and some information providing details about the event and its context, which lets us answer questions like “what happened at this time?”, “which thread was processing the event?”, or “which user/tenant was in the context?”
During troubleshooting and debugging tasks, logs are among the essential tools we can use to reconstruct what happened at a specific point in time in a single application instance. They’re usually categorized according to the type or severity of the event, such as trace, debug, info, warn, and error. It’s a flexible mechanism that lets us log only the most severe events in production while still giving us the chance to change the log level temporarily during debugging.
The format of a log record can vary, going from simple plain text to a more organized collection of key/value pairs to fully structured records produced in a JSON format.
Traditionally we’ve configured logs to be printed out in files located on the host machine, which has resulted in applications dealing with filename conventions, file rotation, and file sizes. In the cloud we follow the 15-Factor methodology, which recommends treating logs as events streamed to the standard output. Cloud native applications stream logs and are not concerned with how they are processed or stored.
This section will teach you how to add and configure logs in Spring Boot applications. Then I’ll explain how logs are collected and aggregated in a cloud native infrastructure. Finally, you’ll run Fluent Bit for log collection, run Loki for log aggregation, and use Grafana to query the logs produced by your Spring Boot applications.
13.1.1 Logging with Spring Boot
Spring Boot comes with built-in support and auto-configuration for the most common logging frameworks, including Logback, Log4J2, Commons Logging, and Java Util Logging. By default, Logback is used (https://logback.qos.ch), but you can easily replace it with another library thanks to the abstraction provided by the Simple Logging Facade for Java (SLF4J).
Using the interfaces from SLF4J (www.slf4j.org), you have the freedom to change the logging library without changing your Java code. Furthermore, cloud native applications should treat logs as events and stream them to the standard output. That’s precisely what Spring Boot does out of the box. Convenient, right?
Configuring logging in Spring Boot
Event logs are categorized by level with decreasing details and increasing importance: trace, debug, info, warn, error. By default, Spring Boot logs everything from the info level up.
A logger is a class that produces log events. You can set logger levels through configuration properties, with options to apply global configurations or to target specific packages or classes. For example, in chapter 9 we set a debug logger to get more details about the circuit breakers implemented with Resilience4J (in the application.yml file in the Edge Service project):
logging:
  level:
    io.github.resilience4j: debug     ❶
❶ Sets a debug logger for the Resilience4J library
You might need to configure multiple loggers at the same time. In that case, you can collect them in a log group and apply the configuration to the group directly. Spring Boot provides two predefined log groups, web and sql, but you can also define your own. For example, to better analyze the behavior of the circuit breakers defined in the Edge Service application, you could define a log group and configure a log level for both Resilience4J and Spring Cloud Circuit Breaker.
In the Edge Service project (edge-service), you can configure the new log group in the application.yml file as follows.
Listing 13.1 Configuring a group to control the circuit breaker logs
logging:
  group:
    circuitbreaker: io.github.resilience4j,
➥org.springframework.cloud.circuitbreaker     ❶
  level:
    circuitbreaker: info                       ❷
❶ Collects multiple loggers into a group to apply the same configuration
❷ Sets an “info” logger for both Resilience4J and Spring Cloud Circuit Breaker, which is easy to change if you need to debug the circuit breakers
By default, each event log provides essential information, including the date and time of the occurrence, the log level, the process identifier (PID), the name of the thread from which the event was triggered, the logger name, and the log message. If you check the application logs from a Terminal that supports ANSI, the log messages will also be colored to improve readability (figure 13.1). The logging format can be customized using the logging.pattern configuration property group.
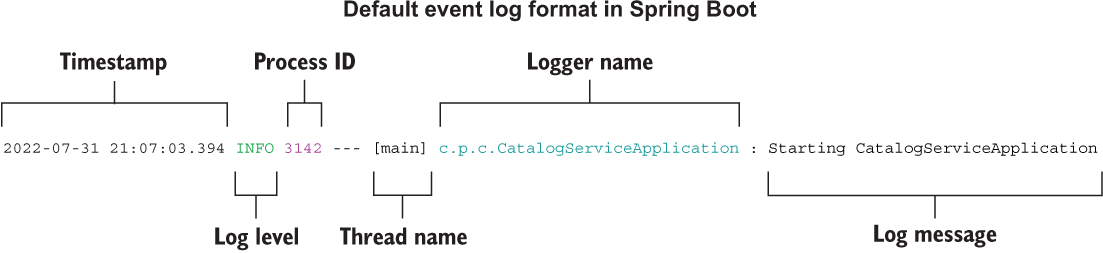
Figure 13.1 Event logs include a timestamp, contextual information, and a message about what happened.
Note Spring Boot provides extensive options for configuring logging to files. Since that’s not useful for cloud native applications, I won’t cover it in this book. If you’re interested in the subject, see the official documentation to learn more about log files (http://spring.io/projects/spring-boot).
Adding logs to Spring Boot applications
Besides configuring loggers for the frameworks and libraries used in your project, you should define event logs in your code whenever applicable. How much logging is enough? It depends on the context. In general, I reckon that it’s better to have too much logging than too little. I’ve seen many deployments that just contain changes to add more logging, while it’s pretty rare to see the opposite.
Thanks to the SLF4J façade, the syntax for defining new event logs in Java is the same no matter which logging library you use: a Logger instance created from a LoggerFactory. Let’s see how it works by adding new log messages to the web controller in Catalog Service.
In the Catalog Service project (catalog-service), go to the BookController class, define a Logger instance from SLF4J, and add messages to be printed out whenever a client calls the application’s REST API.
Listing 13.2 Defining log events using SL4FJ
package com.polarbookshop.catalogservice.web;

import org.slf4j.Logger;
import org.slf4j.LoggerFactory;
...

@RestController
@RequestMapping("books")
public class BookController {
  private static final Logger log =
    LoggerFactory.getLogger(BookController.class);     ❶
  private final BookService bookService;

  @GetMapping
  public Iterable<Book> get() {
    log.info(                                          ❷
      "Fetching the list of books in the catalog"
    );
    return bookService.viewBookList();
  }

  ...
}
❶ Defines a logger for the BookController class
❷ Logs the given message at the “info” level
Note Go ahead and define new loggers and log events for all the applications composing the Polar Bookshop system wherever it makes sense. As a reference, you can look at the source code repository accompanying this book (Chapter13/13-end).
Now that our applications log messages as an event stream, we need to collect and store them in a central place that we can query. The following section will provide a solution to accomplish that.
13.1.2 Managing logs with Loki, Fluent Bit, and Grafana
When you move to distributed systems like microservices and complex environments like the cloud, managing logs becomes challenging and requires a different solution than in more traditional applications. If something goes wrong, where can we find data about the failure? Traditional applications would rely on log files stored on the host machine. Cloud native applications are deployed in dynamic environments, are replicated, and have different life spans. We need to collect the logs from all applications running in the environment and send them to a central component where they can be aggregated, stored, and searched.
There are plenty of options for managing logs in the cloud. Cloud providers have their own offerings, like Azure Monitor Logs and Google Cloud Logging. There are also many enterprise solutions available on the market, such as Honeycomb, Humio, New Relic, Datadog, and Elastic.
For Polar Bookshop, we’ll use a solution based on the Grafana observability stack (https://grafana.com). It’s composed of open source technologies, and you can run it yourself in any environment. It’s also available as a managed service (Grafana Cloud) offered by Grafana Labs.
The components of the Grafana stack we’ll use for managing logs are Loki for log storage and search, Fluent Bit for log collection and aggregation, and Grafana for log data visualization and querying.
Note Which technology you use for managing logs is a platform choice and shouldn’t impact the applications at all. For example, you should be able to replace the Grafana stack with Humio without making any changes to the Polar Bookshop applications.
We need a log collector to fetch log messages from the standard output of all the running applications. Using the Grafana stack, you’re free to choose a log collector from among several options. For the Polar Bookshop system, we’ll use Fluent Bit, an open source and CNCF-graduated project that “enables you to collect logs and metrics from multiple sources, enrich them with filters, and distribute them to any defined destination” (https://fluentbit.io). Fluent Bit is a subproject of Fluentd, “an open source data collector for unified logging layer” (www.fluentd.org).
Fluent Bit will collect logs from all running containers and forward them to Loki, which will store them and make them searchable. Loki is “a log aggregation system designed to store and query logs from all your applications and infrastructure” (https://grafana.com/oss/loki).
Finally, Grafana will use Loki as a data source and provide log visualization features. Grafana “allows you to query, visualize, alert on and understand” your telemetry, no matter where it is stored (https://grafana.com/oss/grafana). Figure 13.2 illustrates this logging architecture.
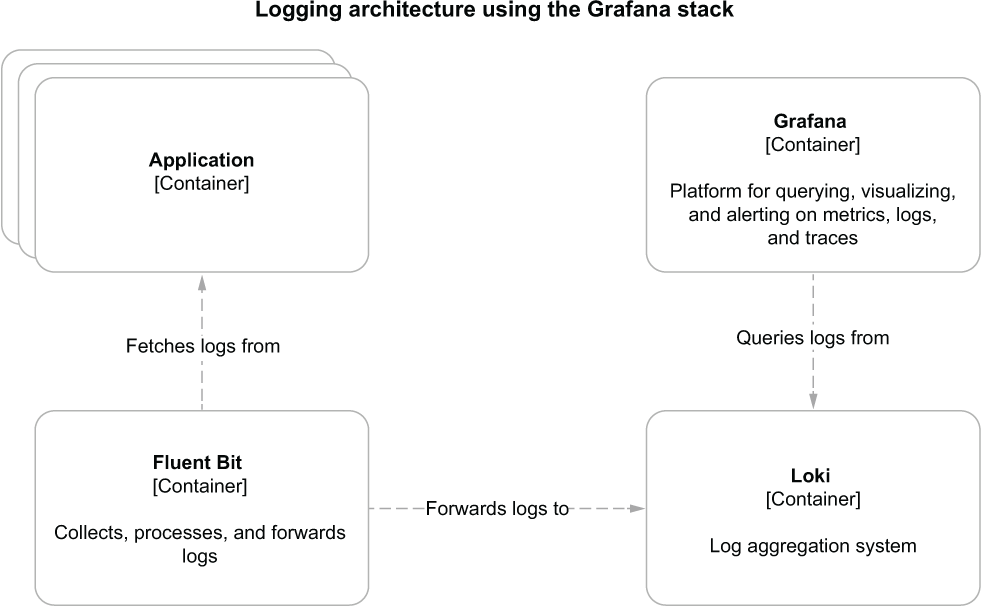
Figure 13.2 Logging architecture for cloud native applications based on the Grafana stack
Let’s start by running Grafana, Loki, and Fluent Bit as containers. In your Polar Deployment project (polar-deployment), update the Docker Compose configuration (docker/docker-compose.yml) to include the new services. They are configured through files I have included in the source code repository accompanying this book (Chapter13/13-end/polar-deployment/docker/observability). Copy the observability folder over the same path in your own project.
Listing 13.3 Defining containers for Grafana, Loki, and Fluent Bit
version: "3.8"
services:
  ...

  grafana:
    image: grafana/grafana:9.1.2
    container_name: grafana
    depends_on:
      - loki
    ports:
      - "3000:3000"
    environment:                                               ❶
      - GF_SECURITY_ADMIN_USER=user
      - GF_SECURITY_ADMIN_PASSWORD=password
    volumes:                                                   ❷
      - ./observability/grafana/datasource.yml:/etc/grafana/provisioning/
➥datasources/datasource.yml
      - ./observability/grafana/dashboards:/etc/grafana/provisioning/
➥dashboards
      - ./observability/grafana/grafana.ini:/etc/grafana/grafana.ini
  loki:
    image: grafana/loki:2.6.1
    container_name: loki
    depends_on:
      - fluent-bit
    ports:
      - "3100:3100"

  fluent-bit:
    image: grafana/fluent-bit-plugin-loki:2.6.1-amd64
    container_name: fluent-bit
    ports:
      - "24224:24224"
    environment:
      - LOKI_URL=http://loki:3100/loki/api/v1/push           ❸
    volumes:                                                 ❹
      - ./observability/fluent-bit/fluent-bit.conf:/fluent-bit/etc/
➥fluent-bit.conf
❶ Username and password to access Grafana
❷ Volumes are used to load configuration for data sources and dashboards.
❸ Defines the Loki URL used to forward log messages
❹ Volumes are used to load configuration for collecting and delivering logs.
Next, start all three containers with the following command:
$ docker-compose up -d grafana
Thanks to the dependencies defined in Docker Compose between containers, starting Grafana will also run Loki and Fluent Bit.
Fluent Bit can be configured to collect logs from different sources. For Polar Bookshop we’ll rely on the Fluentd driver available in Docker to collect logs automatically from running containers. The Docker platform itself listens to the log events from each container and routes them to the specified service. In Docker, a logging driver can be configured directly on a container. For example, update the Catalog Service configuration in Docker Compose to use the Fluentd logging driver, which will send the logs over to the Fluent Bit container.
Listing 13.4 Using Fluentd driver to route container logs to Fluent Bit
version: "3.8"
services:
  ...

  catalog-service:
    depends_on:
      - fluent-bit                                        ❶
      - polar-keycloak
      - polar-postgres
    image: "catalog-service"
    container_name: "catalog-service"
    ports:
      - 9001:9001
      - 8001:8001
    environment:
      - BPL_JVM_THREAD_COUNT=50
      - BPL_DEBUG_ENABLED=true
      - BPL_DEBUG_PORT=8001
      - SPRING_CLOUD_CONFIG_URI=http://config-service:8888
      - SPRING_DATASOURCE_URL=
➥jdbc:postgresql://polar-postgres:5432/polardb_catalog
      - SPRING_PROFILES_ACTIVE=testdata
      - SPRING_SECURITY_OAUTH2_RESOURCESERVER_JWT_ISSUER_URI=
➥http://host.docker.internal:8080/realms/PolarBookshop
    logging:                                             ❷
      driver: fluentd                                    ❸
      options:
        fluentd-address: 127.0.0.1:24224                 ❹
❶ Ensures the Fluent Bit container is started before Catalog Service
❷ Section to configure the container logging driver
❹ The address of the Fluent Bit instance where the logs should be routed
Next, package Catalog Service as a container image (./gradlew bootBuildImage), and run the application container as follows:
$ docker-compose up -d catalog-service
Thanks to the dependencies defined in Docker Compose between containers, Keycloak and PostgreSQL will automatically be started as well.
Now we’re ready to test the logging setup. First, send a few requests to Catalog Service to trigger the generation of some log messages:
$ http :9001/books
Next, open a browser window, head to Grafana (http://localhost:3000), and use the credentials configured in Docker Compose to log in (user/password). Then select the Explore page from the left menu, choose Loki as the data source, choose Last 1 Hour from the time drop-down menu, and run the following query to search for all the logs produced by the catalog-service container:
{container_name="/catalog-service"}The result should be similar to what you can see in figure 13.3, showing the logs from application startup as well as the custom log messages you added to the BookController class.
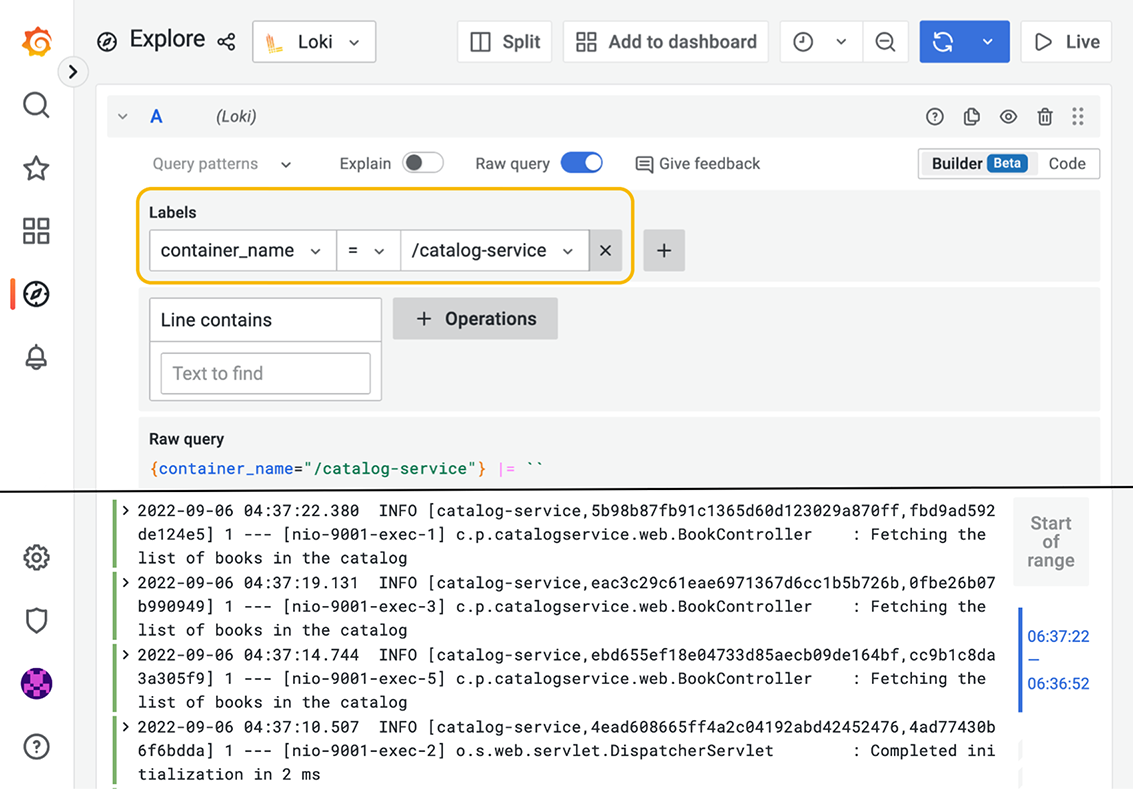
Figure 13.3 In Grafana, you can browse and search log messages aggregated and stored by Loki.
When you’re done testing the logging setup, stop all containers with docker-compose down.
Note Following the same approach, update the Docker Compose configuration for all the other Spring Boot applications in the Polar Bookshop system to use the Fluentd logging driver and rely on Fluent Bit for collecting logs. As a reference, you can look at the source code repository accompanying this book (Chapter13/13-end/polar-deployment/docker).
Logs provide some information about how an application behaves, but they’re not enough to infer its internal state. The next section will cover how you can make applications expose more data about their health status.
13.2 Health probes with Spring Boot Actuator and Kubernetes
Once an application is deployed, how can we tell if it’s healthy? Is it capable of handling new requests? Did it enter a faulty state? Cloud native applications should provide information about their health so that monitoring tools and deployment platforms can detect when there’s something wrong and act accordingly. We need dedicated health endpoints to check on the status of the application and any components or services it might use.
The deployment platform can periodically invoke health endpoints exposed by applications. A monitoring tool could trigger an alert or a notification when an application instance is unhealthy. In the case of Kubernetes, the platform will check the health endpoints and automatically replace the faulty instance or temporarily stop sending traffic to it until it’s ready to handle new requests again.
For Spring Boot applications, you can leverage the Actuator library to expose information about their health through a /actuator/health HTTP endpoint, including details about the application’s status and the components in use, like databases, event brokers, and config servers.
Spring Boot Actuator is a useful library, providing many endpoints for monitoring and managing Spring Boot applications. Such endpoints can be exposed through HTTP or JMX, but either way we must protect them from unauthorized access. We’ll limit ourselves to using the HTTP endpoints, so we can use Spring Security to define access policies like those for any other endpoint we’ve worked with so far.
This section will cover configuring health endpoints in Spring Boot applications using Actuator. You’ll then see how you can define liveness and readiness probes so Kubernetes can use its self-healing functionality.
13.2.1 Defining health probes for Spring Boot applications using Actuator
First of all, open the build.gradle file in the Catalog Service project (catalog-service), and ensure that it contains a dependency on Spring Boot Actuator (we used it in chapter 4 for refreshing configuration at runtime).
Listing 13.5 Adding dependency for Spring Boot Actuator in Catalog Service
dependencies {
  ...
  implementation 'org.springframework.boot:spring-boot-starter-actuator'
}
There are a few viable solutions for protecting the Spring Boot Actuator endpoints. For example, you could enable HTTP Basic authentication just for the Actuator endpoints, while all the others will keep using OpenID Connect and OAuth2. For simplicity, in the Polar Bookshop system, we’ll keep the Actuator endpoints unauthenticated from inside the Kubernetes cluster and block any access to them from the outside (as you’ll see in chapter 15).
Warning In a real production scenario, I would recommend protecting access to the Actuator endpoints even from within the cluster.
Go to the SecurityConfig class of your Catalog Service project and update the Spring Security configuration to allow unauthenticated access to the Spring Boot Actuator endpoints.
Listing 13.6 Allowing unauthenticated access to the Actuator endpoints
@EnableWebSecurity
public class SecurityConfig {

  @Bean
  SecurityFilterChain filterChain(HttpSecurity http) throws Exception {
    return http
     .authorizeHttpRequests(authorize -> authorize
       .mvcMatchers("/actuator/**").permitAll()                     ❶
       .mvcMatchers(HttpMethod.GET, "/", "/books/**").permitAll()
       .anyRequest().hasRole("employee")
     )
     .oauth2ResourceServer(OAuth2ResourceServerConfigurer::jwt)
     .sessionManagement(sessionManagement -> sessionManagement
       .sessionCreationPolicy(SessionCreationPolicy.STATELESS))
     .csrf(AbstractHttpConfigurer::disable)
     .build();
  }
}
❶ Allows unauthenticated access to any Spring Boot Actuator endpoint
Finally, open the application.yml file in your Catalog Service project (catalog-service), and configure Actuator to expose the health HTTP endpoint. If you followed the examples in chapter 4, you might have an existing configuration for the refresh endpoint. In that case, go ahead and replace it with the health endpoint.
Listing 13.7 Exposing the health Actuator endpoint
management:
  endpoints:
    web:
      exposure:
        include: health      ❶
❶ Exposes the /actuator/health endpoint via HTTP
Let’s check the result. First we need to run all the backing services used by Catalog Service: Config Service, Keycloak, and PostgreSQL. We’ll run them as containers. Package Config Service as a container image (./gradlew bootBuildImage). Then open a Terminal window, navigate to the folder where you keep your Docker Compose file (polar-deployment/docker), and run the following command:
$ docker-compose up -d config-service polar-postgres polar-keycloak
After ensuring that all the containers are ready, run Catalog Service on the JVM (./gradlew bootRun), open a Terminal window, and send an HTTP GET request to the health endpoint:
$ http :9001/actuator/health
The endpoint will return the overall health status for the Catalog Service application, which can be one of UP, OUT_OF_SERVICE, DOWN, or UNKNOWN. When the health status is UP, the endpoint returns a 200 OK response. If it’s not, it produces a 503 Service Unavailable response.
{
  "status": "UP"
}
By default, Spring Boot Actuator only returns the overall health status. Through application properties, however, you can make it provide more specific information regarding several components used by the application. To better protect access to this kind of information, you can enable showing health details and components always (always) or only when the request is authorized (when_authorized). Since we’re not protecting the Actuator endpoints at the application level, let’s make the extra information always available.
Listing 13.8 Configuring the health endpoint to expose more information
management:
  endpoints:
    web:
      exposure:
        include: health
  endpoint:
    health:
      show-details: always      ❶
      show-components: always   ❷
❶ Always shows details about the application’s health
❷ Always shows information about the components used by the application
Once again, rerun Catalog Service (./gradlew bootRun), and send an HTTP GET request to http://localhost:9001/actuator/health. This time, the resulting JSON object contains more detailed information about the application’s health. Here’s a partial result as an example.
{
  "components": {              ❶
    "clientConfigServer": {
      "details": {
        "propertySources": [
          "configserver:https://github.com/PolarBookshop/
➥config-repo/catalog-service.yml",
          "configClient"
        ]
      },
      "status": "UP"
    },
    "db": {
      "details": {
        "database": "PostgreSQL",
        "validationQuery": "isValid()"
      },
      "status": "UP"
    },
    ...
  },
  "status": "UP"               ❷
}
❶ Detailed health information about components and features used by the application
❷ Overall application health status
The generic health endpoint provided by Spring Boot Actuator is useful for monitoring and configuring alerts or notifications, since it contains details regarding both the application and the integration with its backing services. In the next section, you’ll see how to expose more specific information that’s used by a deployment platform like Kubernetes to manage containers.
Before moving on, stop the application process (Ctrl-C), but keep all the current containers running. You’ll need them soon!
13.2.2 Configuring health probes in Spring Boot and Kubernetes
Besides showing detailed information about the application’s health, Spring Boot Actuator automatically detects when the application runs on a Kubernetes environment and enables the health probes to return liveness (/actuator/health/liveness) and readiness (/actuator/health/readiness) states, as illustrated in figure 13.4:
-
Liveness state—When an application is not live, this means it has entered a faulty internal state from which it won’t recover. By default, Kubernetes will try restarting it to fix the problem.
-
Readiness state—When an application is not ready, this means it can’t process new requests, either because it’s still initializing all its components (during the startup phase) or because it’s overloaded. Kubernetes will stop forwarding requests to that instance until it’s ready to accept new requests again.
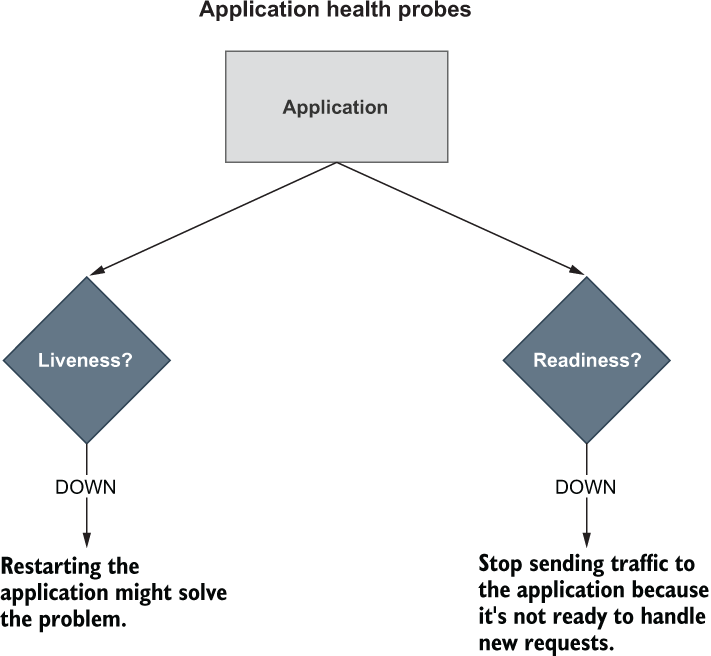
Figure 13.4 Kubernetes uses liveness and readiness probes to accomplish its self-healing features in case of failures.
Customizing liveness and readiness probes
To extend support for the health probes in any environment, you can configure Spring Boot Actuator through the dedicated properties. Open the Catalog Service project (catalog-service), and update the application.yml file as follows.
Listing 13.9 Enabling liveness and readiness probes in any environment
management:
  endpoints:
    web:
      exposure:
        include: health
  endpoint:
    health:
      show-details: always
      show-components: always
      probes:
        enabled: true    ❶
❶ Enables support for the health probes
Let’s check the result. All the backing services for Catalog Service should be up and running on Docker from the previous section. If not, go back and follow the instructions to start them all (docker-compose up -d config-service polar-postgres polar-keycloak). Then run Catalog Service on the JVM (./gradlew bootRun), and invoke the endpoint for the liveness probe:
$ http :9001/actuator/health/liveness
{
  "status": "UP"
}
The liveness state of a Spring Boot application indicates whether it’s in a correct or broken internal state. If the Spring application context has started successfully, the internal state is valid. It doesn’t depend on any external components. Otherwise, it will cause cascading failures, since Kubernetes will try to restart the broken instances.
Finally, check the result for the readiness probe endpoint:
$ http :9001/actuator/health/readiness
{
  "status": "UP"
}
The readiness state of a Spring Boot application indicates whether it’s ready to accept traffic and process new requests. During the startup phase or graceful shutdown, the application is not ready and will refuse any requests. It might also become temporarily not ready if, at some point, it’s overloaded. When it’s not ready, Kubernetes will not send any traffic to the application instance.
When you’re done testing the health endpoints, stop the application (Ctrl-C) and the containers (docker-compose down).
Note Go ahead and add Spring Boot Actuator to all the applications composing the Polar Bookshop system. In Order Service and Edge Service, remember to configure unauthenticated access to the Actuator endpoints in the SecurityConfig class, as we did for Catalog Service. In Dispatcher Service you’ll also need to add a dependency on Spring WebFlux (org.springframework.boot:spring-boot-starter-webflux) because Actuator needs a web server configured to serve its endpoints over HTTP. Then configure the health endpoints for all the applications, as you learned in this section. As a reference, you can look at the source code repository accompanying this book (Chapter13/13-end).
By default, the readiness probe in Spring Boot doesn’t depend on any external components. You can decide whether any external systems should be included in the readiness probe.
For example, Catalog Service is an external system for Order Service. Should you include it in the readiness probe? Since Order Service adopts resilience patterns to deal with the scenario where Catalog Service is unavailable, you should keep Catalog Service out of the readiness probe. When it’s not available, Order Service will keep working correctly, but with graceful functionality degradation.
Let’s consider another example. Edge Service depends on Redis for storing and retrieving web session data. Should you include it in the readiness probe? Since Edge Service can’t process any new requests without accessing Redis, including Redis in the readiness probe might be a good idea. Spring Boot Actuator will consider both the internal state of the application and the integration with Redis to determine whether the application is ready to accept new requests.
In the Edge Service project (edge-service), open the application.yml file, and define which indicators to use in the readiness probe: the application standard readiness state and the Redis health status. I’ll assume you have already added Spring Boot Actuator to Edge Service and configured the health endpoints as described earlier.
Listing 13.10 Including Redis in the computation of the readiness state
management:
  endpoints:
    web:
      exposure:
        include: health
  endpoint:
    health:
      show-details: always
      show-components: always
      probes:
        enabled: true
      group:
        readiness:
          include: readinessState,redis     ❶
❶ The readiness probe will combine the application’s readiness state and Redis’s availability.
Configuring liveness and readiness probes in Kubernetes
Kubernetes relies on the health probes (liveness and readiness) to accomplish its tasks as a container orchestrator. For example, when the desired state of an application is to have three replicas, Kubernetes ensures there are always three application instances running. If any of them doesn’t return a 200 response from the liveness probe, Kubernetes will restart it. When starting or upgrading an application instance, we’d like the process to happen without downtime for the user. Therefore, Kubernetes will not enable an instance in the load balancer until it’s ready to accept new requests (when Kubernetes gets a 200 response from the readiness probe).
Since liveness and readiness information is application-specific, Kubernetes needs the application itself to declare how to retrieve that information. Relying on Actuator, Spring Boot applications provide liveness and readiness probes as HTTP endpoints. Let’s see how we can configure Kubernetes to use those endpoints for the health probes.
In your Catalog Service project (catalog-service), open the Deployment manifest (k8s/deployment.yml), and update it with configuration for liveness and readiness probes as follows.
Listing 13.11 Configuring liveness and readiness probes for Catalog Service
apiVersion: apps/v1
kind: Deployment
metadata:
  name: catalog-service
  ...
spec:
  ...
  template:
    ...
    spec:
      containers:
        - name: catalog-service
          image: catalog-service
          ...
          livenessProbe:                          ❶
            httpGet:                              ❷
              path: /actuator/health/liveness     ❸
              port: 9001                          ❹
            initialDelaySeconds: 10               ❺
            periodSeconds: 5                      ❻
          readinessProbe:                         ❼
            httpGet:
              path: /actuator/health/readiness
              port: 9001
            initialDelaySeconds: 5
            periodSeconds: 15
❶ Configuration for the liveness probe
❷ Uses an HTTP GET request to get the liveness state
❸ The endpoint to call for the liveness state
❹ The port to use to fetch the liveness state
❺ An initial delay before starting checking the liveness state
❻ The frequency for checking the liveness state
❼ Configuration for the readiness probe
Both probes can be configured so that Kubernetes will start using them after an initial delay (initialDelaySeconds), and you can also define the frequency with which to invoke them (periodSeconds). The initial delay should consider that the application will take a few seconds to start, and it will depend on the available computational resources. The polling period should not be too long, to reduce the time between the application instance entering a faulty state and the platform taking action to self-heal.
Warning If you run these examples on resource-constrained environments, you might need to adjust the initial delay and the polling frequency to allow the application more time to start and get ready to accept requests. You might need to do the same when running these examples on Apple Silicon computers until ARM64 support is part of Paketo Buildpacks (you can follow the updates here: https://github.com/paketo-buildpacks/stacks/issues/51). That’s because AMD64 container images are run on the Apple Silicon computers (ARM64) through a compatibility layer based on Rosetta, which impacts application startup time.
Go ahead and configure the liveness and readiness probes in the Deployment manifests for all the applications composing the Polar Bookshop system. As a reference, you can look at the source code repository accompanying this book (Chapter13/13-end).
On top of event logs, health information improves the information we can infer about the application’s internal state, but it’s not enough to achieve complete visibility. The following section will introduce the concept of metrics and how we can configure them in Spring Boot.
13.3 Metrics and monitoring with Spring Boot Actuator, Prometheus, and Grafana
To properly monitor, manage, and troubleshoot an application running in production, we need to be able to answer questions like “how much CPU and RAM is the application consuming?”, “how many threads are used over time?”, and “what’s the rate of failing requests?” Event logs and health probes can’t help us answer those questions. We need something more. We need more data.
Metrics are numeric data about the application, measured and aggregated in regular time intervals. We use metrics to track the occurrence of an event (such as an HTTP request being received), count items (such as the number of allocated JVM threads), measure the time taken to perform a task (such as the latency of a database query), or get the current value of a resource (such as current CPU and RAM consumption). This is all valuable information for understanding why an application behaves in a certain way. You can monitor metrics and set alerts or notifications for them.
Spring Boot Actuator collects application metrics out of the box by leveraging the Micrometer library (https://micrometer.io). Micrometer contains instrumentation code for collecting valuable metrics from common components in a JVM-based application. It provides a vendor-neutral façade so that you can export the metrics collected from Micrometer using different formats, such as Prometheus/Open Metrics, Humio, Datadog, and VMware Tanzu Observability. Just as SLF4J provides a vendor-neutral façade for logging libraries, Micrometer does the same for metrics exporters.
On top of the default Micrometer instrumentation libraries that are configured by Spring Boot, you can import additional instrumentation to collect metrics from specific libraries like Resilience4J or even define your own without vendor lock-in.
The most common format for exporting metrics is the one used by Prometheus, which is “an open-source systems monitoring and alerting toolkit” (https://prometheus.io). Just as Loki aggregates and stores event logs, Prometheus does the same with metrics.
In this section you’ll see how to configure metrics in Spring Boot. Then you’ll use Prometheus to aggregate metrics and Grafana to visualize them in dashboards.
13.3.1 Configuring metrics with Spring Boot Actuator and Micrometer
Spring Boot Actuator auto-configures Micrometer out of the box to collect metrics about a Java application. One way of exposing such metrics is by enabling the /actuator/metrics HTTP endpoint implemented by Actuator. Let’s see how to do that.
In your Catalog Service project (catalog-service), update the application.yml file to expose the metrics endpoint via HTTP.
Listing 13.12 Exposing the metrics Actuator endpoint
management:
  endpoints:
    web:
      exposure:
        include: health, metrics      ❶
❶ Exposes both health and metrics endpoints
Ensure the backing services required by Catalog Service are up and running with the following command:
$ docker-compose up -d polar-keycloak polar-postgres
Then run the application (./gradlew bootRun), and call the /actuator/metrics endpoint:
$ http :9001/actuator/metrics
The result is a collection of metrics you can further explore by adding the name of a metric to the endpoint (for example, /actuator/metrics/jvm.memory.used).
Micrometer provides the instrumentation to generate those metrics, but you might want to export them in a different format. After deciding which monitoring solution you’d like to use to collect and store the metrics, you’ll need to add a specific dependency on that tool. In the Grafana observability stack, that tool is Prometheus.
In the Catalog Service project (catalog-service), update the build.gradle file with a dependency on the Micrometer library that provides integration with Prometheus. Remember to refresh or reimport the Gradle dependencies after the new addition.
Listing 13.13 Adding dependency for Micrometer Prometheus
dependencies {
  ...
  runtimeOnly 'io.micrometer:micrometer-registry-prometheus'
}
Then update the application.yml file to expose the prometheus Actuator endpoint via HTTP. You can also remove the more generic metrics endpoint, since we’re not going to use it anymore.
Listing 13.14 Exposing the prometheus Actuator endpoint
management:
  endpoints:
    web:
      exposure:
        include: health, prometheus      ❶
❶ Exposes both health and prometheus endpoints
The default strategy used by Prometheus is pull-based, meaning that a Prometheus instance scrapes (pulls) metrics in regular time intervals from the application via a dedicated endpoint, which is /actuator/prometheus in the Spring Boot scenario. Rerun the application (./gradlew bootRun), and call the Prometheus endpoint to check the result:
$ http :9001/actuator/prometheus
The result is the same collection of metrics you got from the metrics endpoint, but this time they are exported using a format understood by Prometheus. The following snippet shows an extract of the complete response, highlighting metrics related to the current number of threads:
# HELP jvm_threads_states_threads The current number of threads
# TYPE jvm_threads_states_threads gauge
jvm_threads_states_threads{state="terminated",} 0.0
jvm_threads_states_threads{state="blocked",} 0.0
jvm_threads_states_threads{state="waiting",} 13.0
jvm_threads_states_threads{state="timed-waiting",} 7.0
jvm_threads_states_threads{state="new",} 0.0
jvm_threads_states_threads{state="runnable",} 11.0
This format is based on plain text and is called Prometheus exposition format. Given the wide adoption of Prometheus for generating and exporting metrics, this format has been polished and standardized in OpenMetrics (https://openmetrics.io), a CNCF-incubating project. Spring Boot supports both the original Prometheus format (the default behavior) and OpenMetrics, depending on the Accept header of the HTTP request. If you’d like to get metrics according to the OpenMetrics format, you need to ask for it explicitly:
$ http :9001/actuator/prometheus
    'Accept:application/openmetrics-text; version=1.0.0; charset=utf-8'
When you’re done analyzing the Prometheus metrics, stop the application (Ctrl-C) and all the containers (docker-compose down).
Note You might encounter scenarios where you need to collect metrics from ephemeral applications or batch jobs that don’t run long enough to be pulled. In that case, Spring Boot lets you adopt a push-based strategy so that the application itself sends metrics to the Prometheus server. The official documentation explains how to configure such behavior (http://spring.io/projects/spring-boot).
Spring Boot Actuator relies on the Micrometer instrumentation and provides auto-configuration to generate metrics for various technologies you might use in your applications: JVM, loggers, Spring MVC, Spring WebFlux, RestTemplate, WebClient, data sources, Hibernate, Spring Data, RabbitMQ, and more.
When Spring Cloud Gateway is in the classpath, as in the case of Edge Service, additional metrics are exported regarding the gateway routes. Some libraries, like Resilience4J, contribute dedicated Micrometer instrumentation through specific dependencies to register additional metrics.
Open the build.gradle file in the Edge Service project (edge-service), and add the following dependency to include Micrometer instrumentation for Resilience4J. Remember to refresh or reimport the Gradle dependencies after the new addition.
Listing 13.15 Adding dependency for Micrometer Resilience4J
dependencies {
  ...
  runtimeOnly 'io.github.resilience4j:resilience4j-micrometer'
}
Now that we’ve configured Spring Boot to expose metrics, let’s see how we can configure Prometheus to scrape them and Grafana to visualize them.
13.3.2 Monitoring metrics with Prometheus and Grafana
Like Loki, Prometheus collects and stores metrics. It even provides a GUI to visualize them and to define alarms, but we’ll use Grafana for that since it’s a more comprehensive tool.
Metrics are stored as time-series data, containing the timestamp when they were registered and, optionally, labels. In Prometheus, labels are key/value pairs that add more information to the metric being recorded. For example, a metric registering the number of threads used by the application could be enhanced with labels qualifying the state of the threads (such as blocked, waiting, or idle). Labels help aggregate and query metrics.
Micrometer provides the concept of tags, which are equivalent to Prometheus’s labels. In Spring Boot you can leverage configuration properties to define common labels for all the metrics produced by an application. For example, it’s useful to add an application label that tags each metric with the name of the application that produces it.
Open the Catalog Service project (catalog-service), go to the application.yml file, and define a Micrometer tag with the application’s name, which will result in a label that’s applied to all metrics. Since the application name is already defined in the spring.application.name property, let’s reuse that instead of duplicating the value.
Listing 13.16 Tagging all metrics with the application name
management:
  endpoints:
    web:
      exposure:
        include: health, prometheus
  endpoint:
    health:
      show-details: always
      show-components: always
      probes:
        enabled: true
  metrics:
    tags:
      application: ${spring.application.name}     ❶
❶ Adds a Micrometer common tag with the application name. This results in a Prometheus label being applied to all metrics.
With this change, all metrics will have an application label with the application name, which is very useful when querying metrics and building dashboards to visualize them in Grafana:
jvm_threads_states_threads{application="catalog-service",
➥state="waiting",} 13.0
You have already encountered Grafana when working with logs. Just as you browsed logs using Loki as a data source for Grafana, you can query metrics using Prometheus as a data source. Furthermore, you can use the metrics stored by Prometheus to define dashboards, graphically visualize data, and set alarms or notifications when certain metrics return known critical values. For example, when the rate of failing HTTP requests per minute goes above a certain threshold, you might want to get an alarm or a notification so you can act on it. Figure 13.5 illustrates the monitoring architecture.
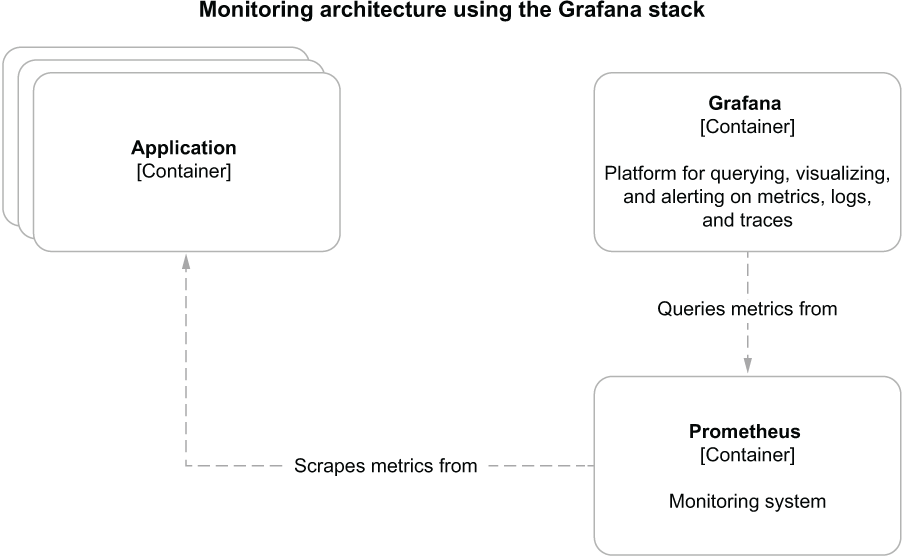
Figure 13.5 Monitoring architecture for cloud native applications based on the Grafana stack
In your Polar Deployment project (polar-deployment), update the Docker Compose configuration (docker/docker-compose.yml) to include Prometheus. Grafana is already configured to use Prometheus as a data source in the configuration files you imported into your project earlier from Chapter13/13-end/polar-deployment/docker/observability.
Listing 13.17 Defining Prometheus container for collecting metrics
version: "3.8"
services:
  ...

  grafana:
    image: grafana/grafana:9.1.2
    container_name: grafana
    depends_on:
      - loki
      - prometheus                   ❶
    ...

  prometheus:
    image: prom/prometheus:v2.38.0
    container_name: prometheus
    ports:
      - "9090:9090"
    volumes:                         ❷
      - ./observability/prometheus/prometheus.yml:/etc/prometheus/
      ➥ prometheus.yml
❶ Ensures Prometheus is started before Grafana
❷ Volumes are used to load configuration for Prometheus scraping.
Unlike Loki, we don’t need a dedicated component to collect metrics from the applications. The Prometheus Server container can both collect and store metrics.
Next, open a Terminal window, navigate to the folder where you keep your Docker Compose file (polar-deployment/docker), and run the complete monitoring stack with the following command:
$ docker-compose up -d grafana
The Prometheus container is configured to poll metrics every 2 seconds from all the Spring Boot applications in Polar Bookshop when they run as containers. Package Catalog Service as a container image (./gradlew bootBuildImage), and run it from Docker Compose:
$ docker-compose up -d catalog-service
Send a few requests to Catalog Service (http :9001/books), and then open a browser window and go to Grafana at http://localhost:3000 (user/password). In the Explore section, you can query metrics like you browsed logs. Choose Prometheus as the data source, select Last 5 Minutes from the time drop-down menu, and query the metrics related to the JVM memory used by the application as follows (figure 13.6):
jvm_memory_used_bytes{application="catalog-service"}
Figure 13.6 In Grafana, you can browse and query metrics aggregated and stored by Prometheus.
The metrics data can be used to draw dashboards for monitoring different application aspects. Select Dashboards > Manage from the left menu, and explore the dashboards I have included in Grafana, grouped within the Application folder.
For example, open the JVM Dashboard (figure 13.7). It visualizes different metrics regarding the JVM where Spring Boot applications run, such as CPU usage, heap memory, non-heap memory, garbage collections, and threads.

Figure 13.7 In Grafana, dashboards can be used to visualize Prometheus metrics.
On the Dashboards page, explore the other dashboards I have configured to get more visibility into the Polar Bookshop applications. Each dashboard is enhanced with additional information on its goal and how to use it.
When you’re done checking the application metrics in Grafana, stop all the containers (docker-compose down).
13.3.3 Configuring Prometheus metrics in Kubernetes
When running applications in Kubernetes, we can use dedicated annotations to mark which containers the Prometheus server should scrape and inform it about the HTTP endpoint and port number to call.
You’ll have the chance to test this setup later in the book, where we’ll deploy the full Grafana observability stack in a production Kubernetes cluster. For now, let’s prepare the Deployment manifests for all of the Spring Boot applications in Polar Bookshop. For example, the following listing shows how to change the Catalog Service manifest (catalog-service/k8s/deployment.yml).
Listing 13.18 Annotating Catalog Service for Prometheus metrics scraping
apiVersion: apps/v1
kind: Deployment
metadata:
  name: catalog-service
  labels:
    app: catalog-service
spec:
  replicas: 1
  selector:
    matchLabels:
      app: catalog-service
  template:
    metadata:
      labels:
        app: catalog-service
      annotations:
        prometheus.io/scrape: "true"                 ❶
        prometheus.io/path: /actuator/prometheus     ❷
        prometheus.io/port: "9001"                   ❸
  ...
❶ Signals that Prometheus should scrape containers in this Pod
❷ Identifies the HTTP endpoint that exposes Prometheus metrics
❸ Specifies the port number where the metrics endpoint is available
Annotations in Kubernetes manifests should be of type String, which is why quotes are needed in the case of values that could be mistakenly parsed as numbers or Boolean.
Go ahead and configure metrics and Prometheus for all the remaining applications in the Polar Bookshop system, including the configuration for the Kubernetes manifests. As a reference, you can look at the source code repository accompanying this book (Chapter13/13-end).
The next section will cover another type of telemetry we need in order to monitor applications and make them observable: traces.
13.4 Distributed tracing with OpenTelemetry and Tempo
Event logs, health probes, and metrics provide a wide variety of valuable data for inferring the internal state of an application. However, none of them consider that cloud native applications are distributed systems. A user request is likely to be processed by multiple applications, but so far we have no way to correlate data across application boundaries.
A simple way to solve that problem could be to generate an identifier for each request at the edge of the system (a correlation ID), use it in event logs, and pass it over to the other services involved. By using that correlation ID, we could fetch all log messages related to a particular transaction from multiple applications.
If we follow that idea further, we’ll get to distributed tracing, a technique for tracking requests as they flow through a distributed system, letting us localize where errors occur and troubleshoot performance issues. There are three main concepts in distributed tracing:
-
A trace represents the activities associated with a request or a transaction, identified uniquely by a trace ID. It’s composed of one or more spans across one or more services.
-
Each step of the request processing is called a span, characterized by start and end timestamps and identified uniquely by the pair trace ID and span ID.
-
Tags are metadata that provide additional information regarding the span context, such as the request URI, the username of the currently logged-in user, or the tenant identifier.
Let’s consider an example. In Polar Bookshop, you can fetch books through the gateway (Edge Service), and the request is then forwarded to Catalog Service. The trace related to handling such a request would involve these two applications and at least three spans:
-
The first span is the step performed by Edge Service to accept the initial HTTP request.
-
The second span is the step performed by Edge Service to route the request to Catalog Service.
-
The third span is the step performed by Catalog Service to handle the routed request.
There are multiple choices related to distributed tracing systems. First, we must choose the format and protocol we’ll use to generate and propagate traces. For this we’ll use OpenTelemetry (also called OTel ), a CNCF-incubating project that is quickly becoming the de facto standard for distributed tracing and aims at unifying the collection of telemetry data (https://opentelemetry.io).
Next we need to choose whether to use OpenTelemetry directly (with the OpenTelemetry Java instrumentation) or rely on a façade that instruments the code in a vendor-neutral way and integrates with different distributed tracing systems (such as Spring Cloud Sleuth). We’ll go with the first option.
Once the applications are instrumented for distributed tracing, we’ll need a tool to collect and store traces. In the Grafana observability stack, the distributed tracing backend of choice is Tempo, a project that “lets you scale tracing as far as possible with minimal operational cost and less complexity than ever before” (https://grafana.com/oss/tempo). Unlike the way we used Prometheus, Tempo follows a push-based strategy where the application itself pushes data to the distributed tracing backend.
This section will show you how to complete the Grafana observability setup with Tempo and use it to collect and store traces. Then I’ll show you how to use the OpenTelemetry Java instrumentation in your Spring Boot applications to generate and send traces to Tempo. Finally, you’ll learn how to query traces from Grafana.
13.4.1 Managing traces with Tempo and Grafana
A distributed tracing backend is responsible for aggregating, storing, and making traces searchable. Tempo is the solution in the Grafana observability stack. Figure 13.8 illustrates the tracing architecture.
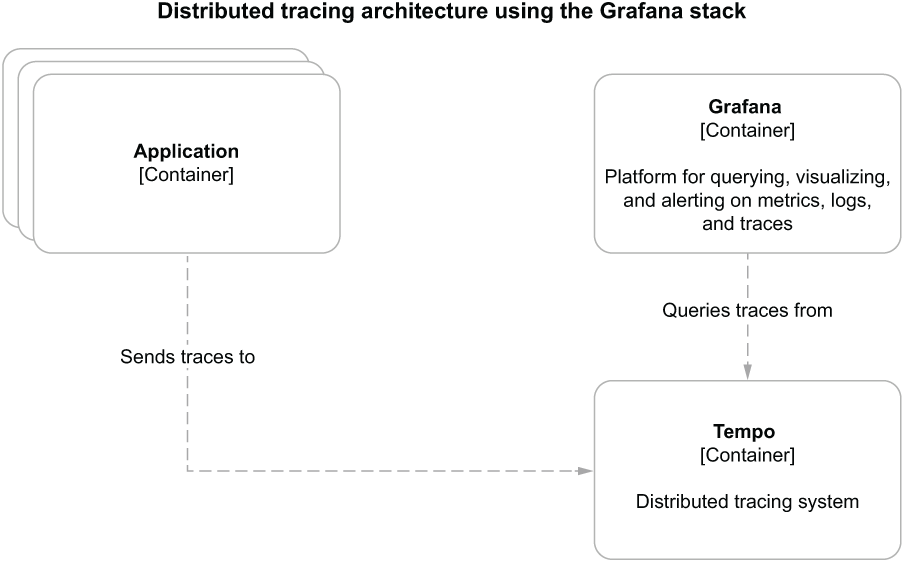
Figure 13.8 Distributed tracing architecture for cloud native applications based on the Grafana stack
Note Most vendors support OpenTelemetry, so you can easily swap your distributed tracing backend without changing anything in your applications. For example, instead of Tempo, you could send traces to other platforms like Honeycomb, Lightstep, or VMware Tanzu Observability.
First, let’s update the Docker Compose file for Polar Bookshop to include Tempo (polar-deployment/docker/docker-compose.yml). Grafana is already configured to use Tempo as a data source in the configuration files you imported earlier into your project from Chapter13/13-end/polar-deployment/docker/observability.
Listing 13.19 Defining a Tempo container for collecting and storing traces
version: "3.8"
services:
  ...

  grafana:
    image: grafana/grafana:9.1.2
    container_name: grafana
    depends_on:
      - loki
      - prometheus
      - tempo                                        ❶
    ...

  tempo:
    image: grafana/tempo:1.5.0
    container_name: tempo
    command: -config.file /etc/tempo-config.yml      ❷
    ports:
      - "4317:4317"                                  ❸
    volumes:                                         ❹
      - ./observability/tempo/tempo.yml:/etc/tempo-config.yml
❶ Ensures Tempo is started before Grafana
❷ Loads the custom configuration during the startup phase
❸ Port to accept traces using the OpenTelemetry protocol over gRPC
❹ Volumes are used to load configuration for Tempo.
Next let’s run the full Grafana observability stack on Docker. Open a Terminal window, navigate to the folder where you keep your Docker Compose file, and run the following command:
$ docker-compose up -d grafana
Tempo is now ready to accept OpenTelemetry traces over gRPC on port 4317. In the next section, you’ll see how to update a Spring Boot application to generate traces and send them over to Tempo.
13.4.2 Configuring tracing in Spring Boot with OpenTelemetry
The OpenTelemetry project includes instrumentation that generates traces and spans for the most common Java libraries, including Spring, Tomcat, Netty, Reactor, JDBC, Hibernate, and Logback. The OpenTelemetry Java Agent is a JAR artifact provided by the project that can be attached to any Java application. It injects the necessary bytecode dynamically to capture traces and spans from all those libraries, and it exports them in different formats without you having to change your Java source code.
Java agents are often provided to the application at runtime from the outside. For better dependency management capabilities, in this case, I prefer using Gradle (or Maven) to include the agent JAR file in the final application artifact. Let’s see how.
Open your Catalog Service project (catalog-service). Then add a dependency on the OpenTelemetry Java Agent in your build.gradle file. Remember to refresh or reimport the Gradle dependencies after the new addition.
Listing 13.20 Adding dependency for OpenTelemetry Java Agent in Catalog Service
ext {
  ...
  set('otelVersion', "1.17.0")                   ❶
}
dependencies {
  ...
  runtimeOnly "io.opentelemetry.javaagent:
  ➥ opentelemetry-javaagent:${otelVersion}"     ❷
}❷ The OpenTelemetry agent instrumenting the Java code dynamically via bytecode
Besides instrumenting the Java code to capture traces, the OpenTelemetry Java Agent also integrates with SLF4J (and its implementation). It provides trace and span identifiers as contextual information that can be injected into log messages through the MDC abstraction provided by SLF4J. That makes it extremely simple to navigate from log messages to traces and vice versa, achieving better visibility into the application than querying the telemetry in isolation.
Let’s expand on the default log format used by Spring Boot and add the following contextual information:
-
Application name (value from the spring.application.name property we configured for all applications)
-
Trace identifier (value from the trace_id field populated by the OpenTelemetry agent, when enabled)
-
Span identifier (value from the span_id field populated by the OpenTelemetry agent, when enabled)
In your Catalog Service project, open the application.yml file, and add the three new pieces of information next to the log level (represented by %5p) following the Logback syntax. This is the same format used by Spring Cloud Sleuth.
Listing 13.21 Adding contextual information to logs, next to the level field
logging:
  pattern:
    level: "%5p [${spring.application.name},%X{trace_id},%X{span_id}]"   ❶
❶ Includes application name, trace ID, and span ID next to the log level (%5p)
Next, open a Terminal window, navigate to the Catalog Service root folder, and run ./gradlew bootBuildImage to package the application as a container image.
The final step is configuring and enabling the OpenTelemetry Java Agent. For simplicity, we’ll enable OpenTelemetry only when running applications in containers and rely on environment variables to configure it.
We need three pieces of configuration to successfully enable tracing:
-
Instruct the JVM to load the OpenTelemetry Java agent. We can do that via the JAVA_TOOL_OPTIONS standard environment variable supported by OpenJDK to provide additional configuration to the JVM.
-
Use the application name to tag and categorize traces. We’ll use the OTEL_SERVICE_ NAME environment variable supported by the OpenTelemetry Java agent.
-
Define the URL of the distributed tracing backend. In our case, it’s Tempo on port 4317, and it can be configured via the OTEL_EXPORTER_OTLP_ENDPOINT environment variable supported by the OpenTelemetry Java agent. By default, traces are sent over gRPC.
Go to your Polar Deployment project (polar-deployment), and open the Docker Compose file (docker/docker-compose.yml). Then add the necessary configuration to Catalog Service to support tracing.
Listing 13.22 Defining OpenTelemetry for the Catalog Service container
version: "3.8"
services:
  ...

  catalog-service:
    depends_on:
      - fluent-bit
      - polar-keycloak
      - polar-postgres
      - tempo                                                 ❶
    image: "catalog-service"
    container_name: "catalog-service"
    ports:
      - 9001:9001
      - 8001:8001
    environment:
      - JAVA_TOOL_OPTIONS=-javaagent:/workspace/BOOT-INF/lib/
      ➥ opentelemetry-javaagent-1.17.0.jar                   ❷
      - OTEL_SERVICE_NAME=catalog-service                     ❸
      - OTEL_EXPORTER_OTLP_ENDPOINT=http://tempo:4317         ❹
      - OTEL_METRICS_EXPORTER=none
    ...
❶ Ensures Tempo is started before Catalog Service
❷ Instructs the JVM to run the OpenTelemetry Java agent from the path where Cloud Native Buildpacks placed the application dependencies
❸ The name of the application, used to tag the traces produced by Catalog Service
❹ The URL of the distributed tracing backend supporting the OpenTelemetry protocol (OTLP)
Finally, from the same folder, run Catalog Service as a container:
$ docker-compose up -d catalog-service
Once the application is up and running, send a few requests to trigger the generation of some logs and traces about your HTTP requests:
$ http :9001/books
Then check the logs from the container (docker logs catalog-service). You’ll see that each log message now has a new section containing the application name and, when available, the trace and span identifiers:
[catalog-service,d9e61c8cf853fe7fdf953422c5ff567a,eef9e08caea9e32a]
Distributed tracing helps us follow a request through multiple services, so we need another application to test whether it works correctly. Go ahead and make the same changes to Edge Service to support OpenTelemetry. Then run the application as a container from your Docker Compose file:
$ docker-compose up -d edge-service
Once again, send a few requests to trigger the generation of some logs and traces about your HTTP requests. This time you should go through the gateway:
$ http :9000/books
Using the trace ID logged by Catalog Service, we can retrieve (correlate) all the steps involved in processing the HTTP request to the /books endpoint started in Edge Service. Being able to navigate from logs to traces (and the other way around) is extremely useful for getting more visibility into all the steps involved in processing a request throughout a distributed system. Let’s see how it works in the Grafana stack.
Open a browser window, go to Grafana (http://localhost:3000), and log in with the credentials configured in Docker Compose (user/password). On the Explore page, check the logs for Catalog Service ({container_name="/catalog-service"}), much like we did earlier. Next, click on the most recent log message to get more details. You’ll see a Tempo button next to the trace identifier associated with that log message. If you click that, Grafana redirects you to the related trace using data from Tempo, all in the same view (figure 13.9).
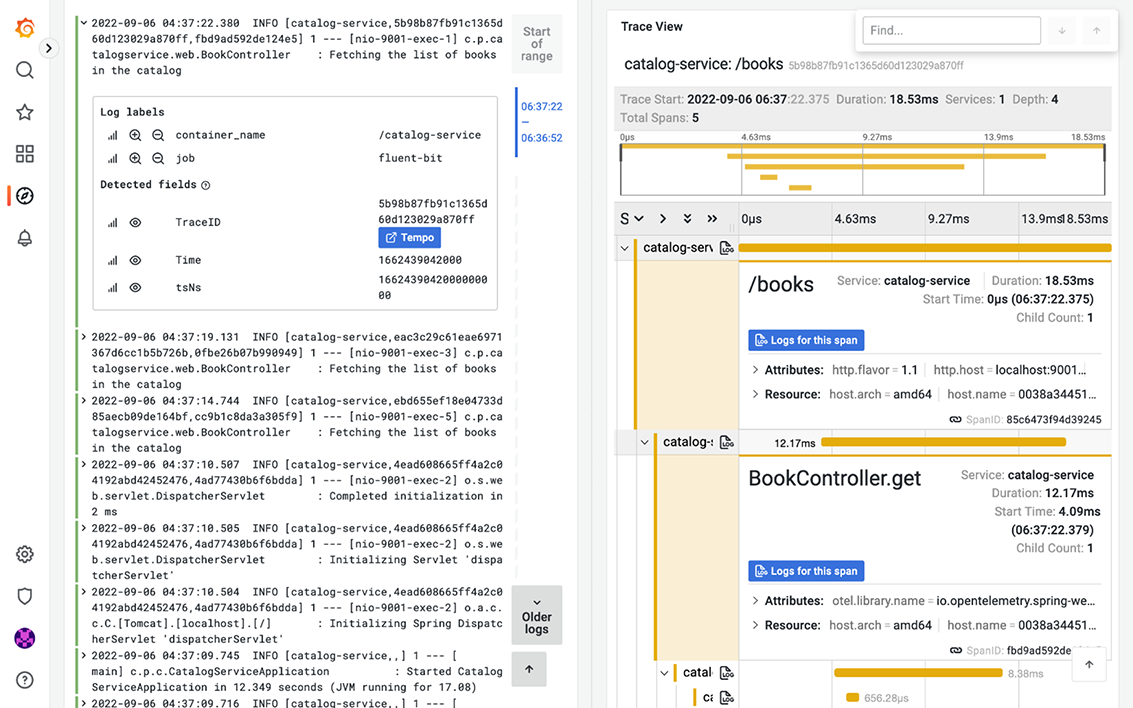
Figure 13.9 In Grafana, you can navigate from logs (Loki) to traces (Tempo) using the trace ID included in the logs.
When you’re done inspecting logs and traces, stop all the containers (docker-compose down). Before moving on, go ahead and configure OpenTelemetry for all the remaining applications in the Polar Bookshop system. As a reference, you can look at the source code repository accompanying this book (Chapter13/13-end).
So far, we have worked with the three main types of telemetry data: logs, metrics, and traces. We also enabled health endpoints to provide additional information regarding application status. The following section will cover how you can retrieve even more information from the applications and achieve better visibility into their operations.
13.5 Application management and monitoring with Spring Boot Actuator
In the previous sections, I’ve shown you the primary telemetry data that all cloud native applications should provide to achieve better observability. This final section will be dedicated to some specific information you can retrieve from applications to further enhance what you can infer about their operations.
Spring Boot Actuator provides many features to make your applications production-ready. You have already learned about health and metrics endpoints, but there are more. Table 13.1 lists some of the most useful management and monitoring endpoints implemented by Actuator. This section will show you how to use some of them.
Table 13.1 Some of the most useful management and monitoring endpoints exposed by Spring Boot Actuator.
13.5.1 Monitoring Flyway migrations in Spring Boot
In chapters 5 and 8, you saw how to version-control your database schemas using Flyway migrations and integrate them with Spring Boot, both in imperative and reactive stacks. Flyway keeps the history of all the migrations run on the application in a dedicated table in the database. It would be convenient to extract such information and monitor it, so you could be alerted if any migration should fail.
Spring Boot Actuator provides a dedicated endpoint (/actuator/flyway) to display information about all the migrations run by Flyway, including their status, date, type, and version. As you learned in the previous sections, you can enable new HTTP endpoints to be implemented by Actuator through the management.endpoints.web.exposure.include property. Let’s see that in action.
Note If you use Liquibase instead of Flyway, Spring Boot Actuator provides an /actuator/liquibase endpoint.
Open the Catalog Service project (catalog-service), go to the application.yml file, and configure the Flyway endpoint to be exposed over HTTP by Spring Boot Actuator.
Listing 13.23 Exposing the flyway Actuator endpoint
management:
  endpoints:
    web:
      exposure:
        include: flyway, health, prometheus     ❶
❶ Adds flyway to the list of Actuator endpoints exposed over HTTP
Then run the backing services required by Catalog Service as a container. From your Docker Compose file, execute the following command:
$ docker-compose up -d polar-keycloak polar-postgres
Next, run Catalog Service (./gradlew bootRun), and call the Flyway endpoint:
$ http :9001/actuator/flyway
The result is a JSON file containing the list of all migrations run by Flyway and their details. The following snippet shows an extract of the complete response:
{
  "contexts": {
    "catalog-service": {
      "flywayBeans": {
        "flyway": {
          "migrations": [
            {
              "checksum": -567578088,                         ❶
              "description": "Initial schema",                ❷
              "executionTime": 66,
              "installedBy": "user",
              "installedOn": "2022-03-19T17:06:54Z",          ❸
              "installedRank": 1,
              "script": "V1__Initial_schema.sql",             ❹
              "state": "SUCCESS",                             ❺
              "type": "SQL",                                  ❻
              "version": "1"                                  ❼
            },
            ...
          ]
        }
      }
    }
  }
}
❶ The checksum of the migration script, used to ensure the file has not been changed
❷ Description of the migration
❸ When the migration was performed
❹ The name of the script containing the migration code
❺ The state of the migration execution
❻ The type of migration (SQL or Java)
❼ The migration version (as defined in the script filename)
13.5.2 Exposing application information
Among all the endpoints implemented by Spring Boot Actuator, /actuator/info is the most peculiar one, since it doesn’t return any data. Instead, it’s up to you to define what data you consider useful.
One way to contribute data for the endpoint is through configuration properties. For example, go to your Catalog Service project (catalog-service), open the application.yml file, and add the following property to include the name of the system of which Catalog Service is part. You’ll also need to enable the info endpoint to be exposed through HTTP (similar to what we did with the other endpoints) and enable the env contributor responsible for parsing all the properties with the info. prefix.
Listing 13.24 Exposing and configuring the info Actuator endpoint
info:
  system: Polar Bookshop                             ❶

management:
  endpoints:
    web:
      exposure:
        include: flyway, health, info, prometheus    ❷
  info:
    env:
      enabled: true                                  ❸
❶ Any property starting with the “info.” prefix will be returned by the info endpoint.
❷ Adds info to the list of Actuator endpoints to be exposed over HTTP
❸ Enables environmental info fetched from “info.” properties
You can also include information that’s generated automatically by Gradle or Maven regarding the application build or the last Git commit. Let’s see how we can add details about the application’s build configuration. In your Catalog Service project, go to the build.gradle file and configure the springBoot task to generate build information that will be parsed into a BuildProperties object and included in the result from the info endpoint.
Listing 13.25 Configuring Spring Boot to include build information
springBoot {
  buildInfo()     ❶
}
❶ Stores build information in a META-INF/build-info.properties file parsed by a BuildProperties object.
Let’s test it out. Rerun Catalog Service (./gradlew bootRun). Then invoke the info endpoint:
$ http :9001/actuator/info
The result will be a JSON object containing build information and the custom info .system property we defined explicitly:
{
  "build": {
    "artifact": "catalog-service",
    "group": "com.polarbookshop",
    "name": "catalog-service",
    "time": "2021-08-06T12:56:25.035Z",
    "version": "0.0.1-SNAPSHOT"
  },
  "system": "Polar Bookshop"
}
You can expose additional information about the operating system and the Java version in use. Both can be enabled via configuration properties. Let’s update the application.yml file for the Catalog Service project as follows.
Listing 13.26 Adding Java and OS details to the info Actuator endpoint
management:
  ...
  info:
    env:
      enabled: true
    java:
      enabled: true     ❶
    os:
      enabled: true     ❷
❶ Enables Java information in the info endpoint
❷ Enables OS information in the info endpoint
Let’s test it out. Rerun Catalog Service (./gradlew bootRun). Then invoke the info endpoint:
$ http :9001/actuator/info
The result now includes additional information about the Java version and operating system in use, which will be different depending on where you run the application:
{
  ...
  "java": {
    "version": "17.0.3",
    "vendor": {
      "name": "Eclipse Adoptium",
      "version": "Temurin-17.0.3+7"
    },
    "runtime": {
      "name": "OpenJDK Runtime Environment",
      "version": "17.0.3+7"
    },
    "jvm": {
      "name": "OpenJDK 64-Bit Server VM",
      "vendor": "Eclipse Adoptium",
      "version": "17.0.3+7"
    }
  },
  "os": {
    "name": "Mac OS X",
    "version": "12.3.1",
    "arch": "aarch64"
  }
}
13.5.3 Generating and analyzing heap dumps
Among the most annoying errors to debug in Java applications, memory leaks are probably the first that come to mind. Monitoring tools should alert you when a memory leak pattern is detected, usually inferred if the JVM heap usage metric keeps increasing over time. If you don’t catch the memory leak in advance, the application will throw the dreaded OutOfMemoryError error and crash.
Once you suspect an application might suffer from a memory leak, you must find out which objects are held in memory and block the garbage collection. There are different ways to proceed with finding problematic objects. For example, you could enable the Java Flight Recorder or attach a profiler like jProfiler to the running application. Another way is to take a snapshot of all the Java objects in the JVM heap memory (a heap dump), and analyze it with a specialized tool to find the root cause of the memory leak.
Spring Boot Actuator provides a convenient endpoint (/actuator/heapdump) that you can call to generate a heap dump. Let’s see that in action. Go to your Catalog Service project (catalog-service), open the application.yml file, and configure Actuator to expose the heapdump endpoint.
Listing 13.27 Exposing the heapdump Actuator endpoint
management:
  endpoints:
    web:
      exposure:
        include: flyway, health, heapdump, info, prometheus     ❶
❶ Adds heapdump to the list of Actuator endpoints to be exposed over HTTP
Next, build and run Catalog Service (./gradlew bootRun). Finally, invoke the heapdump endpoint:
$ http --download :9001/actuator/heapdump
The command will save a heapdump.bin file in the current directory. You can then open it in a dedicated tool for heap analysis like VisualVM (https://visualvm.github.io) or JDK Mission Control (https://adoptopenjdk.net/jmc.html). Figure 13.10 shows an example of heap analysis in VisualVM.
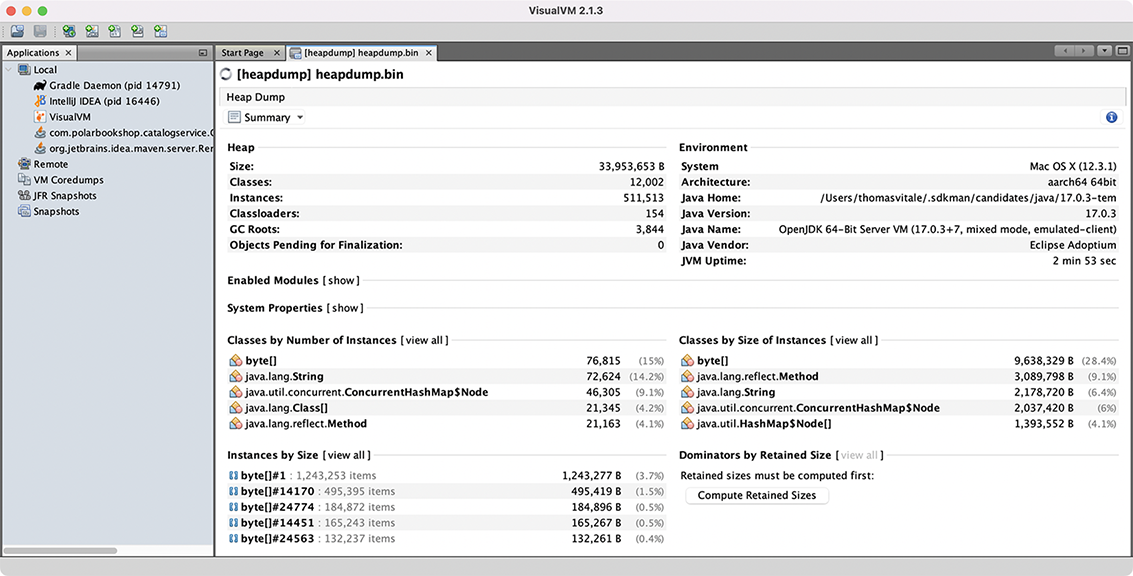
Figure 13.10 VisualVM provides tools to analyze a Java application’s heap dump.
Finally, stop the application process (Ctrl-C) and all containers (docker-compose down).
I encourage you to check out the Spring Boot Actuator official documentation, try out all the supported endpoints, and make the applications of the Polar Bookshop system more observable. For inspiration, refer to the source code repository accompanying the book to see which endpoints I have enabled on each application (Chapter13/ 13-end). They’re powerful tools that you’ll likely find helpful and convenient in real-world applications running in production.
Summary
-
Observability is a property of cloud native applications that measures how well we can infer the internal state of an application from its outputs.
-
Monitoring is about controlling known faulty states. Observability goes beyond that and permits us to ask questions about the unknown.
-
Logs (or event logs) are discrete records of something that happened over time in a software application.
-
Spring Boot supports logging through SLF4J, which provides a façade over the most common logging libraries.
-
By default, logs are printed through the standard output as recommended by the 15-Factor methodology.
-
Using the Grafana observability stack, Fluent Bit collects logs produced by all applications and forwards them to Loki, which stores them and makes them searchable. Then you can use Grafana to navigate the logs.
-
Applications should expose health endpoints to check their status.
-
Spring Boot Actuator exposes an overall health endpoint showing the status of the application and all the components or services it might use. It also provides specialized endpoints to be used as liveness and readiness probes by Kubernetes.
-
When the liveness probe is down, it means the application has entered an unrecoverable faulty state, so Kubernetes will try to restart it.
-
When the readiness probe is down, the application is not ready to handle requests, so Kubernetes will stop any traffic directed to that instance.
-
Metrics are numeric data about the application, measured at regular time intervals.
-
Spring Boot Actuator leverages the Micrometer façade to instrument the Java code, generate metrics, and expose them through a dedicated endpoint.
-
When the Prometheus client is on the classpath, Spring Boot can expose metrics in the Prometheus or OpenMetrics format.
-
Using the Grafana observability stack, Prometheus aggregates and stores metrics from all applications. Then you can use Grafana to query metrics, design dashboards, and set alerts.
-
Distributed tracing, a technique for tracking requests as they flow through a distributed system, lets us localize where errors occur in a distributed system and troubleshoot performance issues.
-
Traces are characterized by a trace ID and are composed of multiple spans, representing steps in a transaction.
-
The OpenTelemetry project includes APIs and instrumentation that generates traces and spans for the most common Java libraries.
-
The OpenTelemetry Java Agent is a JAR artifact provided by the project that can be attached to any Java application. It injects the necessary bytecode dynamically to capture traces and spans from all those libraries and export them in different formats without having to change your Java source code explicitly.
-
Using the Grafana observability stack, Tempo aggregates and stores metrics from all applications. Then you can use Grafana to query traces and correlate them with logs.
-
Spring Boot Actuator provides management and monitoring endpoints to fulfill any requirements you might have to make your applications production-ready.