Estimating Costs and Arriving at Budget
Objectives
On completion of this chapter, you should be able to understand
- How to estimate the project budget
- How to use MS-Project for estimating the project budget
Once you understand the scope of the work and plan the schedule, the next logical step is to arrive at the cost of tasks and computing the budget. In this chapter, we shall discuss key project management processes related to cost, namely, estimating and budgeting. Cost is a key constraint in most of the projects and it is important that the project is completed within the approved budget to keep the cost of the resultant product or service competitive.
Estimating costs is the process of approximating financial resources needed to complete the project activities (identified as tasks in MS-Project). The next step in arriving at the budget involves aggregating the estimated costs of individual activities or work packages and adding reserves (like contingency and management reserves), at appropriate stages. This will establish a cost baseline for the project. The cost baseline is the baseline of the project that gives us an idea about the amount of money the project is estimated to cost and how the money will be spent over a period of time (giving an idea of cash flow). Generally, it is an approved budget (by the sponsor) usually in a time-distribution format used to estimate, monitor, and control the overall cost performance of the project.
The Cost Tree Structure
To begin with, let us understand how we arrive at the project budget. Chapter 2 and 3 discussed about the work breakdown structure (WBS) and activity definitions. Figure 6.1 illustrates how individual activities are rolled up to form work packages. As a first step in estimating the cost of work packages, the work packages are decomposed into smaller components called activities. The activity definition process deals with creating activities (also known as schedule activities) by breaking down work packages. It is these activities that require cost estimation. This is known as the estimate costs process. Once these costs are estimated, contingency allowances are added to these estimates at various levels. Contingency reserves are allowances that a project manager will use, in case the identified risks get realized. These are then rolled up into associated work package costs. The same process is repeated at the work package level to come out with the control account estimates. (Control account is the WBS component used for the project cost accounting. Each control account is assigned a unique code to link it to the performing organization’s accounting system.)
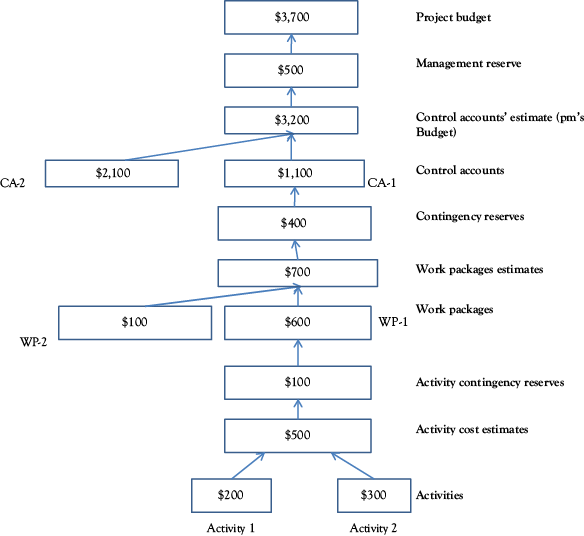
Figure 6.1 Estimating the project budget (WP stands for work packages and CA for control accounts)
These control account estimates have to be rolled up and added with reserves. Management reserves are budgets that a project manager shall use with the approval of the senior management, to mitigate the effect of unplanned or unexpected changes to scope and cost. (As discussed earlier, in the case of MS-Project, we have only tasks to represent activities, work packages, control accounts, and so on. However, we can use subtasks to represent activities and summary tasks to represent work packages and control accounts, etc.)
With a basic understanding of how a budget is determined by rolling up costs, let us examine how MS-Project allows us to accomplish this. This case study deals with a small project of Software Testing.
Example Problem: Arriving at the Budget for a Software Testing Project
In the following example, we discuss the case of arriving at the budget of a small software testing project. The resources required and the quantities of the material have been estimated. Based on this, we shall estimate the cost of the project.
- You need to use the project file named Testing-project-with-resources-original.mpp for this case study. Copy the file from the Practice-Files/Ch06 folder to your working directory and rename as Testing-project-with-resources. Double click on the file. You will find a task list as illustrated in Figure 6.2. Click on the Task tab, and in the View group select Gantt Chart to go to the Gantt Chart view, if you do not see the task list.
It is a project with two summary tasks (Planning & Preparation, Execute Tests).
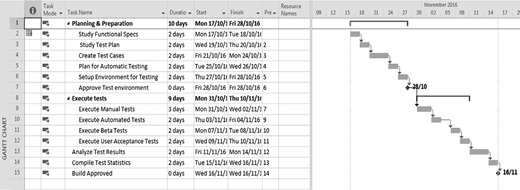
Figure 6.2 Gantt Chart of the software testing project
- Make the project summary task also visible, if required. For that, click on the Format tab and in the show hide group select Summary Tasks and Project Summary Task check-boxes.
- Now let us start estimating costs associated with each of the tasks. For that, resources have to be assigned to relevant tasks. Let us look at the Resource Sheet to start with. Click on the View tab and select Resource Sheet in the Resource Views group. You will see the resources associated with the project (Figure 6.3). These resources have associated costs too. Here are some points to be noted. The resource, Licensed Software, has got costs associated on the basis of its usage and has been categorized as a work resource. (If the license had been procured by outright purchase by one-time payment for this project, then it could have been categorized as a material resource.) Contingency allowances in this project are allocated to Execute Automated Tests, and are to be used in case the project needs support of an external consultant.
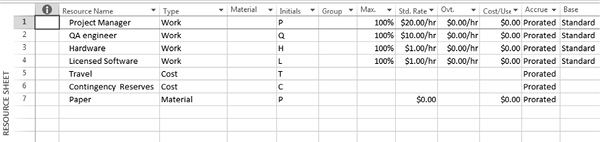
Figure 6.3 Resource sheet of the software testing project
- These resources have to be assigned to various tasks to estimate the costs associated with each task and thereby the baseline cost of the project. Switch to Gantt Chart (using View tab and Task Views group). Select the task Planning & Preparation from the Resource tab, Assignments group, select Assign Resources. The Assign Resources dialog pops up (Figure 6.4). You may keep this dialog open throughout the assignment process. There is no need to close the dialog, every time you select a different task.

Figure 6.4 Assign resources dialog box
- Select QA Engineer from the dialog. There is an option to change the units here and the cost of the work resources gets reflected accordingly in the next column. In this case, QA Engineer is working full time on this task and hence we need to apply 100 percent. (By default, 100 percent gets assigned in case of work resources, when you use assign button. You need not exclusively specify the same.)
- Now repeat the previous step for the rest of the tasks according to Table 6.1 without closing the Assign Resources dialog. When you assign additional resources like Hardware, you get an Action button in the Task Mode column. Accept the default option is “Increase the amount of work but keep the duration same” as there is no need to change.
With this you have assigned all the required resources to all the tasks. As you observe, the contingency allowance of $620 has been assigned to the task Execute Automated Tests. This may be used to hire an expert or consultant to guide the staff in the usage of the tool.
Table 6.1 Resources assignment details for the project
|
Tasks |
Resources |
Units/cost |
|
Planning and Preparation (Summary Task) |
QA Engineer Hardware |
100% 100% |
|
Study Functional Specifications |
Project Manager |
50% |
|
Execute Tests (Summary Task) |
Hardware QA Engineer |
100% 100% |
|
Execute Automated Tests |
Licensed Software Contingency Allowance |
100% U.S. $ 620 |
|
Execute User Acceptance Tests |
Travel |
U.S. $2,100 |
|
Analyze Test Results |
Project Manager QA Engineer |
100% 100% |
|
Compile Test Statistics |
QA Engineer Paper |
100% 2 Rims |
- As a last step, let us analyze the estimated costs. Now we have the resources displayed with the bar charts. However, we will still not get an idea about costs associated with work packages and so on, and the project as a whole. To have an idea about the same we have to add a Cost column. For that, move the separator between the chart and the table toward left-hand side. An additional new column gets displayed with the title Add new column. Click on the arrow there and select Cost from the pull-down list. The Cost column gets displayed. The rolled-up costs are displayed too for the project (Figure 6.5). As you notice some of the subtasks like “Study Test Plan” are displayed with zero cost though they use resources like “Hardware,” as those costs are covered (or accounted) by their summary tasks. Close the Testing-project-with-resources file.
To conclude, we did learn how to arrive at the project budget summing up various costs and allowances, in this chapter. We also did study, with an example, how we can initiate the process of estimating the project budget with the help of MS-Project.

Figure 6.5 Display the rolled-up costs to display the estimated budget