
Chapter 2. Raw Materials and Development Environment
In this book we build a game. Like all builders, we must gather raw materials and become competent with our tools before we begin. For most games, the following raw materials are standard fare:
• Graphics
• Sound effects
• Music
The following, which add some polish to your HTML5 game, are optional:
• A favicon
• A webpage background
• An animated GIF
Favicons are small images that browsers display either in the address bar or in a tab. Webpage backgrounds can be images or, as is the case with Snail Bait, they can be drawn with CSS. Snail Bait also displays an animated GIF while it loads its resources.
Fortunately, all the necessary materials, from game graphics to animated GIFs, are readily available. Not only that, but you can easily find high-quality graphics, sound effects, and music on the Internet under permissive open source licenses, such as Creative Commons.
The following developer tools will help us turn the preceding materials into a compelling video game:
• Text editor
• Console
• Debugger
• Profiler
• Timelines
Additionally, game developers must have:
• An image editor
• A sound editor
Browser development environments, which typically contain all the preceding development tools and more, are also free. And you can also use high quality, freely available image and sound editors, such as GIMP and Audacity.
This chapter briefly describes the Chrome developer tools and shows you how to access freely available graphics, sound effects, and music on the Internet. You will also see how to edit sounds and images and how to create animated GIFs, favicons, and CSS backgrounds.
![]() Note: Game development wasn’t always this accessible
Note: Game development wasn’t always this accessible
Before the advent of open source resources and freely available development environments, game development was much more difficult. Developers had to pay steep prices for development environments in addition to typically paying artists and musicians to create graphics, sound, and music for their games.
![]() Note: Money-making games use open source resources
Note: Money-making games use open source resources
Nowadays there are many types of open source licenses, and some of them, like Creative Comments, pretty much let you do anything you want with open source resources, as long as you attribute works to the original artists. In fact, quite a few for-sale games are based entirely on open source graphics.
2.1. Using Developer Tools
You will undoubtedly use developer tools as you implement HTML5 games, and your familiarity with those tools will help determine how quickly and easily you can implement a game.
As this book was written, all major browser vendors–-Chrome, Safari, Firefox, Opera, and Internet Explorer-–provided powerful developer tools for free. Although the specifics of those tools vary, the fundamentals are similar. Developers log information to the console, debug with a debugger, locate performance bottlenecks with a profiler, and monitor events with timelines.
A comprehensive discussion of browser developer tools is beyond the scope of this book; however, this section exemplifies the use of Chrome’s developer tools to implement games.
![]() Caution: Chrome is a moving target
Caution: Chrome is a moving target
Over the course of the development of this book, Chrome’s look and feel changed considerably. Some of the screenshots you see in this book may not correspond exactly to the current version of Chrome, but the functionality should be the same.
2.1.1. The Console
Video games are predicated upon time. Games tirelessly create one animation frame after another to create the illusion of motion. When a game draws an animation frame, it uses the elapsed time since the last animation frame to determine where to move its graphical objects, known as sprites.
If you set a breakpoint in the debugger at a line of code that’s called for every animation frame, you will greatly increase the amount of time between frames, no matter how quickly you click the debugger’s resume button. More importantly, values that depend on the amount of time between animation frames, such as the frame rate itself, will be enormously out of whack, as Figure 2.1 depicts in the top screenshot, which shows a nonsensical frame rate of less than one frame per second in the debugger.
Figure 2.1. Debugger vs. Console

On the other hand, logging to the console does not cause the game’s code to stop running, so you can monitor values such as frame rate, as illustrated in the bottom screenshot in Figure 2.1.
In the bottom screenshot in Figure 2.1, Snail Bait uses the console.log() method to display the game’s frame rate. Chrome’s console comes with several other methods that, like console.log(), log messages to the console: debug(), error(), info(), and warn(). Those methods are identical to log(), but the browser categorizes them so you can filter out particular types of messages. Example 2.1 shows how Snail Bait uses the error() and warn() methods.
The preceding JavaScript shows two of Snail Bait’s sound methods, which we discuss in much greater detail in [Missing XREF!]. It’s an error if we cannot move to a particular position in a sund file (known as seeking) because by the time seekAudio() is invoked, all sounds are loaded and we should therefore be able to seek anytime we want.
On the other hand, if by some chance Snail Bait tries to simultaneously play more sounds than it can support, no audio channels will be available, and Snail Bait won’t be able to play the sound. However, not being able to play a sound when multiple sounds are already playing is not an error, so Snail Bait emits a warning to the console instead.
Example 2.1. Using the console to report warnings and errors
prototype = { // An object containing the game's methods
... // See [Missing XREF!] for more information
seekAudio: function (sound, audio) {
try {
audio.pause();
audio.currentTime = sound.position;
}
catch (e) {
console.error('Cannot seek audio');
}
},
playSound: function (sound) {
var channel = this.getFirstAvailableAudioChannel(),
audio;
if (!track) {
console.warn(track, 'Cannot play sound');
}
...
},
...
};
Browsers graphically depict errors and warnings with red and yellow icons, respectively, and they also group them under error and warning categories so that you can view one or the other. The bottom screenshot in Figure 2.1 shows buttons in the browser’s status bar for filtering log messages by error, warning, log, or debug.
Chrome’s console is full featured, as Table 2.1 illustrates.
Table 2.1. The Chrome console API
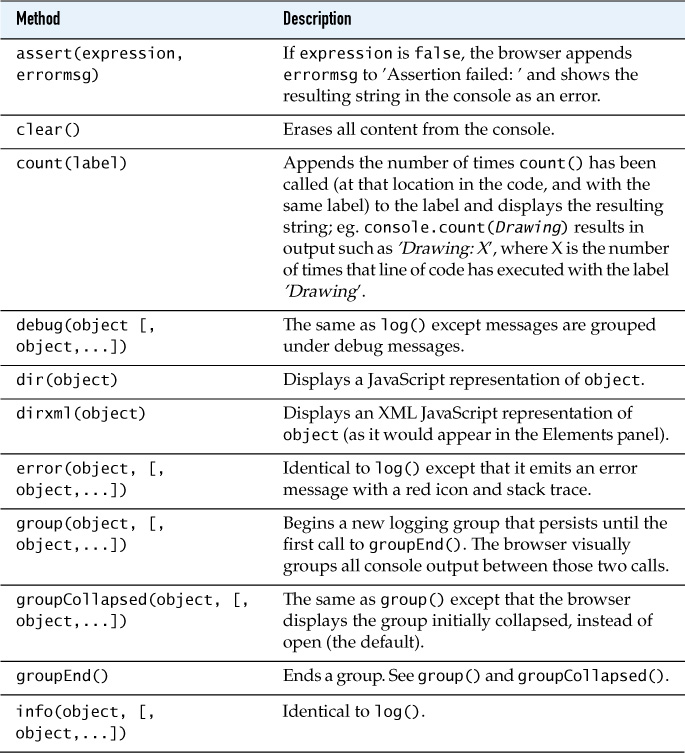
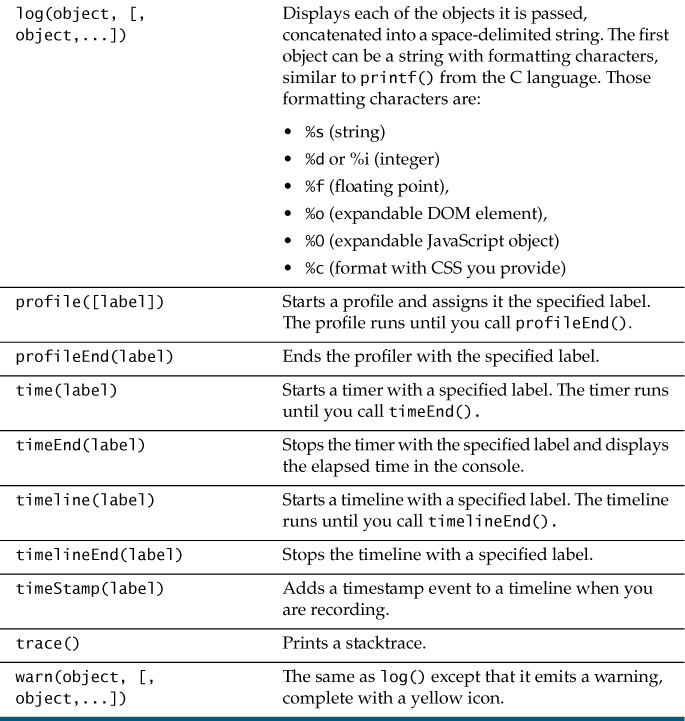
Several methods listed in Table 2.1 take arguments which are depicted in the table like this: (object, [, object,...]). The first argument is a string that can have formatting characters as described in the table’s description of the log(object, [, object,...]) method. The browser substitutes the formatting characters in the string with the remaining arguments, similar to C’s printf(). For example, you could add a log statement in Snail Bait’s loseLife() method, like this:
console.log('Life lost while playing %s. %d lives remain.', 'Snail
Bait', snailBait.lives);
Snail Bait keeps track of the number of remaining lives with a lives property. The preceding call to console.log() substitutes that value, along with the string Snail Bait, for the formatting characters in the order in which they appear.
Some of the console methods, however, have nothing to do with formatting messages and two of them are quite valuable to game developers: profile() and profileEnd(). Those methods let you start and stop profiling, respectively, which gives you much more fine-grained control over profiling than the brute force method of clicking a button in the browser’s status bar.
![]() Note: Online Console API reference
Note: Online Console API reference
You can find an online reference to Chrome’s Console API at https://developers.google.com/chrome-developer-tools/docs/console-api.
![]() Caution: Undocumented methods
Caution: Undocumented methods
As this book went to press, the timeline() and timelineEnd() console methods, which were added to the console late in 2013, were undocumented. See Section 2.1.4, “Timelines,” on p. 43 to learn how to use those methods.
2.1.2. Chrome Canary’s Frame Rate Counter
Section 2.1.1, “The Console,” on p. 35 demonstrated how the console can sometimes be more effective than the debugger for monitoring frame rate. In practice, neither the debugger nor the console is an effective way to monitor frame rate. The former can give nonsensical results, whereas the latter can degrade performance, which in turn affects your game’s frame rate.
Instead of using the console or debugger to monitor frame rate, you can use Chrome Canary’s frame rate counter, shown in Figure 2.2.
Figure 2.2. Chrome Canary’s frame rate counter
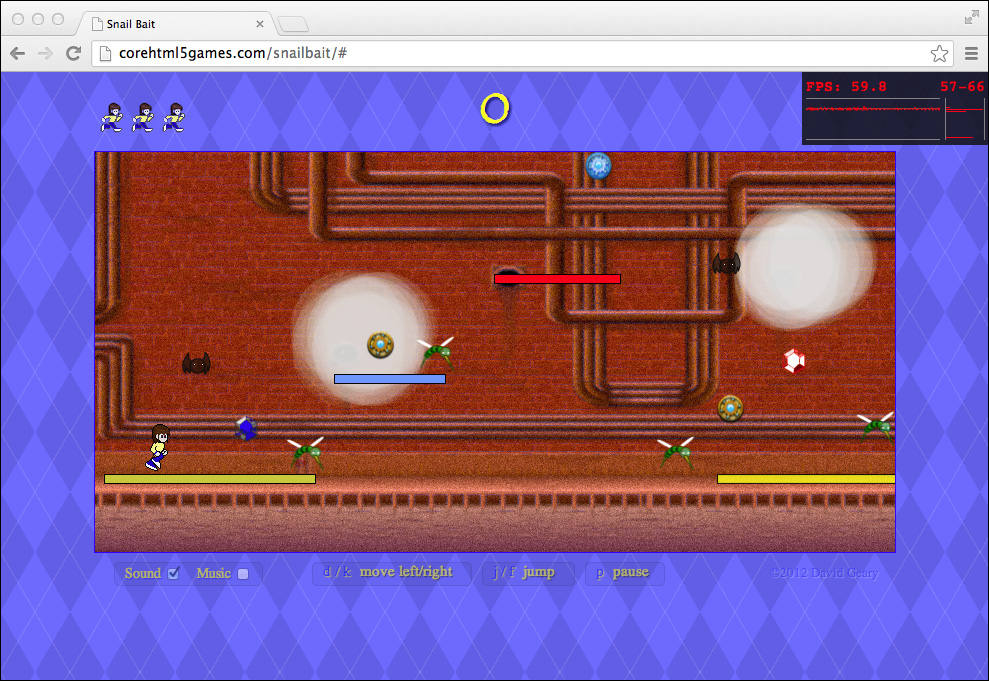
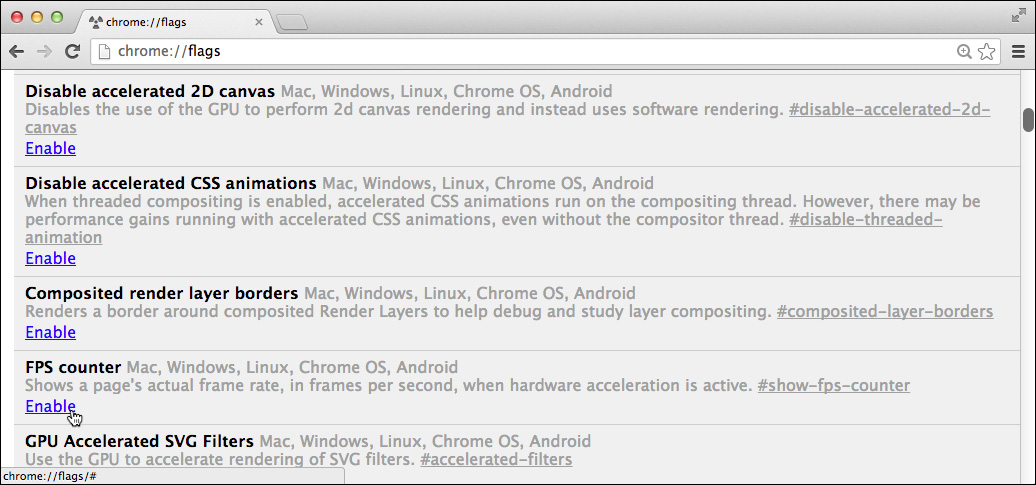
The frame rate counter is not enabled by default. To enable it, type chrome://flags in Chrome Canary’s address bar and enable the FPS counter, as shown in Figure 2.3.
Figure 2.3. Enabling Chrome Canary’s frame rate counter
![]() Note:
Note:
We implement a frame rate counter in the next chapter.
![]() Note: Chrome Canary
Note: Chrome Canary
A reference to canaries in coal mines, Chrome Canary contains cutting-edge features, some of which will eventually be incorporated into Chrome. The download link for Chrome Canary depends on your type of hardware and language. Type “Chrome Canary” in Google to find an appropriate link.
2.1.3. Debugging
It’s hard to imagine writing any software, let alone games, without a proper debugger. All the major browser vendors provide debuggers that are instantly recognizable as such, with a gutter in which you can click to set breakpoints and buttons for resuming execution, and for stepping in, around, and out of functions. You can also watch expressions and view the call stack, as you can see from the bottom screenshot in Figure 2.4.
Figure 2.4. Conditional breakpoints in Chrome
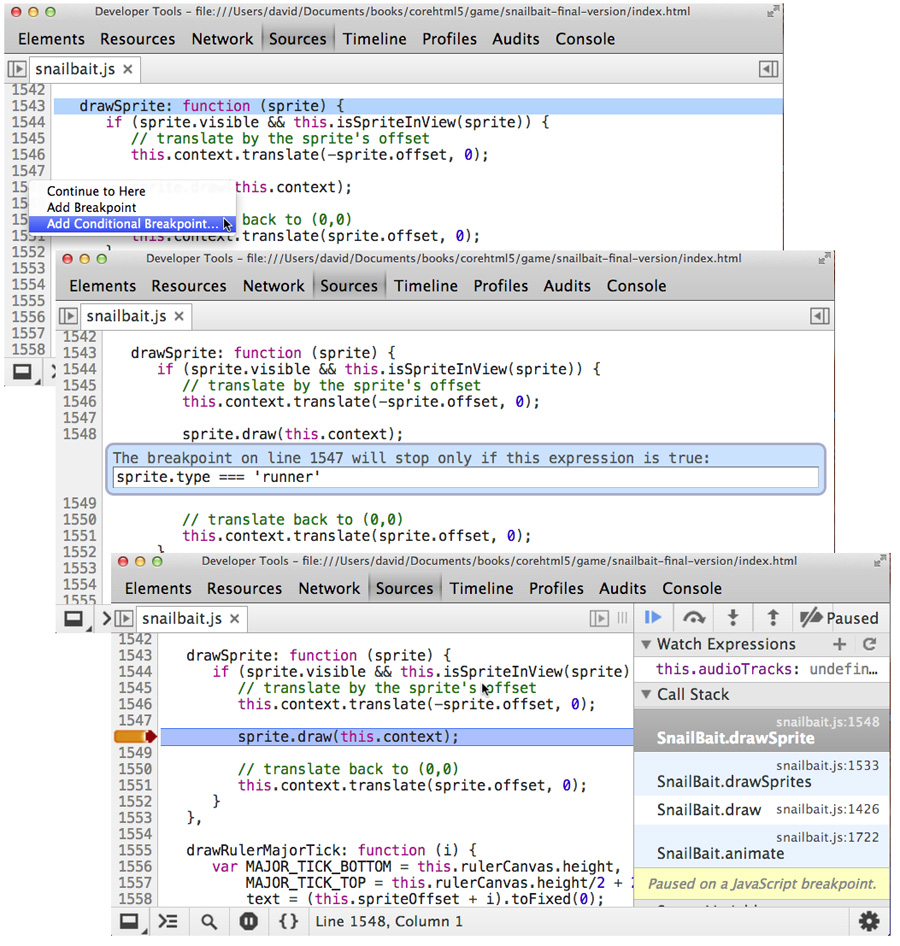
Your productivity in the debugger will increase if you take advantage of conditional breakpoints, a feature that’s supported by all major browsers. Instead of looping over a collection of objects looking for a specific condition, you can set a breakpoint that’s tripped by that condition. For example, Figure 2.4 shows a conditional breakpoint that acts as a breakpoint only when a sprite’s type is runner.
![]() Note: Setting conditional breakpoints in Chrome
Note: Setting conditional breakpoints in Chrome
1. Right-click in the gutter at the desired line of code to pop up the breakpoint menu.
2. Select Add Conditional Breakpoint from the popup menu.
3. Type an expression into the ensuing dialog and press Enter.
![]() Note: Live JavaScript editing in Chrome
Note: Live JavaScript editing in Chrome
Chrome lets you live-edit your game’s JavaScript. In the debugger, simply change code and save it with a standard save keystroke such as CTRL-s on Windows. Any changes that you make to the code persist until the next time you reload the page. As this book was written, Chrome was the only major browser that let you live-edit JavaScript; however, add-ons for other browsers, such as Firefox, let you do the same thing.
![]() Note: The
Note: The debugger; statement
Besides clicking in the gutter, you can also set breakpoints in Chrome’s debugger by adding the following statement to your code: debugger;
2.1.4. Timelines
If your goal is to implement a simple game such as hangman, then not only are you reading the wrong book, but you also don’t need to worry much about performance. If you’re implementing a video game, however, where you are manipulating dozens of sprites in each animation frame, you should monitor performance the entire time you are developing your game. Two useful tools for monitoring performance are timelines and profiles.
Timelines let you monitor events, frame rates, and memory usage in realtime. Figure 2.5 shows frame rates for the finished version of Snail Bait.
Figure 2.5. Timeline showing frame rates
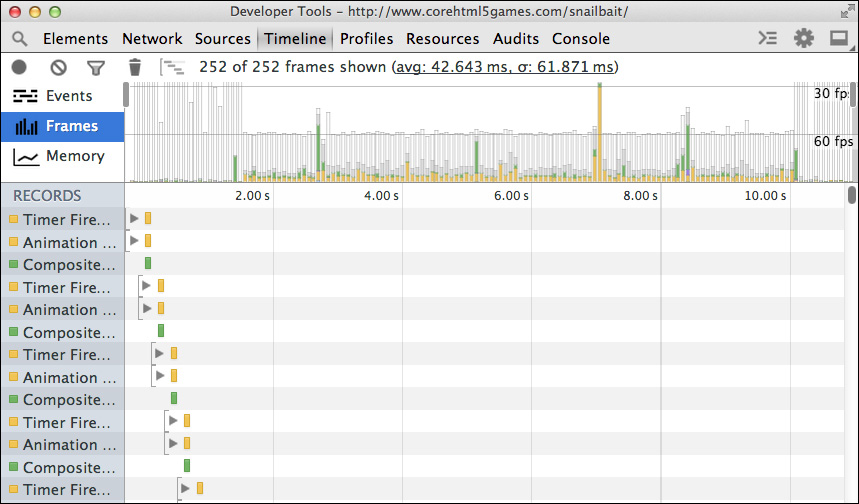
To begin a timeline, you click the filled circle at the top-left in Figure 2.5, and the circle turns red. To stop the timeline, you click the red circle, which returns to its original color.
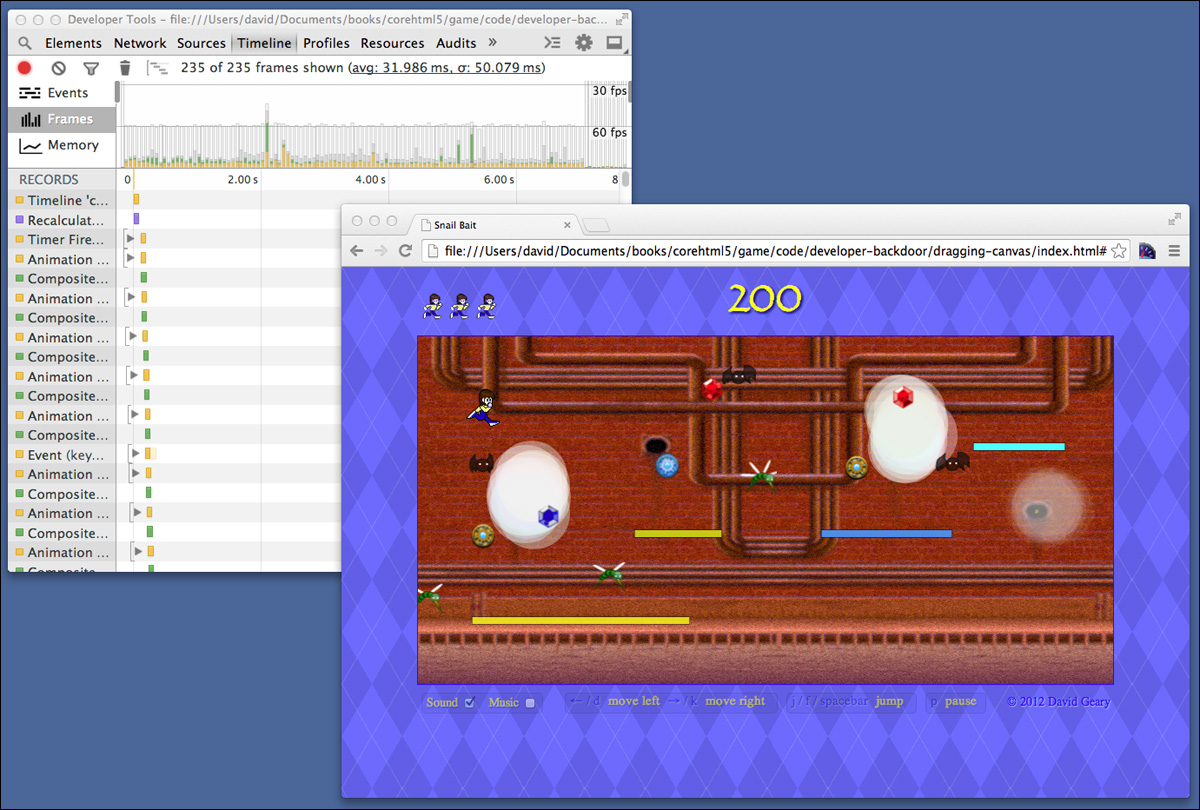
Starting and stopping timelines by clicking the mouse is appropriate when you want to get a general idea of your game’s performance. For example, in Figure 2.6 players can observe the timeline as they are playing, which is quite useful when a player is also the game’s developer, because the developer can see, in realtime, when performance bottlenecks arise.
Figure 2.6. A running timeline
Clicking the mouse to start and stop a timeline is a rather coarse-grained, unwieldy approach. It’s often better to start and stop timelines programmatically, which you can do with the Chrome console’s timeline() and timelineEnd() methods, as shown in Figure 2.7.
Figure 2.7. Starting and stopping a timeline programatically
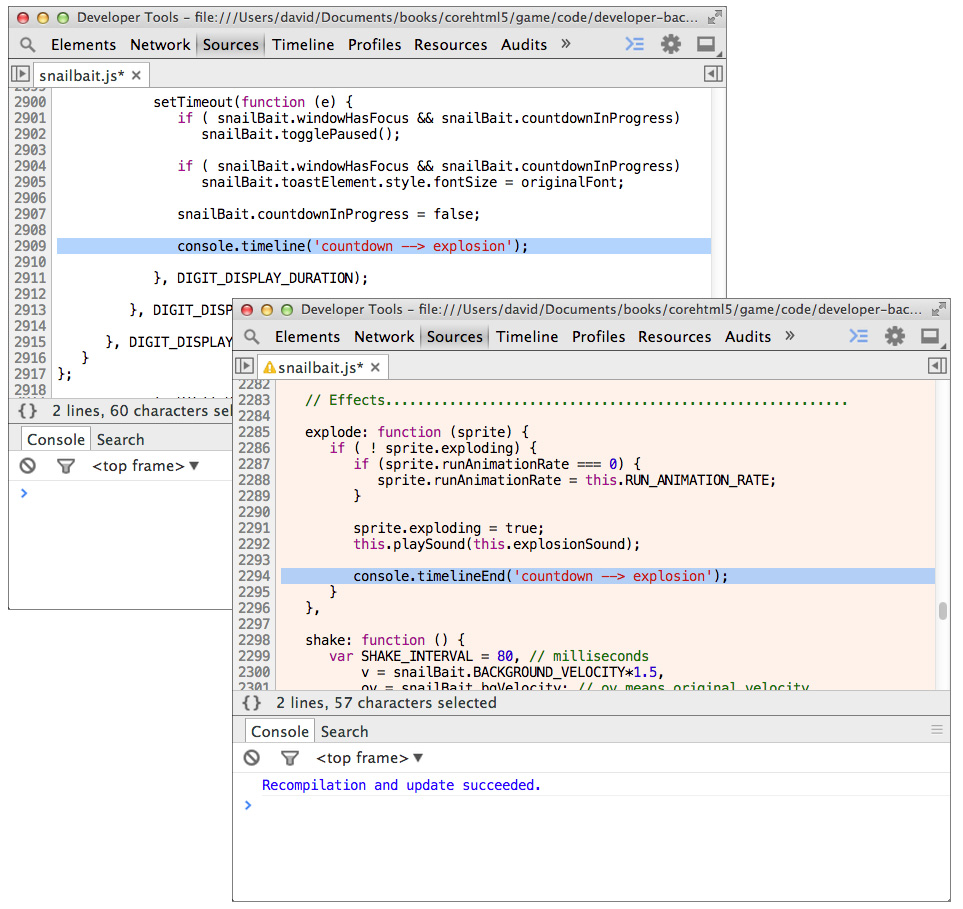
Chrome lets you live-edit JavaScript, as illustrated in Figure 2.7. The highlighted line of code in the top screenshot was added to Chrome’s editor after the game started running. The asterisk next to the file name indicates that the source has been temporarily modified. The background color also changes to indicate that the changes have been saved.
The newly added line of code starts a timeline with the identifier countdown → explosion. Chrome uses that identifier in the messages it prints to the console when timelines start or stop.
The bottom screenshot in Figure 2.7 shows a second line of code added to Chrome’s editor to end the countdown → explosion timeline. That screenshot also shows the effect of saving the changes in the editor; Chrome prints a message to the console, changes the editor’s background color, and adds an information icon next to the file, thus signaling the presence of the new message in the console.
The calls to timeline() and timelineEnd() shown in Figure 2.7 are strategically placed. The timeline starts after the three-second countdown when a paused game resumes and ends when a sprite (who is almost always the runner) explodes. The results of that timeline for a short run of three seconds, is shown in Figure 2.10.
Chrome displays the timeline at the top of the window as shown in the top screenshot in Figure 2.8. Underneath the timeline is a list of events that occurred during the timeline’s selected range (the entire timeline is selected in the top screenshot). You can change the selected range by dragging the range handles or clicking in the timeline, as shown in bottom screenshot in Figure 2.8. When you modify the range, the list of events updates to display only events within that range.
Figure 2.8. Changing the range within the bar graph
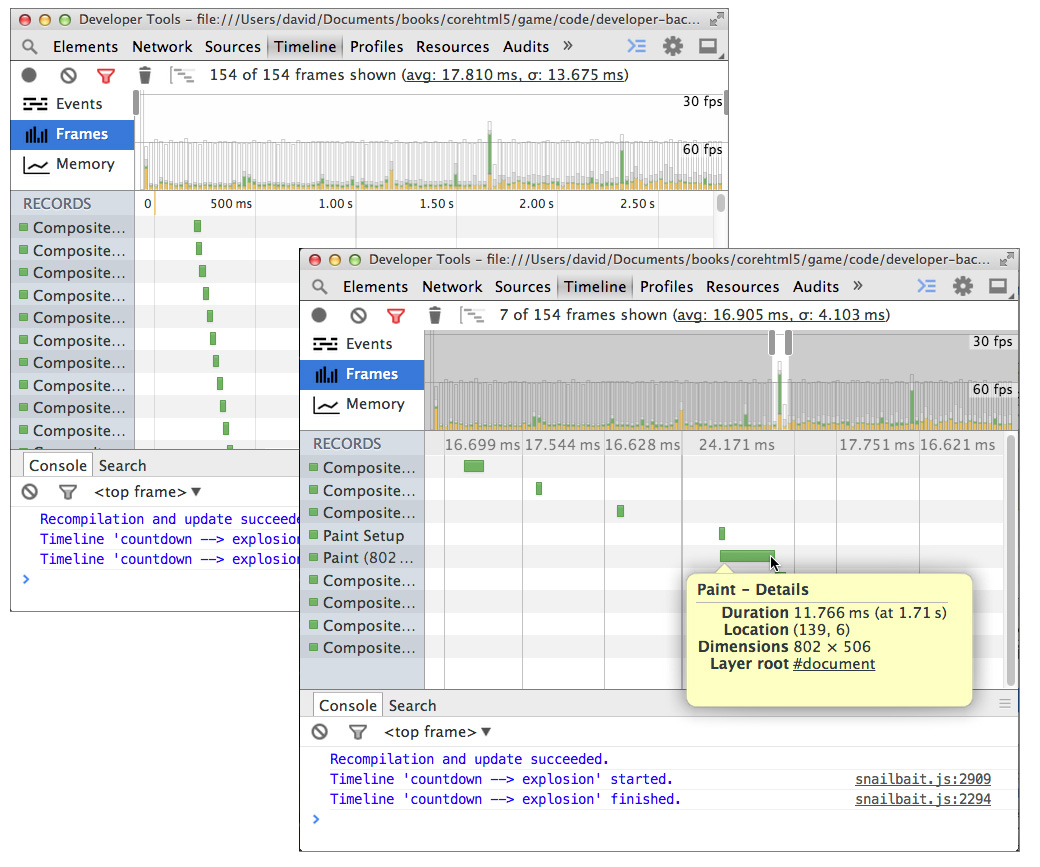
If you hover the mouse over a rectangle representing an event, as shown in the bottom screenshot in Figure 2.8, Chrome displays a tooltip with information about the event.
You can filter events in two ways, as shown in the top screenshot in Figure 2.9. You select the types of events you want to see by checking the appropriate checkboxes for Loading, Scripting, Rendering, and Painting events; you filter events by their duration with the drop-down menu shown in the top screenshot in Figure 2.9. Filtering events does not affect the timeline itself.
Figure 2.9. Filtering events according to how long they took
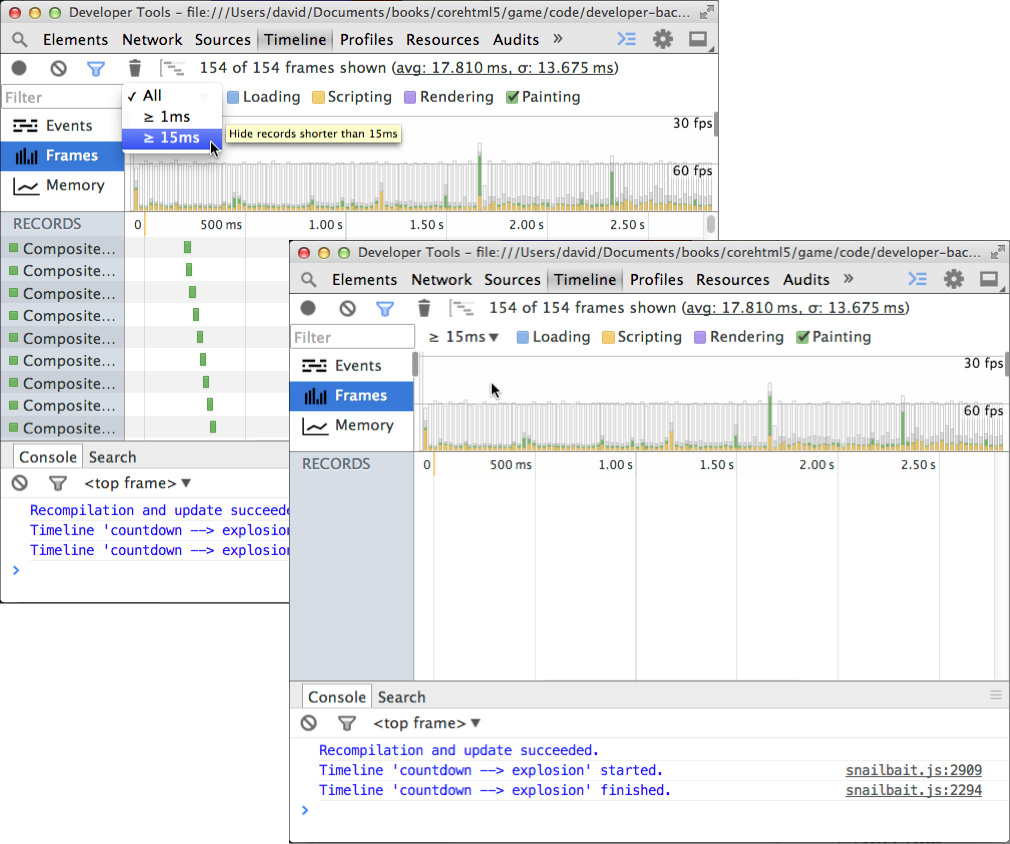
Filtering events that took longer than 15 ms is especially pertinent to game developers because at 60 frames per second, one frame takes 16.66 seconds. If no events take longer than 15 ms, as is the case in Figure 2.9, your game is performing well.
Now that you know how to start and stop timelines, how to correlate frames with events, and how to filter events, let’s take a look at the timeline itself, shown in Figure 2.10.
Figure 2.10. A closeup look at a timeline
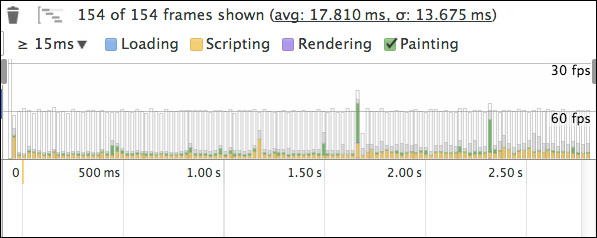
The bars in the timeline represent individual frames, and the size of the bar represents how long the frame took. Longer times, meaning taller bars, correlate to slower frame rates, which is why 30 fps is above 60 fps in Figure 2.10.
Each bar is colored according to how much time Loading, Scripting, Rendering, and Painting events took during a frame. Clear regions represent idle time. Figure 2.10 is a timeline of the final version of Snail Bait, revealing that the game spends the majority of its time doing nothing. We’ll see exactly how much time Snail Bait spends idling in the next section.
![]() Note: Best practice: Constantly monitor performance from the outset
Note: Best practice: Constantly monitor performance from the outset
The ease with which you locate and fix performance bottlenecks is inversely proportional to how long it takes to start monitoring performance in the first place.
2.1.5. Profiling
JavaScript profiling is another feature that’s supported by all major browsers. It lets you see exactly where your game spends its time. Figure 2.11 shows the Chrome profiler running against the final version of Snail Bait. The Self column shows how much time an individual function took; the Total column shows how much time was taken by an individual function and each function called from within that function.
Figure 2.11. Profiling in Chrome
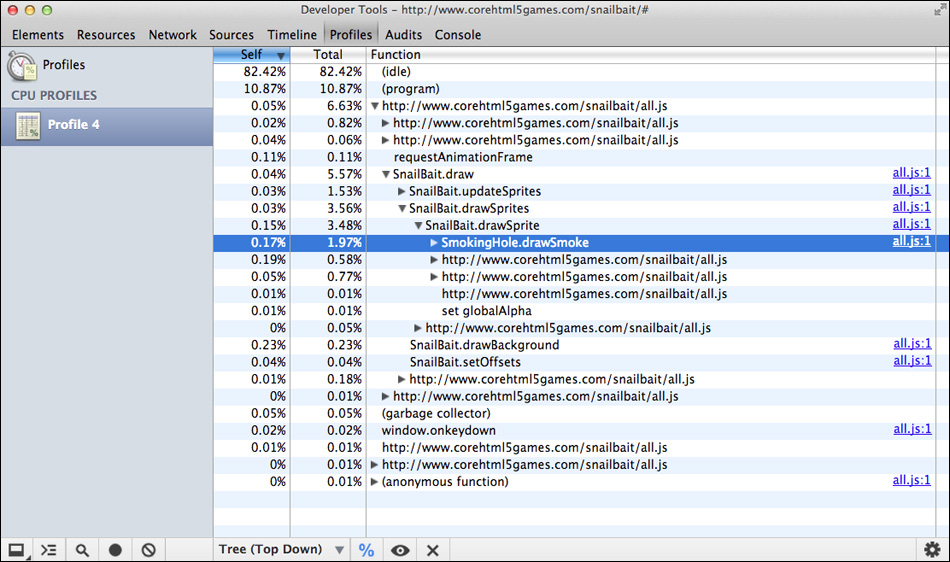
As you can see from Figure 2.11, Snail Bait’s most performance-intensive endeavor is drawing smoking holes. Each smoking hole contains 30 sprites, whose artists draw them as partially transparent, filled circles that slowly dissipate.
As you can also see from Figure 2.11, Snail Bait spends around 80% of its time doing nothing. That’s pretty impressive, but it’s only possible due to the fact that Chrome hardware accelerates its canvas element.
Now that you have a high-level understanding of browser developer tools, let’s see how to access freely available assets, such as graphics, sound, and music.
![]() Note: Starting and stopping profiling in Chrome
Note: Starting and stopping profiling in Chrome
In Chrome, you can start and stop profiling by clicking the filled circle on the left side of the browser’s status bar. For more precise accounting, however, you can start and stop profiling at specific locations in your code with console.profile() and console.profileEnd(), which were discussed in Section 2.1.1, “The Console,” on p. 35.
2.2. Obtaining Assets
Software developers who are not accomplished artists or musicians can still implement games with high-quality graphics, sound, and music by using open source resources.
This section takes a brief look at open source resources used by Snail Bait. With a browser and Google, you should have no trouble locating similar resources of your own.
2.2.1. Graphics
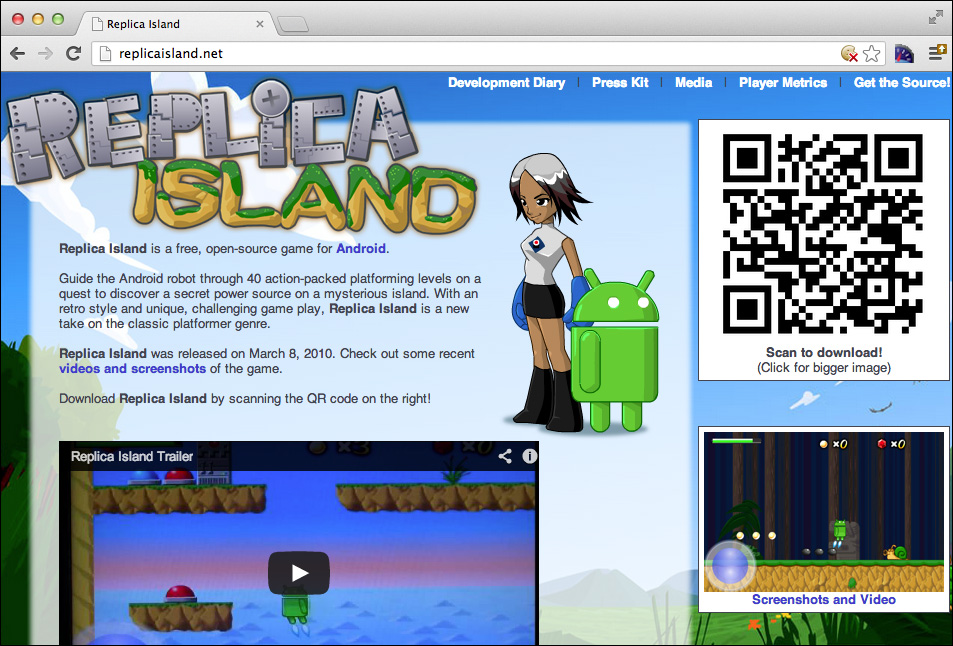
With the exception of the runner and coins, all Snail Bait’s graphics come from Replica Island, an open source Android game, whose homepage is shown in Figure 2.12. Replica Island’s graphics and code are open source, covered by the Apache 2.0 license. That license lets you modify and redistribute works covered by the license as long as you follow some simple rules, such as providing a copy of the license and any original NOTICE files (containing attributions).
![]() Note: Accessing Replica Island’s graphics
Note: Accessing Replica Island’s graphics
To access Replica Island’s graphics, go to replicaisland.net and download the game. Under the game’s top-level directory you will find a directory named res/drawable that contains the games graphics.
![]() Note: The Apache 2 license
Note: The Apache 2 license
You can find the Apache 2 license online at apache.org/licenses/LICENSE-2.0.
2.2.2. Image Manipulation
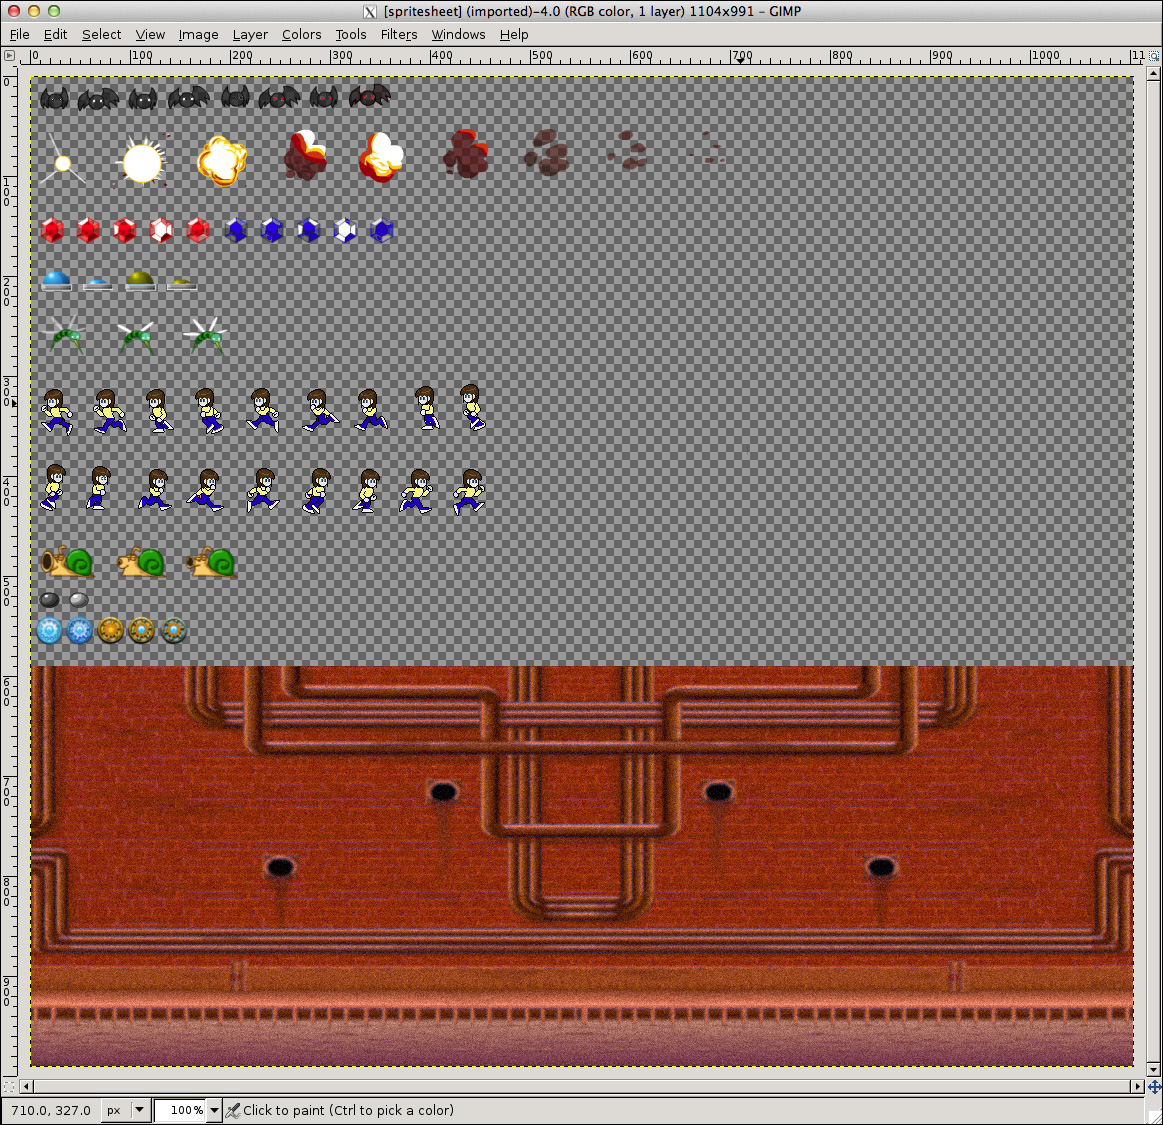
Once you have graphics for your game, you’ll want to manipulate images. A graphics editor, such as GIMP, shown in Figure 2.13, will help you do that. You may not actually have much image manipulation to do, but at the very least you should put all your images in a single sprite sheet, to reduce the number of HTTP requests, making your game load much faster. See [Missing XREF!] for more details about sprite sheets (and for a caveat about mobile devices).
Figure 2.13. Snail Bait’s sprite sheet in GIMP
2.2.3. Sound and Music
Plenty of sites on the Internet let you download freely available sound and music. Snail Bait uses sound effects from Replica Island, and its soundtrack comes from soundclick.com.
Just like you need an image editor for your open source graphics, you’ll also need a sound editor for your sound effects and music. And like graphics, at the very least you will need to put all your game’s sound effects in a single sound file, known as an audio sprite sheet. We discuss how to do that in [Missing XREF!].
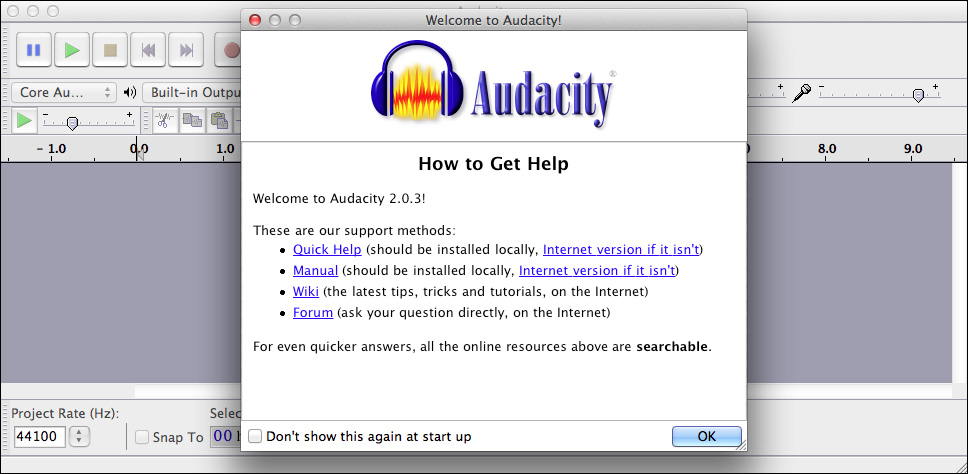
Audacity, an open source sound editor, shown in Figure 2.14, should suffice for all your sound editing needs.
Figure 2.14. Using Audacity to create audio sprites
2.2.4. Animations
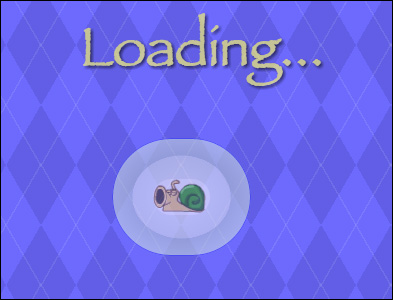
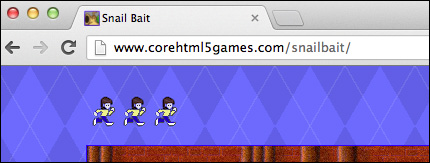
Most games display an animation as they load, typically, a spinning wheel or a progress bar. Snail Bait displays an animation of the game’s snail attempting to shoot snail bombs without ammunition, as shown in Figure 2.15.
Figure 2.15. Snail Bait’s loading animation
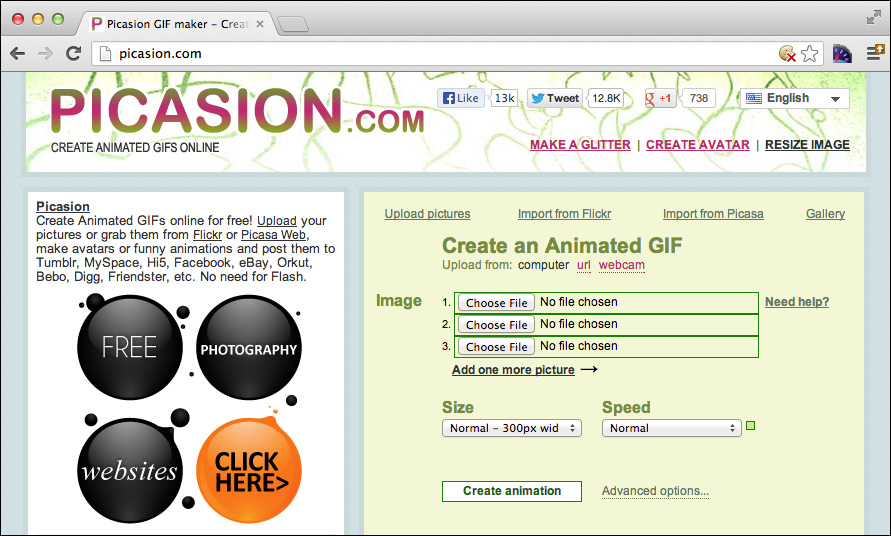
Lots of people seem to be intent on implementing websites that let you create animated GIFs from a series of images. One such website is shown in Figure 2.16.
Figure 2.16. Creating animated GIFs online
2.3. Using CSS Backgrounds
HTML5 games run in a web browser, so in addition to a game’s background for its playing surface, such as Snail Bait’s red-brick background, you must also consider the webpage background.
Figure 2.17 shows Snail Bait’s webpage background, which is drawn with CSS gradients. CSS backgrounds do not incur the overhead associated with an image, and it’s easy to make CSS backgrounds infinitely repeatable in both horizontal and vertical directions so that the background always looks the same regardless of the size of the window.
Figure 2.17. Snail Bait’s webpage background
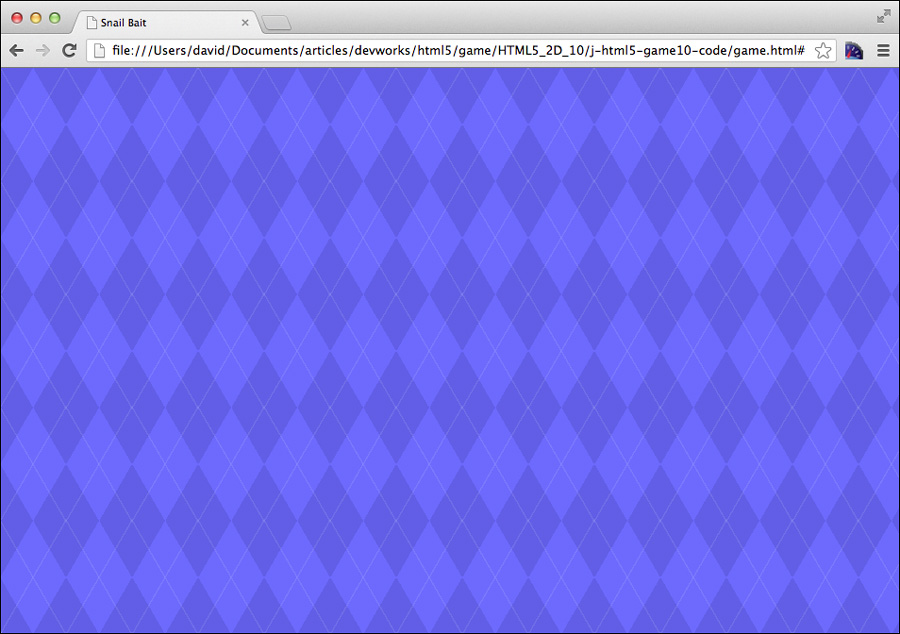
The CSS for the webpage background shown in Figure 2.17 is listed in Example 2.2.
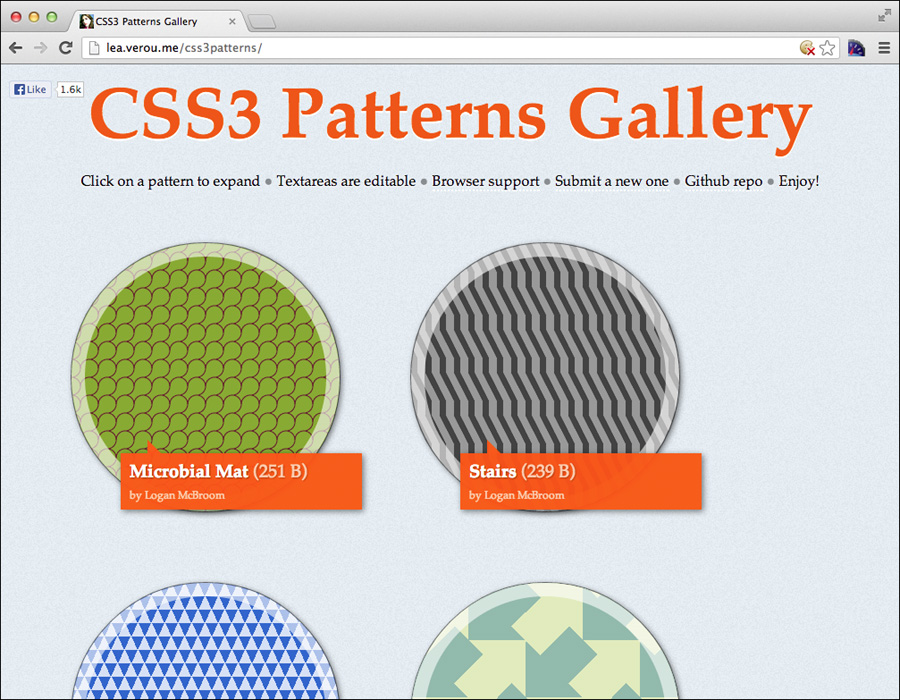
It uses repeating linear gradients to create an argyle effect. That code was copied from the CSS3 Patterns Gallery website, shown in Figure 2.18.
Figure 2.18. The CSS3 Patterns Gallery
Example 2.2. Snail Bait’s background (excerpt from snailbait.css)
body {
/* Background from CSS3 Patterns Gallery by Anna Kassner */
background-color: #6d6aff;
background-image:
repeating-linear-gradient(
120deg, rgba(255,255,255,.1), rgba(255,255,255,.1) 1px,
transparent 1px, transparent 60px),
repeating-linear-gradient(
60deg, rgba(255,255,255,.1), rgba(255,255,255,.1) 1px,
transparent 1px, transparent 60px),
linear-gradient(
60deg, rgba(0,0,0,.1) 25%, transparent 25%, transparent 75%,
rgba(0,0,0,.1) 75%, rgba(0,0,0,.1)),
linear-gradient(
120deg, rgba(0,0,0,.1) 25%, transparent 25%, transparent 75%,
rgba(0,0,0,.1) 75%, rgba(0,0,0,.1));
background-size: 70px 120px;
}
The CSS3 Patterns Gallery lets you select CSS code to create the backgrounds displayed on the website. All you have to do is click the background you want, copy the ensuing CSS code, and put it into your own CSS.
2.4. Generating Favicons
Favicons (short for favorite icons) add a little polish to your game. Snail Bait’s favicon is shown in the browser tab in Figure 2.19.
Figure 2.19. Snail Bait’s favicon
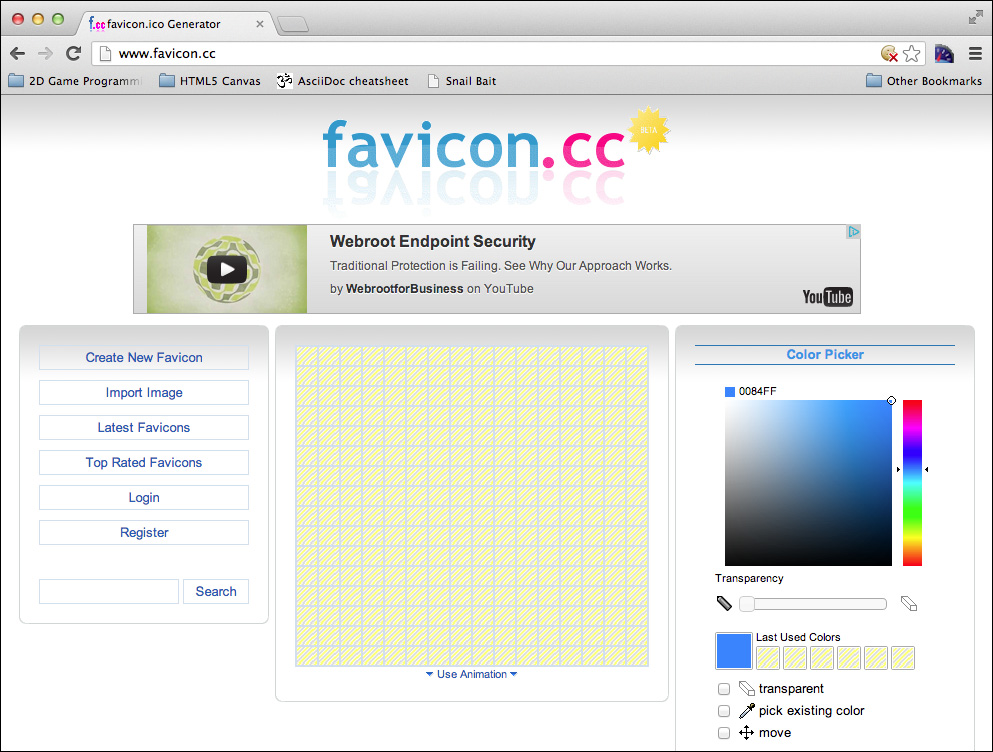
Lots of websites let you create favicons; Figure 2.20 shows one such site.
Figure 2.20. Creating favicons online
After you’ve created a favicon, you can display it by adding a link element in the head section of your HTML, as shown in Example 2.3.
Example 2.3. Specifying Snail Bait’s favicon in HTML
<!DOCTYPE html>
<html>
<head>
<title>Snail Bait</title>
...
<link rel="icon" href="/favicon.ico" type="image/x-icon">
</head>
<body>
...
</body>
</html>
2.5. Shortening the Coding Cycle
JavaScript is an interpreted language, so you need not compile when you change your code. That means you can change your code and simply refresh the browser to immediately restart your game with the most up-to-date changes.
However, refreshing the browser after you change code in your editor means you must switch applications from the editor to the browser and refresh the page, typically with a keystroke or click of the mouse. And then, assuming you’re not finished for the day, you must switch back to your editor.
That switching between applications and refreshing the browser may not seem like a big deal until you do it hundreds of times a day. Automating browser refreshing when you change code in your editor will significantly turbocharge your coding cycle, in turn letting you implement games faster.
To automate browser refreshing when you save changes in your editor, you can use the Ruby script shown in Figure 2.21 that monitors files in a directory. When any of those files change, the Ruby script automatically updates a specific browser window. You indicate the directory and (a regular expression of) the text in the browser window’s address bar, and the Ruby script takes care of the rest.
Figure 2.21. A Ruby script for monitoring files
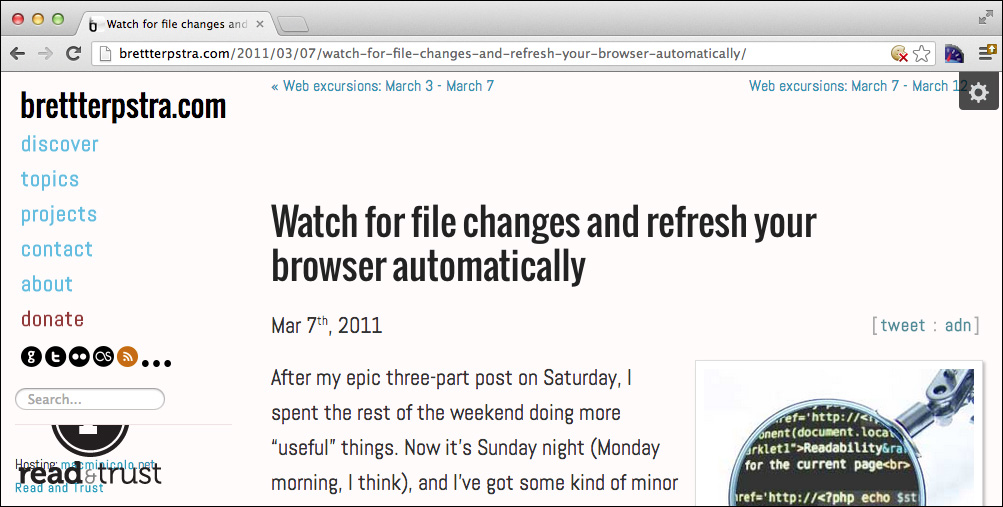
With the Ruby script shown in Figure 2.21 (or something similar) in place, you no longer have to leave your editor as you edit your code. Every time you save your changes in the editor, the Ruby script automatically refreshes the browser window you specified.
![]() Note: The benefits of shortening the coding cycle
Note: The benefits of shortening the coding cycle
If you’re modifying gameplay, the benefits of automatically refreshing the browser when you save files in your editor is minimal because you still must switch from your editor to the browser to test your modifications; the only thing you save by automatically refreshing the browser is the keystroke to reload the page.
If you’re modifying other aspects of the game, for example, the game’s loading screen, you may not have to leave the editor to see changes in your browser after your game automatically reloads.
You’ll get the most out of automatically refreshing the browser when you’re experimenting with CSS. You can change CSS and immediately see the results in the browser without ever leaving your editor, making it easy to make many small adjustments to your game’s CSS in rapid succession.
2.6. Conclusion
Browser developer tools are essential for implementing HTML5 games, and at the time this book was written all major browsers provided capable toolsets. This chapter briefly described the Chrome developer tools, with some guidance about making the most of those tools when you’re implementing games. And browser vendors implement similar enough toolsets that most of what you learned about Chrome developer tools in this chapter is applicable to other browsers.
It’s rare to find skilled video-game developers who are also accomplished artists and musicians, so most game developers rely on other resources for graphics, sound, and music. In this chapter, you’ve seen how to access open source resources and how to incorporate some of them, such as CSS backgrounds and favicons, into your games.
Now that we have all our tools and materials in order, we can start implementing Snail Bait in earnest in the next chapter.
2.7. Exercises
1. Run the final version of Snail Bait in the debugger. Set some breakpoints and step through some code.
2. Run the profiler while Snail Bait is running and evaluate game performance with your particular browser and operating system.
3. The final version of Snail Bait has a showSmokingHoles attribute, which is set to true. Change the line of code that initializes showSmokingHoles so that its value is false instead of true and restart Snail Bait. You should not see smoking holes. Run the profiler without the smoking holes and compare performance with that of the game run with smoking holes turned on.