
5
Effective Management of Process Additives (EMPA)
Mohamedreza Hamedghafarian*
Senior Process Engineer of Gas Plants’ Utilities & Off-Sites, South Pars Gas Complex (SPGC), Phases 20 & 21, National Iranian Gas Company (NIGC), Ministry of Petroleum, I.R. Iran
5.1 Introduction
One of the most important parts of corrosion management in the oil and gas industry is to pay close attention to process additives, solvents, and beds. Depending on the design, each of these materials can be used in a single unit operation and perform in such a way that will require the process designer to redesign. Therefore, a process will inevitably lead to one of the following:
- Energy consumption will increase significantly,
- Equipment volumes will be calculated extremely large,
- Material selection will be very expensive,
- The land required to erect the processing site will be very large,
- For achievement of guaranteed quality (and in some cases quantity) of the products, a large amount of money will be spent to make their production non‐competitive or impossible.
This chapter aims to provide a model of effective management of process additives (EMPA), chemicals, on the processing site. Industrial cases have been presented with the approach of the effects of potentially ineffective management of chemicals on equipment corrosion. The natural gas processing industry has been chosen as the platform for studying and extracting potential cases and operation histories. Among these, the scope of unit operations and the functionality of each work frame stage of various parameters, such as the interactions between quantity and quality control of products with equipment performance, laboratory analysis, procurement of chemicals, quality control when delivering them, their storage, and consumption in the processing site, and in ultimately reporting their consumption, led me to focus only on the subject of process additives to make it possible to provide real‐world cases and further describe their events. A case of a bed, an activated carbon filter (ACF), used for process fluid treatment was also analyzed.
Figure 5.1 Illustration of the limitations for presenting industrial cases.
In addition, because the author's experience is limited to utility process engineering and off‐sites in hydrocarbon processing industries, these two sections of processing sites have been analyzed in more detail. However, one of the examples in the hydrocarbon processing unit (stabilization of gas condensate), which is a reminder of his presence as a senior field operator of the reception facilities units from upstream, was presented. Figure 5.1 illustrates well the limitations of presenting this chapter.
5.2 A Gas Plant
Here, we describe one of the fields of hydrocarbon processing. Natural gas can be found in parts of the earth's depths; extraction wells may be drilled both on the seabed and on land [1]. Usually the fluid that enters the processing site through the feed pipeline has two major phases; liquid and gaseous hydrocarbons. Liquid hydrocarbons are called gas condensates, which can predominantly contain components larger than pentane (C5+) [2]. Gaseous hydrocarbons include components of methane to butane, gaseous sour agents such as carbon dioxide and hydrogen sulfide, as well as nitrogen and water vapor. It is logical that there are various other compounds within these two phases entering the site. It is also clear that almost all of the components in the feed composition are distributed in both phases. For example, a significant portion of propane and butane in feed are present in condensates and are collected from the top of the distillation column when the Reid Vapor Pressure (RVP) is adjusted, which is called condensate stabilization process. If the fluid condition of the reservoir or the method of transferring it to the processing site is such that it causes problems such as hydrate formation and corrosion; then it should be expected that the feed entry to the site will also contain hydrate and corrosion inhibitors (CI) [3, 4]. This gas‐processing site, in which the reservoir fluid enters to make it usable, is called a gas plant.
First, the reservoir fluid is received through the feed pipeline in a set of facilities which are called reception facilities, and then it is sent to various sections for treatment, extraction of different components, conditioning, and finally export. Each of these sections is called an operation unit, in which one or more processes are designed and operated. This set of units allows the production of hydrocarbon products in accordance with contract or design specifications for sale and export. The block diagram in Figure 5.2 clearly represents the reception, production, and export of hydrocarbon products on a typical gas plant (production equals hydrocarbon processing).
5.3 Utilities
The processing units presented in Figure 5.2 cannot carry out their intended operations alone. This is because their operation depends on two other parts of a hydrocarbon processing plant; utilities and off‐sites. Utilities on a gas plant enable production processes to continue working; power for motors, steam required to enhance the reaction, heating and dilution, cooling water, demineralized water, drinking water, utility (service) water, firewater, air required for maintenance activities and, also for instrumentation functions, process air, fuel gas, and nitrogen for different applications are all available for production processes. Off‐sites can include processes of a different nature from the reception and production sections. These processes include storage, gas condensate and liquefied petroleum gas, LPG, export, sour water stripping, some types of process additives and solvents storage, and recovery of solvents and treatment of processes' effluents.
There are one or more processes in each operating unit that a gas plant can encounter. A process unit is a series of interconnected activities with a specific sequence that finally leads to a specific product. Table 5.1 has separated the operations related to each designed process in the gas plant, along with the needs of any operating unit for utilities.
Utility units are of particular importance; these distributed utilities exist in almost every area of the gas plant, it is impossible to produce and export products without them. Therefore, it is important to pay attention to the availability of their production equipment and their distribution system. Utilities are the product of processes designed and installed in the utility section of a gas plant. Products such as methane, ethane, propane, butane, condensate, and sulphur are obtained from hydrocarbon processes that require utilities to continue. Table 5.2 has represented the different types of utilities along with their production process, and main and side applications.
Figure 5.2 The schematic of different operational processing units in a typical gas plant (reception, production, and export).
Table 5.1 Various processes and their needs for different utilities in a typical gas plant.
| Unitsa | Processes in operating units | Needs of processes for different utilitiesb | Utilityc , d , e , f |
|---|---|---|---|
| Reception facilities | Phase separation, filtration, corrosion inhibition, hydrate inhibition, heat exchange | Heating process fluid | Steam |
| Dilution of process additives | Desalinated water | ||
| Preventing oxygen contact to process additives, and process fluids | Nitrogen | ||
| Gas sweetening | Phase separation, filtration, gas/liquid absorption with reaction, solvent regeneration, solvent purification, Foaming inhibition, heat exchange | Heating process fluid | Steam |
| Dilution of process additives | Desalinated water | ||
| Preventing oxygen contact for process additives, and process fluids | Nitrogen | ||
| Cooling process fluid | Seawater | ||
| Recovery of entrained solvent in sweet gas stream | Steam condensate | ||
| Dehydration and mercury removal | Phase separation, heat exchange, adsorption, compression, hydrate inhibition, filtration | Heating process fluid | Steam |
| Preventing oxygen contact for process additives, and process fluids | Nitrogen | ||
| Ethane recovery | Phase separation, distillation, heat exchange, hydrate inhibition, Isenthalpic and isentropic expansion | Heating process fluid | Steam |
| Natural gas liquids (NGL) extraction | Phase separation, Distillation, Heat exchange | Heating process fluid | Steam |
| Cooling process fluid | Power | ||
| Propane sweetening and dehydration | Heat exchange, reaction, phase separation, phase dispersion, filtration, adsorption | Heating process fluid | Steam |
| Dilution of process additives | Desalinated water | ||
| Preventing oxygen contact for process additives | Nitrogen | ||
| Cooling process fluid | Power | ||
| Caustic soda regeneration | Heat exchange, reaction, phase separation, phase dispersion, filtration | Heating process fluid | Steam |
| Dilution of process additives | Desalinated water | ||
| Preventing oxygen contact for process additives | Nitrogen | ||
| Oxidation | Air | ||
| Sulphur recovery | Heat exchange, reaction, phase separation, filtration, gas/liquid absorption with reaction, solvent regeneration, solvent purification, foaming inhibition | Heating process fluid | Steam |
| Dilution of process additives | Desalinated water | ||
| Preventing oxygen contact for process additives, and process fluids | Nitrogen | ||
| Cooling process fluid | Seawater | ||
| Recovery of entrained solvent in sweet gas stream | Steam condensate | ||
| Enhancing the reaction rate | Steam | ||
| Fuel gas | |||
| Solidification and storage of sulphur | Heat exchange, phase separation, solidification | Heating process fluid | Steam |
| Dilution of process additives | Desalinated water | ||
| Preventing oxygen contact for process additives | Nitrogen | ||
| Condensate stabilization | Phase separation, filtration, distillation, compression, heat exchange, corrosion inhibition, desalting, degassing | De‐salting | Desalinated water |
| Maintaining pressure | Fuel gas | ||
| Cooling of compressor's jacket | Service water | ||
| Glycol regeneration and reclaiming | Phase separation, filtration, solvent regeneration, solvent purification, foaming inhibition, corrosion inhibition, heat exchange | Heating process fluid | Steam |
| Dilution of process additives | Desalinated water | ||
| Diluent of effluent | Seawater | ||
| Sour water stripping | Phase separation, distillation, heat exchange | Heating process fluid | Steam |
| Dilution of process additives | Desalinated water | ||
| Flares and burn pit | Phase separation, combustion, reaction | Auxiliary fuel | Fuel gas |
| Reaction | Steam | ||
| Sweep gas | Fuel gas |
a Units “Butane sweetening and dehydration” and “Ethane sweetening and dehydration” were removed because of similarity.
b These are all for continuous use of utilities in normal process operations. For example, water for hydrotest of any kind, nitrogen for pre‐commissioning and other purges, and air for line blowing are not considered.
c The power required for all electric motors, including pumps, air fans, compressors, blowers, mixers and lighting, is not listed.
d The instrument air for the control valve diaphragm is not listed.
e The nitrogen used in steam collection systems is not listed.
f The firewater distributed throughout the site is not listed.
5.4 Process Additives (Chemicals)
As mentioned earlier, this chapter's focus is almost entirely on process additives. In only one case a bed, activated carbon, has been studied. A process additive is a chemical that is continuously or intermittently fed into a process stream. The dose of this substance is a function of the physical and chemical characteristics of the process stream. At the beginning of selecting and/or consuming a process additive, the most basic question is to ask ourselves: what do we want to achieve? The answer to this question is, in fact, to clear the essential for quality control plan. This is further explained in the rest of this chapter, implicitly (Figures 5.10 and 5.20). Process additives in a gas plant have a variety of uses. Some are CIs and others are process stream conditioners. There are almost as many process additives as there are variations in consumption on the utility processing site. Table 5.3 represents the distribution of applying process additives based on the sections; hydrocarbon processing and off‐sites, and the number of feeding points in a typical gas plant.
Table 5.2 Utilities in a typical gas plant, their production processes, and applications (main and side).a
Source: Based on American Water Work Association (AWWA), 2011. Desalination of Seawater, AWWA Manual M61, Denver.
| Utility | Production process | Main application(s) | Side application(s) |
|---|---|---|---|
| Seawater | Seawater intake and coarse filtration | Cooling media, feed of desalination unit | Quench/cooling media |
| Desalinated water (DSW) | Multi effect distillation – thermal vapor compression | Main feed to other processes to produce DW, UW, and DMW | Feed water to de‐salter in condensate stabilization unit |
| Drinking water (DW) | Remineralization of desalinated water | Potable water | Emergency showers/eye washes, laboratory |
| Utility water (UW) | Remineralization of desalinated water | Maintenance application | Intermittently used for sampling coolers |
| Demineralized water (DMW) | Ion exchange of desalinated water | Make up (MU) water to steam generation unit | Solution preparation, turbine blade wash |
| Steam | Water tube boilers and demineralized water, MU, as feed | Heating media | Temperature control, flare smokeless, reaction enhancing, maintenance |
| Cold steam condensate (CSC) | Recovered and cooled steam condensate by different types of coolers | Water washing of some gas streams | Solution preparation |
| Steam condensate (SC) | Recovered and cooled steam condensate to slightly more than its saturation point | Reusing in steam generation cycle | No application |
| Fuel gas (FG) | A side stream from exported methane (see Figure 5.2) | Fuel of boilers, furnaces, and gas generators | Sweep gas in flare system, assist gas, vessel pressurizing |
| Air | Centrifugal and air‐cooled compressor | Instrumentation, oxidation processes | Maintenance, laboratory |
| Nitrogen | Air distillation (cryogenic process) | Inert gas for N2 blanketing and vessel inbreathing/out breathing | Maintenance, laboratory |
a Figure 5.3 can help to better understand the arrangement of water production units to some extent.
Process additives in the utility section are so diverse and extensive that they require a dedicated table (Table 5.4). Some process additives, such as phosphate in steam systems (waste heat boilers on sulphur recovery trains), CI and biocides (on locally closed cooling systems), are fed into the systems located in hydrocarbon processing and off‐site sections. However, due to the non‐alteration of the nature of the work, these process additives are considered as chemicals in the utility section.
As the number of chemicals and the variety of additives and their applications increases, a processing site needs to establish an effective model for managing them around related activities. These activities, which are defined as components of an effective work frame, are discussed in the next sections of this chapter.
Tables 5.3 and 5.4 provide the reader with important information about the range and variety of process additives (chemicals) in all three sections of a typical gas plant. The information is as follows:
- Type of chemicals: traditional chemicals have been written in as they appear in real plants, but the name of chemicals that are licensed or produced by a particular company have been avoided. There are many process additives on the market that any process designer (or field process engineer) can correspond with their manufacturers or suppliers when performing plant design steps; based on their previous design experiences (or change in process fluid conditions).
- The number of feeding points for each chemical plant‐wide: usually utilities and hydrocarbon processing sections are designed and installed in a train‐based manner. This is to make the operation of each of these sections more flexible and to increase the reliability of the production. The number of points given indicates the number of feeding points from each process at different sections of a typical gas plant.
- Chemical feed points: the point at which each chemical is fed into a process stream in an existing unit is given in both tables. These points have a significant number and represent how an individual chemical can be used in different points and applications.
- Application of each chemical: this column represents exactly what purpose each chemical is feeding into a point. Some of these chemicals have one main application and one or more side applications. In these two tables, the author has tried to focus only on the main application, because the characteristics of process additives from one manufacturer to another can be very different, and consequently, this can confuse the reader. For example, a reverse demulsifier can be formulated to regulate the pH, in addition to its performance for separation of oil layer from water, and it has a slight oxidizing property to affect the readily degradable chemical oxygen demand (COD) of oily contaminated aqueous effluents [5–7]. Therefore, adding these properties of chemicals that are formulated for specific purposes may not have a good result in expressing the objectives of this chapter.
Table 5.3 Details about process additives in hydrocarbon processing and off‐sites sections in a typical gas plant.
Section Process additives No. of feed points Point(s) of application Application Feeding regime Hydrocarbon processing Anti‐foam 8 Gas sweetening Prevent foaming Continuous/shock dosing Acid gas enrichment system prior to Claus Unit (sulphur recovery) Ethane sweetening Filter aid 6 Gas sweetening Solvent purification Intermittent Ethane sweetening Intermittent Methanol 6 Reception Breaking formed hydrate Intermittent Dehydration/NGL extraction Intermittent Glycol solution (glycol, water, and amine) 16 Reception facilities Corrosion inhibition and hydrate inhibition Continuous/intermittent CI 10 Condensate stabilization Corrosion inhibition Continuous Demulsifier 2 Condensate stabilization Improve de‐salter performance Continuous Catalyst 2 Caustic soda regeneration Enhance oxidation reactions Continuous Catalyst 2 Sulphur recovery Degassing liquid sulphur product Continuous Off‐sites Anti‐foam 6 Glycol regeneration Prevent foaming Intermittent Inorganic oxygen scavenger 1 Glycol reclaiming package Reclaiming Intermittent Sodium carbonate 1 Sodium chloride 1 CI 6 Glycol regeneration Corrosion inhibition Continuous Reverse demulsifier 2 Sour water stripper Phase separation enhancement Intermittent Urea 1 Biological Treatment Micro‐nutrient Continuous Diammonium Phosphate (DAP) 1 Biological Treatment Micro‐nutrient Continuous Caustic soda 4 Sour water stripper Phase separation enhancement and pH adjustment Intermittent Neutralization package Reverse demulsifier 3 API Separator Demulsifying oils Intermittent Flocculant 3 IGF (Induced Gas Flotator) Making flocs Intermittent Sulphuric acid 2 Neutralization package Adjust pH Intermittent Sodium hypochlorite 1 Treated Effluent Disinfection Continuous Table 5.4 Details about process additives in utility section of a typical gas plant.
Process additives No. of Feed points Point(s) of application Application Feeding regime Neutralizing amine 8 Deaerators output Neutralizing carbon dioxide and pH adjustment Continuous High pressure steam letdown stations Low pressure steam letdown stations Oxygen scavenger 8 Deaerators output Removing oxygen and metal passivation Continuous High pressure steam letdown stations Low pressure steam letdown stations Phosphate 16 Water tube boilers Boiler internal treatment Continuous Waste heat boilers Sodium hypochlorite (seawater electro‐dialysis) 9 Intake chambers Disinfection, filter aid Continuous Pump basins De‐chlorination agent 5 MED–TVC packages (multiple‐effect distillation/thermos‐vapor compression) De‐chlorination Continuous Ion exchange (IOX) Sodium hypochlorite (provided chemical) 2 DSW storage Disinfection Continuous DW distribution CI 10 Firewater MU Corrosion inhibition Continuous Firewater filling Intermittent Closed cooling water system Intermittent Compressor jacket Intermittent Biocide 10 Firewater MU Corrosion inhibition Continuous Firewater filling Intermittent Closed cooling water system Intermittent Compressor jacket Intermittent Anti‐scale 3 MED–TVC packages Prevent scaling and foaming Continuous Anti‐foam 3 Sodium bicarbonate 1 DW and UW unit Remineralization of DW Continuous Remineralization of UW Calcium chloride 1 DW and UW unit Remineralization of DW Continuous Remineralization of UW Caustic soda 2 DMW unit IOX regeneration Intermittent Neutralization Sulphuric acid 2 DMW unit IOX regeneration Intermittent Neutralization - Feeding regime: one of the important factors that distinguishes the attention of a particular chemical and justifies the establishment of an effective management model is the feeding regime for which the design documents of a gas plant are intended. If a chemical is fed into the system continuously, and has a direct effect on product quality and/or corrosion; then the Process Engineering Department has to make a serious distinction between this type of process additive and the chemical that is used rarely, and only at a certain point in specific period of time (e.g. to maintain the quantity or quality of products). The continuation of this chapter represents that some of these types of chemicals (which are fed only in certain periods of time and have no purpose other than maintaining quality and quantity of some products), have a serious impact on the main operating parameters of a gas plant, of which corrosion is one of the most important (see Figure 5.11).
Figure 5.3 represents a schematic of the feeding of various chemicals into the utility units on a typical gas plant. The number of feeding points is given next to the name of each chemical. Traditionally, the gas plant's aqueous waste collection and treatment unit is a part of the off‐sites. However, due to considerations regarding (i) recycling of treated wastewater in the plant and returning it to the hydrocarbon or utility processing section, and (ii) plant layout conditions for conveying gas plant effluents using gravity, which forcibly places the unit along with other utility units (such as seawater desalination and steam generation) in the design of some new gas plants, the gas plant's wastewater treatment unit or plant (WWTP) is considered as part of the utility section. Hence, the arrangement in Figure 5.3 as well as the data in Figure 5.4 are presented based on this fact.
Figure 5.3 also has implicitly represented a comprehensive plan of the arrangement of production units of different types of water, and also steam, their distribution, and then the treatment of aqueous waste streams (effluents).
Note that the type of chemical, the manufacturer/supplier, and the feeding regime into a specific section of the gas plant does not necessarily remain unchanged. The passage of time and operational experiences changes in the products of companies that produce chemicals, the composition of gas plant feedstock, quality control conditions, and plant status in terms of equipment availability are all important and influential factors that tell the process engineering department whether the consumption of a process additive should continue or not, whether the feeding regime should be changed, and many more questions that we need to be prepared to face.
An examination of the contents of Tables 5.3 and 5.4 shows that there are significant differences between process additives in the three sections of the gas plant. These differences are below:
- The number of chemicals used in each section;
- The number of feeding points to which chemicals are fed;
- The effect of feeding these chemicals on the onset and acceleration of corrosion mechanisms;
- Feeding regime of chemicals;
- Having the right to own technical knowledge.
The contents of Tables 5.3 and 5.4 represent an important distinction between the three sections of a gas plant. These distinctions prove how to make the correct decision when it comes to implement a work frame for EMPA and what the priority of implementing this developed model is? These differences are well illustrated in Figure 5.4.
A quick look at this chart reveals that addressing the utility section to implement the EMPA model will be so general that it can cover two other sections of the gas plant.

Figure 5.3 A schematic for the feeding of various chemicals into the utility units on a typical gas plant.
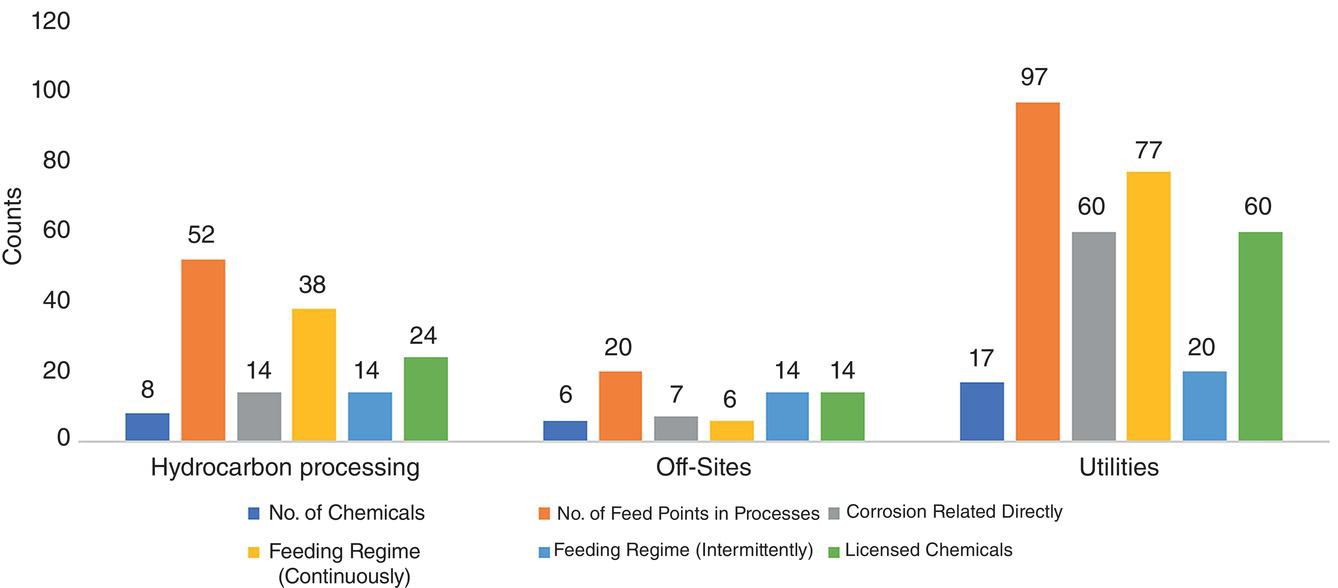
Figure 5.4 Illustrating all process additive related details at different sections in a typical gas plant.
Any reader may analyze this chart in such a way that the priority of dealing with the chemicals in the utility section to establish an EMPA model should be based on an economic analysis and the risk considered for all sections. This is referring to the limitation that it is virtually impossible to care for a gas train if even one gas train is out of service due to corrosion, and if the steam distribution system is damaged due to corrosion. By reducing the production capacity, other gas trains can be applied for compensating the total production, but in case of failure of the steam distribution system, the whole production is practically shut downed.
In the selection of chemicals whose non‐feeding has a direct effect on corrosion, only chemicals which directly influence the prevention of corrosion mechanisms have been considered. It is interesting to note that, for example, the chemical demulsifier for desalter may have a final consequence on the corrosion of the distillation column and other parts of the gas condensate stabilization system; but it doesn't directly influence the corrosion of the equipment like a CI, and ironically, this author selected it. This can tell the process engineering department and also the operation team that we are often surprised when the name of the chemical does not actually CI, and there are other chemicals whose mismanagement, from selection to consumption (and, after that, reporting) on the processing site, will have the same impact on plant corrosion, and perhaps with a greater consequence. Figure 5.1 represents that three of the seven industrial cases have this feature.
In counting the number of chemicals that are licensed to produce, it was possible to estimate the number of these chemicals, in which case the hydrocarbon processing, off‐site, and utility sections were 5, 5, and 11, respectively. The reason for paying attention to the production license for these chemicals was to show the reader how much the use of such process additives can add to the complexity of their effective management on a gas plant. Therefore, in Figure 5.4, the number of points to which these licensed chemicals are fed is given.
Some process additives have dual applications; for example, glycol‐water solution and alkanolamine solution, which is fed at 16 points in reception facilities, is used in some places as hydrate inhibitor and in others as CI. Therefore, in the evaluation of the desired service for each chemical, such cases were also considered.
5.5 Effective Management of Process Additives (EMPA)
Effective management of process additives (chemicals) (EMPA) means the elimination of adverse impacts on the entire operation of an operating (processing) plant in terms of production cost, quality control, corrosion, energy, and environment. If we want to express all the impacts of these chemicals on the performance of a gas plant, then we will encounter the following:
5.5.1 Production Costs
It is clear how much the feeding of chemicals in a gas plant will cost the entire production operation. These costs have a significant impact on the finished cost of different products. Purchasing a chemical can take a lot of time from a process engineering department to a Procurement Department. Carrying out technical selection steps such as advanced and complementary laboratory analysis, pilot preparation, field tests, and environmental permits for new chemicals, as well as procedures for technical–commercial committees to rank different manufacturers/suppliers and then holding tenders are all time‐consuming and costly, and affects the purchase of these materials in a gas plant, as well as influencing the production costs.
A closer look at the cost of chemicals can lead us to warehousing, warehouse‐to‐site delivery, quality control at the time of delivery, after‐sales services, and taxes on the use of certain types of chemicals. On the other hand, due to the role of proper feeding of these chemicals on corrosion and depreciation of equipment, the economy of production is once again affected by these chemicals, due to the increasing depreciation rate and failures that lead to undesired trips of equipment and other facilities installed or partially/totally shutdowns on a gas plant.
5.5.2 Quality Control
Laboratory analysis of process fluids to determine the composition of the percentage of components, different inhibitors, free residual chlorine, phosphate, and oxygen scavenger, and also to determine the adsorption status of an activated carbon bed based on the characteristics of its inlet and outlet fluid or direct measurement of some physical and chemical parameters, are among the things that, while affecting production costs, if they are insufficient, they can lead to corrosion. Chemical quality control at the beginning of entering a warehouse or processing site can tell us whether a chemical is of the right quality to use or not.
Selection and consumption of a specific chemical can be based on the cost of quality control, such as sampling according to a predetermined sampling and analyzing regime on the processing site, quality control of chemicals when delivered from truck or train to warehouse, and from warehouse to processing site, use of complex analytical methods for determining parameters, using expensive online analyzers as well as with their difficult after‐sales services for calibration to control the quality of process streams momentary, spending a lot of time by plant specialists, and forgetting more important tasks, as well as many other influential parameters.
Accurate determination of chemical and physical parameters of solvents such as alkanolamines, glycols, caustic soda (bases), and sulphuric acid (acids) are examples of this type of quality control. Some of these analyses seem insignificant at first; but it is enough to know that, for example, the analysis of insoluble matter (IM) from salts like calcium chloride, sodium bisulfite, and sodium bicarbonate that are purchased solidly and stored in the warehouse can prevent the precipitation of IM in the bottom of the dosing tank and unwanted stoppage due to pump failure or sometimes suction loss (because IM, which forms in the bottom of dosing tank, accumulates in the plunger or diaphragm section of the dosing pump, after passing suction strainer). We know how important it is to stop feeding pumps (here, hardness ions) that have salts added to the desalinated seawater or other process streams. Avoid conditions in which feeding pump stops are eliminated; this makes it easier and more stable to regulate the important parameters such as the Langelier stability index (LSI), calcium carbonate precipitation potential (CCPP), and aggressiveness index (AI), based on what are stated in scientific references [8–11]. This is one of the simplest applications of quality control in the application of chemicals; no matter at what stage it takes place and what degree of effects it has on corrosion and production costs.
5.5.3 Corrosion
Sometimes the impact of EMPA at a processing site is mistakenly limited to CIs and biocides in cooling water, firewater, etc. Something else to think about is the deaeration of the boiler feed water (BFW) fed by an oxygen scavenger chemical (external or pretreatment), or the phosphate inside the boiler drums (internal treatment), as these are important parameters that every utility process engineer or any other person responsible for quality should consider for preventing non‐uniform or localized corrosion, such as pitting and gouging [12]. However, there are small things that can be just as destructive if not addressed as corrosion‐related issues. For example, if the demulsifier of a desalter in a gas condensate stabilization unit has improper control in terms of feeding rate and its performance; it should then be expected that the free water in the distillation column feed will cause corrosion due to water condensation in the upper parts of the distillation column as well as its condenser. Therefore, in dealing with corrosion issues, they should not be categorized into two parts, significant and insignificant; the author of this chapter has seen this mistake repeated on many processing sites.
There are many cases where the proper chemicals are purchased for a processing site and laboratory analysis has misled the unit operator or process engineer to prepare for the corrosion of the equipment itself. How to use chemicals and periodically calibrate equipment related to feeding measurement can also greatly prevent corrosion. Existence of a significant cycle between the results of analyses reported from the quality control parameters, as well as the assurance of the feed that is ongoing, EMPA, can solve a large part of the difficulties in this field. An incorrect evaluation in calculating the retention time of seawater in the transferring pipe to the operating fence of a gas plant or other treatment facilities (utilities) may cause the shock dose coordination time for dechlorination to be incorrectly evaluated, and allow too much free residual chlorine to enter the downstream equipment (stainless steel and copper alloys), which in the presence of seawater can cause severe damage to them [13].
5.5.4 Energy
Energy consumption can be affected by the management of the consumption of a particular chemical at a processing site. On a gas plant, chemicals generally have little effect on energy, but perhaps their impact on the overall consumption in terms of added power for feeding pumps may be considered. For example, the choice of low dilution factor may influence the energy consumption of a processing site, as the feeding pumps in the feeding packages require the use of high speeds and strokes. In this case, if there are more than one hundred feeding pumps in a gas plant, then the impact of these feeding chemicals on increasing numerical power consumption will be significant.
The main effects of EMPA in a gas plant are focused on creating proper management conditions and quality control of various products at the processing site. There are various examples in this regard; (i) forcing to return the deficiently treated oily water effluent to the beginning of the treating cycle due to improper performance of demulsifying and flotation chemicals, (ii) forcing to dump the returned contaminant steam condensate due to improper performance of the deoiling facilities or condensate polishing system installed in the return route of condensed steam (suspect branch), (iii) forcing the return of stripped sour water with high oil content and suspended particles due to feeding and improper selection of demulsifier and pH regulator chemicals can all be clear examples of this. It is obvious that each of these items can increase energy consumption and quality control actions in a processing site.
In hydrocarbon processing units, additional energy consumption may also have a different analysis. For example, when due to poor quality control in the desulphurization section of propane and butane, a gas plant has to send the off‐spec products to flare, energy consumption is affected in the following ways: (i) burning of the off‐spec products, which in addition to imposing a reduction in production to the gas plant, causes some excess fuel gas to be used for better burning in the flare; or (ii) forcing to use moderate to high pressure steam in flare to ensure smokeless flaring that carries considerable energy (operation of flare without smoke).
Obviously, all energy consumption is inextricably linked to environmental issues, because all of these energy components in a gas plant will eventually lead to greenhouse gas (GHG) emissions. Moreover, with a more detailed approach, we can add the environmental impacts of energy generating units to this increase in energy consumption. For example, if a utility boiler needs to generate more than 40 ton/h of steam to perform smokeless flare operation, in practice, the load applied to the environment from the increase in the continuous blowdown with a temperature of 300 °C, the accompanying chemicals, more fuel gas burning in boiler, and more forced fan duty to handle the need of combusted air into a boiler furnace will be added to increased energy consumption in another unit (i.e. steam generation unit).
5.5.5 Environment
The environment is another issue that can be influenced precisely by working with chemicals in a gas plant. Adherence to an EMPA model is certainly guaranteed to prevent environmental impacts due to consumption of chemicals. These impacts are both directly caused by the entry of chemicals into the environment, and indirectly due to the quality control that is done by the chemicals. The importance of the interactions between the use of chemicals and the environment forces us to address them in industrial detail, but the breadth of the chemicals and the details of each process will complicate matters beyond the scope of this chapter. There are several examples of the impact of chemical consumption on the environment [14–16].
If environmental regulations are not followed properly, a gas plant will be fined by local environmental agencies and must be held accountable. Sometimes these fines lead to a reduction of products and will impose production costs in both directions. It is important for a gas plant to always work in the designed capacity, because in design mode the cost per tonnage of production will be at an acceptable level, and planning for sales and determining the unit price of each product will be done correctly. Some costs in a gas plant are independent of the amount of production, and when the processing site reduces its production the cost per products will increase and cause a monetary loss.
The above issues provide some examples of impacts of chemical consumption on the environment. Almost every action taken in connection with the use of chemicals has an environmental aspect [9, 13,16–18], however, in order to search for environmental impacts resulting from their use in a gas plant, one must look for process deviations due to inefficient management of chemicals. A good example is given in the energy section, and there are a few more below.
- If a flotation agent chemical at the input of an IGF is not properly managed the effluent from this equipment may enter the environment without sufficient treatment, in the interval between sampling and analysis of dissolved oils (or emulsified oils) and total suspended solids (TSS).
- If the consumption of the neutralizing amine in the feed water entering a boiler and the steam distribution and steam condensate system connected to it is more than necessary, then the composition of continuous and intermittent boiler water () (blowdown), which contains non‐volatile ingredients of neutralizing amine (that is a formulated chemical), has a higher concentration and more organic load to the WWTP or will enter the environment directly (for some WWTP arrangements that boiler blowdown is routed to the final point, outfall, and the designer may not have considered that).
- If a film‐forming inhibitor has a high concentration of emulsifier materials such as some organic acids in its formulation [18–21], and its consumption is managed in such a way that the residual concentration downstream is not properly monitored, then it can be expected that aqueous and hydrocarbon phase separation do not work properly on downstream, and many organic loads due to the presence of hydrocarbons enter the WWTP, and after their elimination (which may be not enough) the treated wastewater routes the environment.
It is important to keep in mind that the WWTP cannot receive and treat any amount of organic load. On the other hand, there are arrangements in the design to be able to receive and treat pollution loads beyond the design. However, it should be noted that the operation of the WWTP is very sensitive and any conditional changes in it are made with a low factor of certainty in terms of achieving the correct result. Another point in dealing with a WWTP when the incoming effluents deviate from the quality predicted in the design, is that any action to meet the new conditions increases energy consumption and subsequent GHG emission (for example recycling and enhanced biological operations). Therefore, any insufficient quality control in process streams in different units of the gas plant (process effluents), and also for streams inside the WWTP, will lead the WWTP to change its arrangement (temporarily) to compensate for deviations in the quality of process effluents, and impose more pollution on the environment.
Whereas this chapter must deal in detail with the impacts of ineffective chemical management on corrosion, some industrial cases are devoted to the environmental impacts due to corrosion following an improper application of chemicals. The industrial case of contaminated steam condensate in Industrial Case Two (below) can be considered as an example of the impact of improper management of chemicals on corrosion and then environmental impacts [17]. In Section 5.6, the impacts of chemical consumption on the environment are specifically configured.
5.5.6 Process Issues
5.5.6.1 Production Reduction
There are a number of procedures that can reduce production, including the ineffective management of chemicals. Reduction of steam production due to stopping a boiler that had its tubes damaged and improper or incorrect feeding of chemicals used in the pretreatment of BFW to it eventually leads to insufficient supply of steam to processing site, and will then cause an unwanted shutdown of a gas condensate stabilization train, a gas purification and sweetening train, and an extraction train, followed by an LPG purification train. Figure 5.5 represents a better illustration of this path event.

Figure 5.5 Illustration of path event due to lack of generated steam influenced by a chemical, and other consequences on the entire operation of a typical gas plant.
In this case, improper quality control of sulphuric acid (i.e. high concentration of iron), which is applied in the regeneration of strong cation resin, has caused the BFW to be too hard and over time, creates a hole due to sediment deposition and waterside overheating in the tube bank of one of the boilers. Readers can study these references for more details; [12, 18, 22]. From a total of six installed boilers, four were operating at their maximum capacity, and another boiler was undergoing maintenance with the minimum preparation time for its service being estimated at three days. Therefore, steam production was reduced by the capacity of one boiler (250 ton/h) and consequently, one train of gas sweetening and other downstream processing units were inadvertently taken out of service. In Figure 5.5, the chemical that led to this event, the unit that sent its off‐spec product (demineralization unit) to the deaerators prior to boilers, and the chemical whose improper control in new conditions or lack of understanding of the need for new adjustment of continuous blowdown rate are shown, they are pre‐treatment, Sulphuric acid, phosphate, boilers and two blowdowns. The processing units that were affected by these conditions are shown, they are LPG treatment, Ethane recovery, Sulphur recovery, and gas train. The gas plant whose production had been reduced are shown, they are LPG, Methane, Ethane, and Sulphur. This event eventually led to a reduction in feed to the gas plant from the gas extraction platform, which is shown in gray.
5.5.6.2 Off‐spec Products
The method of working with off‐spec products in a gas plant is given in Figure 5.6. While every company has a different approach to its off‐spec products, the content of this figure is based on the basic design of a typical gas plant and may not be generalizable to the entire natural gas industry worldwide. However, some of these methods of dealing with off‐spec products are inevitable, and the presence of normal or special design arrangements will not make a significant difference.
Figure 5.6 How to deal with off‐spec products based on design in a typical gas plant.
5.5.6.2.1 Industrial Case One: Is Steam Condensate Deoiling and Polishing Package an Important Unit Operation?
Steam condensate is an intermediate product within the processing site and while not marketable, is valuable. Ideally, it should return to the deaerator with maximum recycling efficiency, and at the right temperature, pressure, and quality. There is a preparation for suspect condensate that may be contaminated by first routing it into a condensate purification or polisher package (CPP), and then reducing the concentration of hardness ions (by ion exchange, IOX) and non‐volatile organic matter (by ACF), such as leaking oils from the heat exchanger tubes to the deaerator or steam condensate storage tanks [18,23–25].
In this case, if ACF in the CPP is not properly selected, quality controlled, and its output stream is not monitored rigorously by reliable online analyzers or a comprehensive laboratory testing regime, according to Figure 5.7, this product should be routed to the WWTP, and after removing (i.e. reducing to regulatory level) the dissolved oils content, it should be dumped into the sea or other water bays. Here, the onset of leakage from the heat exchanger into the steam system or its condensate will occur with non‐uniform corrosion in the outer surface of reboiler tubes, which is caused by process streams such as rich glycol (underdeposit corrosion) and raw sour water (acidic corrosion).
Based on the amount of steam pressure used at each processing site, which is a function of the heat load required for the boil‐off rate in every fractionating column, as well as the composition of the process streams, return condensate is routed in both suspect (potentially contaminated) and clean condensate. Suspect condensate must pass through the CPP and its potential contaminants (especially non‐volatile organic matter) must be removed by ACF, therefore, quality control arrangement in CPP is of special importance.
Quality control of suspect condensate, which is one of the internal and non‐marketable products of the processing site, is based on two arrangements of dumping condensate to WWTP. The typical basic design has two online hydrocarbon analyzers at the CPP inlet and outlet. In practice, some industrial arrangements consider only one online analyzer sufficient. Another part of quality control is the laboratory analysis of treated condensate from CPP to measure non‐volatile organic matter, while also cross‐checking with an online hydrocarbon analyzer at the output stream. In addition, direct analysis of the activated carbon in the bed of each ACF (if parallel trains are installed for supporting continuous operation) and determination of the iodine number [19, 26], and other quality parameters of the activated carbon can be considered as part of strict control to prevent hydrocarbons from entering the BFW system [6, 27].
In order to maintain CPP performance and increase the flexibility of the process to achieve zero hydrocarbon entry into the BFW, CPP is usually designed as train‐based. In this case, when there is a need to replace the IOX beds (mixed bed resins) or their corresponding ACF, another train (in parallel) can be put in service and prevent the CPP from unplanned stoppage, and then unintentionally dumping the suspect condensate to the WWTP or by‐passing the CPP and sending it to BFW system.
Figure 5.7 Schematic for off‐spec condensate (oily polluted) and its dumping arrangement to WWTP.
If the suspect condensate goes to WWTP due to the CPP not being operational, the make up (MU) water must be used to keep the water level inside the condensate storage tanks constant. This imposes the unwanted production of water on the gas plant utilities, and in turn introduces oxygen‐saturated demineralized water into the steam generation cycle. MU water enters the deaerator and becomes oxygen‐free (equilibrium) by additional consuming steam (because pf lower temperature, therefore more energy consumed, and more GHG emitted), and simultaneously feeding oxygen scavenger. The deaerator is a device that has a high need for stability in operation, and the sudden receipt of MU water or a change in its influence can have a negative impact on its performance. Therefore, not controlling the quality of the suspected condensate to prevent the entry of hydrocarbons (which is done with an ACF) has an indirect impact on the potential oxygen corrosion of the BFW transfer line, boiler, and its condensate distribution system.
On the other hand, its direct impact (i.e. when CPP is by‐passed) on corrosion and difficulty in boiler operation should be seriously considered. Depending on the pressure at which the boiler operates (and, of course, at what temperature), non‐volatile organic matter, mainly hydrocarbons, degrade molecularly in the steam generation cycle to produce acidity [18]. Acidic substances consume some of the alkalinity in the boiler and can reduce the pH of the BW and initiate corrosion inside the boiler (in the event of poor internal treatment) [11, 18, 19]. Decreased alkalinity and increased phosphate concentration, which are the most important signs of acid entering the steam cycle [11] in these cases, are observed. Figure 5.8 shows a set of actual trends from such a situation. In addition, the entry of hydrocarbons into the BFW may cause foaming, and in more severe cases, water droplets inside the steam drum to escape into the steam distribution system (carry over), which has marked corrosion impacts [12, 25].
5.5.6.2.2 Industrial Case Two: A Gas Heater Tube Failure that Influenced A Steam Generation and Distribution System
A gas plant was receiving its feed from the extraction platform. The feed pipeline crosses the seabed for more than 75 km and entered the fence of the processing site. Whereas the desired temperature in the basic design to prevent hydrate formation as well as control the parameters of the sweetening unit (mainly foaming) and drying may be deviated; a gas heater was designed and installed on the feed gas inlet pipeline to the processing site.
The film‐forming CI was fed into the sour gas in a feed gas pipeline at three points of slug catcher, and its formula also contained an alkanolamine to regulate the pH. Contrary to the instructions, the alkanolamine was not fed at the correct percentage for three years of operation.
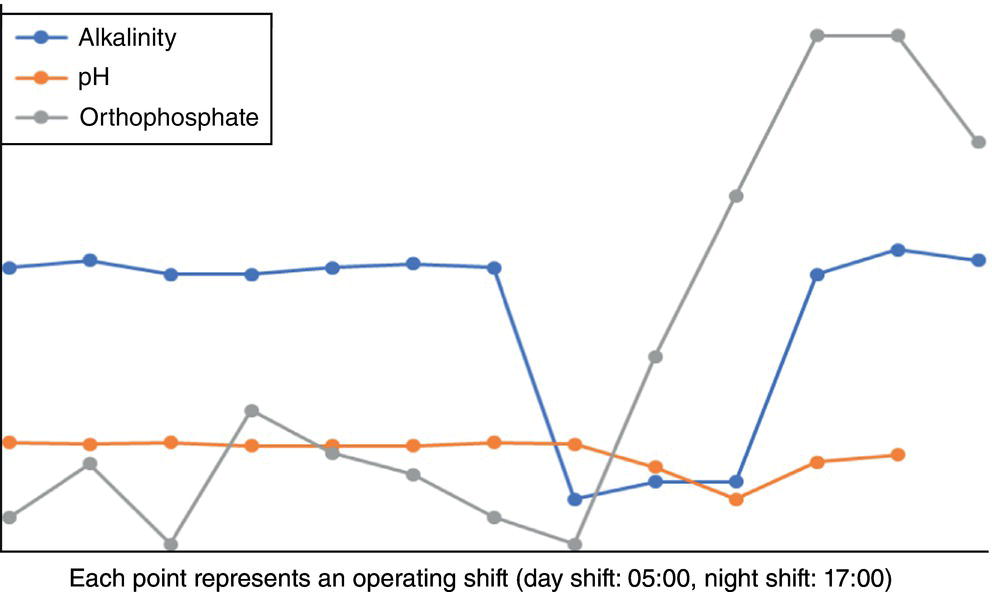
Figure 5.8 Trends of laboratory results due to entry of non‐volatile organic matter into a boiler.
The heater was powered by low‐pressure steam. The condensate obtained from this heat transfer entered a surge drum‐condenser arrangement to ensure that it was completely condensed (slightly subcooled), and sent to the steam condensate collection and return system via a small pump station. In the basic design, the condensate output from this heat exchanger was considered as suspect condensate; therefore, it joined other suspect condensates, then entered the CPP (see Figure 5.7), and after eliminating the contaminants, entered the BFW system (storage tanks and/or deaerators).
Due to temperature fluctuations during the year, this gas heater was serviced occasionally. The heat exchanger was designed so that the sour gas of the gas plant feed passed the tubes and steam entered the shell. The sour nature of the gas and keeping it out of service (both tube side and shell side) for about six months without observing the principles of out‐of‐service preservation [28], as well as difficulties in the inlet steam control system to the heat exchanger, eventually led to localized corrosion, especially pitting, and also microbiologically influenced corrosion (MIC), in the upper rows of tubes, both inside and outside. Figure 5.9 represents the internal surface of a tube in a gas heater which was failed (before and after cleaning). After eliminating of corrosion products and other depositions many pits (localized attack) were observed.
This heater was put into service at the beginning of the cold season without anyone being aware of the possible situation of its leakage, and after 48 hours it presented with a complication in the chemistry control of the boilers and the condensate system. The condensate exiting the heater, which was contaminated due to a leak, was sent to the suspect condensate collection system after cooling in the condenser and collecting in the flash drum. The designer had provided a sample point on the outlet line of the pumps' discharge header, so that if the condensate became contaminated, it could be discharged through a three‐inch‐diameter drain from the collecting flash drum.
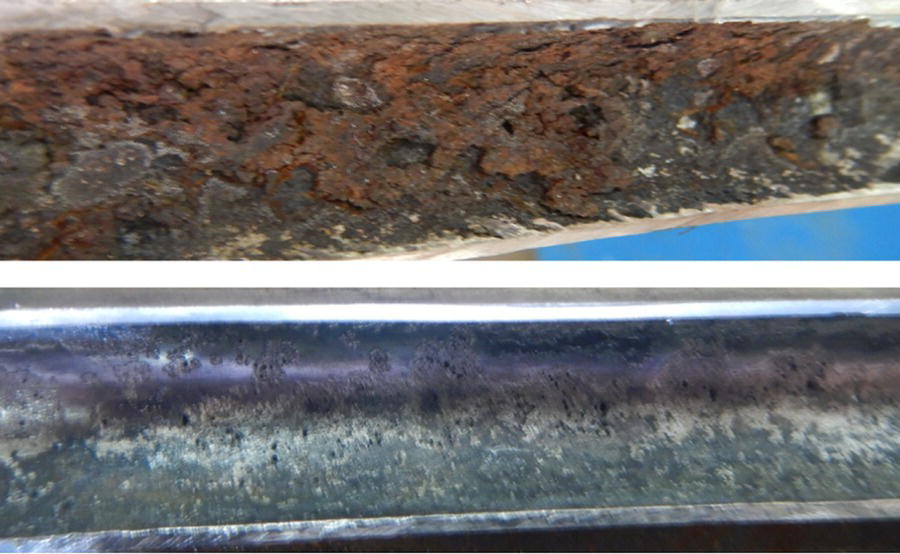
Figure 5.9 Internal surface of a tube in a gas heater; corrosion products and black deposition before cleaning (top), and localized attack and high density of pits after cleaning (bottom).
Insufficient attention to quality control of condensate leaving this pump station caused contaminated condensate (hydrocarbon and sour gas polluted) to enter the collection system. The online analyzer in the route of the suspect condensate entering the CPP was not effectively serviced, and the instrumentation department was in charge of calibrating and repairing after‐sales service periods and a number of spare parts. Therefore, the contaminated steam condensate entered the ACF, and after its saturation, contaminated steam condensate entered to the steam condensate storage tanks. The design had only one hydrocarbon analyzer at the CPP inlet.
The regime of laboratory analyses of CPP input and output was not updated with respect to the new condition of the analyzer, which was not in service (because of the ineffective relationship of the maintenance department with process engineering and operation departments). Therefore, for crosschecking the performance of the analyzer, an analysis is performed every three days to determine non‐volatile organic matter. Given the non‐calibrated status of the hydrocarbon analyzer, it can be clearly understood that it was not sufficient to know the entry point of pollutants into the system.
Simultaneously, the gas plant was preparing a steam condensate storage tank for periodical inspections. Therefore, the suction header of the deaerator feed pumps was placed on this tank to empty its contents as much as possible, and then the rest of its steam condensate (up to 35% height) was to be sent to WWTP. However, the operator, contrary to the existing instructions, had sent the contents of the tank up to 15% to the deaerators. This was while the tank was not boxed up either.
The steam generation unit had an extensive regime of laboratory analyses with different frequencies. Figure 5.10 shows the sampling points and their related analysis of the steam generation site. The table in Figure 5.10 contains only some routine analyses. According to the schedule, the laboratory was asked to perform routine sampling at 05:00; the result of the first set of daily analyses was placed on the software of laboratory information and management system, (LIMS) [29] at 11:30. Boiler phosphate was increasing and the alkalinity inside it was being consumed. The process engineer quickly referred to the sheet related to the results of BFW analysis to check its pH and the results showed that the pH of the BFW did not change; however, the specific conductivity of BFW had tripled.
Because BFW was obtained from the sum of clean and suspect steam condensates, the return condensate analysis sheets were examined, and it was found that the conductivity of the suspect steam condensate was more than five times normal and the pH of the two units had dropped. It was then promptly ordered that the suspect return steam condensate be cut off from the main return header and the MU water, which is highly purified water (demineralized to level of <0.1 μS/cm), increased from 15 m3/h to 75 m3/h.
However, the process engineer (as mentioned in the previous paragraph) did not see a drop in the pH of BFW, because there was a neutralizing amine feeding point after deaeration and the BFW sample point was installed about 25 m after. Therefore, mixing the suspect steam condensate with the clean steam condensate, followed by the feeding of the neutralizing amine, made it impossible to observe the pH reduction for the night shift utility supervisor. This was because the analysis of suspect and clean steam condensate was performed once a day at 05:00 and there was not enough time to react due to the presentation of the related test result at 11:30.
On the other hand, the operator introduced the evacuated and boxed up steam condensate storage tank as out of service and did not allow the sample man to take a grab for analyzing. Therefore, it was not clear whether the tank had contaminants at that height of steam condensate (33%) at 05:00, or whether it was listed in the operating logs of the box‐up clock. Of course, steam condensate storage tanks always have the potential for contamination, but sampling could determine whether the high concentration of hydrocarbons entering the boilers was due to the suction of the oil layer created above the steam condensate surface or only to the leak from the heater.
The list of equipment in service in the last 24 hours was quickly reviewed and the gas heater was listed. The initial conjecture was that hydrocarbons and acid gases leaked into the condensate cycle. Based on experience, with an immediate instruction, the continuous blowdown increased steadily, and the rate of neutralizing amine feeding increased slightly. Immediately, the suction of the deaerator pumping station from the box‐up steam condensate storage tank (with a height of 28%) was stopped and placed on the other two tanks with a height of 90%. The result was that oil analyzers transmitted in the CPP (on‐site) were checked and it was determined that the analyzer has a magenta message in the central control room. This message usually appears when the value being analyzed is outside the range defined for the analyzer, but because of the temporary disconnection of the analyzer from the distributed control system (DCS), no alarm was sent to the control room. In log sheets, where the field operators filled in all the instrumentation readings every two hours, there was no result of this analyzer from the local site display.
Figure 5.10 Event schematic, sample points, and related analyzes.
The next step was to decommission the gas heater in order to prepare it for inspection and leak detection, but that took more than 12 hours. Therefore, the suspect steam condensate analysis sheet was examined in the reception unit (gas heater location) and it was found that the last laboratory analysis was performed the day before the gas heater was put into service. Immediately, a special conductivity analysis was performed from this point by a portable device, and after observing the high conductivity and the pungent odor of the condensate (due to dissolved sour contents), the outlet of the steam condensate flash drum was opened to close the drain system, and the transfer pumps were taken out of service. After that, sampling of the main header of suspect steam condensate was performed at a frequency of 30 minutes, and after 6 hours it was determined that the contamination had reached zero level. Obviously, total iron experimental results were not similar to this trend.
After 48 hours of troubleshooting, the boiler chemistry and MU water rate returned to normal and the gas heater was put into service by plugging the failed tubes. Subsequent studies showed that the second and third trains of CPP had two problems, respectively; ACF saturation, and defects in the control valve sequence system were not available at the time of this event.
In this example, everything that happened in the form of production costs, energy waste, corrosion in boiler systems and steam condensate, environmental issues, quality control, reduction of production and off‐spec products, was in practice, the result of a combination of several important factors, each of which was mentioned separately in the above paragraphs, so it is clear how the use of chemicals such as CI of sour gas feed at the inlet to the gas heater and activated carbon in ACF can have different impacts on the entire operating parameters, and consequently, gas plant performance that Sections 5.5.1 to 5.5.6 referred to. Table 5.5 contains various main occurrences and, their impacts on entire operating parameters.
Table 5.5 Various main occurrences and their impacts on the entire operation.
| List of occurrences during the event | Impacts on entire operation |
|---|---|
| Increase blowdown rate | Production cost, energy, environment, process issue (off‐spec product) |
| Increase neutralizing amine, phosphate, and oxygen scavenger feed rate | Production cost, corrosion, quality control, energy, environment |
| Draining of contaminated condensate from flash drum | Corrosion, quality control, production cost, energy, environment |
| Sour gas feed reduction (reduction in gas trains feed and its related products) | Production cost, process issue (production reduction), process issue (off‐spec product) |
| Opening the gas heater and then its repairing | Production cost, corrosion, environment |
| Closing the main suspect condensate header and its isolation from steam and condensate cycle | Production cost, corrosion, environment, quality control, energy, process issue (off‐spec product) |
| Production of non‐compliance steam and related condensate | Production cost, corrosion, quality control, energy, process issue (off‐spec product) |
| Contamination entering in return condensate system | Production cost, corrosion, quality control, energy, environment |
| pH reduction, alkalinity consuming, and phosphate unbalancing in boilers | Production cost, corrosion, quality control, energy, environment |
| Introduction of acidity into feed boiler water system and economizer | Corrosion, quality control, environment |
| Increase MU water flowrate | Production cost, corrosion, quality control, energy, environment, process issue (production reduction) |
| Replacing two trains of mixed beds (cationic and anionic resin) | Production cost, corrosion, quality control, energy, environment |
| Replacing two beds of ACF | Production cost, corrosion, quality control, energy, environment |
| Complementary laboratory analyses to cover troubleshooting | Production cost, quality control, energy, environment |
Table 5.5 is a strange table; at first glance, one may think, “The author could have said in one sentence that these events that followed had an impact on all parts of an area's performance on a processing site.” By showing the issues, it can show us the results of how to feed a CI and alkanolamine into the sour gas feed, not following of alkaline out of service procedure for gas heater, not checking the gas heater before the start of the cold season and servicing it, while forgetting to control the quality of the steam condensate output from heat exchanger, and finally neglect of quality control to determine the availability of two rows of activated carbon beds. To clarify the author's view of the contents of the right‐hand column of Table 5.5, for example, the interpretation of one of the rows is given below:
5.5.6.2.3 Increase MU Water Flowrate
Production cost: When a suspect steam condensate recovery header is isolated from the main steam condensate return route (to storage tanks, CPP or deaerators), about 60 m3/h of steam condensate is lost from the BFW system. In order to maintain the water level inside the steam condensate storage tanks, operation teams have to increase the MU water from 15 m3/h to 75 m3/h to provide demineralized water for steam generation unit. Decreasing the water level in the tanks can have two impacts on corrosion and reduction in quality of steam, BFW, and return steam condensate.
First, the reduction in liquid level in these tanks will cause atmospheric ingression into them. While storage tanks all have nitrogen blankets, one might ask, so where is the concern? Here are some reasons: The nitrogen pressure control valve (PCV) on a tank has a defined capacity of releasing nitrogen, as well as breaking the vacuum and allowing some air may enter the tank. Another concern is that operation team cannot be sure of the proper operation of these PCVs. Therefore, the probability of carbon dioxide and oxygen ingress into the stored steam condensate increases, and the potential of corrosion also increases [18, 23, 24]. Additionally, despite the removal of non‐volatile organic matter by activated carbon beds, in CPP package, it is not possible to ensure proper monitoring of their performance, as well as zero human and instrumentation error, so a thick or thin hydrocarbon layer is always formed on the condensate surface inside the tank. When steam condensate levels in the tanks went to a very low extent, the entry of non‐volatile organic matter into the boiler is inevitable. It is also necessary to maintain the height of the steam condensate in the tanks to ensure continuous steam generation. Therefore, more demineralized water, MU water, must be produced to meet the needs of the steam‐generating unit, which incurs more costs for plant operations.
Corrosion: When a steam generation unit suddenly receives more than 60 m3/h of MU water, the functional stability of the deaerators should be considered. The inflow of more MU water to the deaerators is always controlled by a set of level controllers with the summation of returned steam condensate and MU water. However, these controllers need a little (or much) time to reach stability and optimal point, with instability sometimes lasting up to several hours. Often the operations team decides to divert MU water to steam condensate storage tanks for a few hours (and possibly until control returns to normal) to prevent this fluctuation in the deaerators, in which case the tanks will suffer from oxygen corrosion [12, 18, 23, 30]. The difference between temperature of the MU water and the return steam condensate must also be included. On the other hand, MU water is saturated with oxygen. We know this because, by adding bisulfite, all free residual chlorine remaining in the demineralization unit feed is removed to prevent damage to the strong anionic and cationic resin matrix [23, 24, 31]. In case of overdose of bisulfite (for dechlorination), part of the dissolved oxygen (DO) is removed, but this is of little importance and is not economical (and also technical). It is therefore reasonable to assume that MU water is saturated with oxygen. This excess oxygen must be removed from the deaerators, and the oxygen scavenger dose must be increased at this time to moderate the impact of large amounts of oxygen entering. Experience has shown that all of these cases have a certain reliability and with increasing MU water flowrate, the equipment will definitely corrode.
Quality control: This was implicitly explained in the two sections above, and all analyses performed to ensure proper quality in the various sections, from putting a desalination unit (for desalinated water production) in service, to deaerators (for oxygen removal), are costly. During this work, fatigue and high workload of laboratory personnel may reduce the quality of the analysis, and also focus less on the analysis of other processing in live sections of the processing site. As explained earlier, the quality control of almost all sections has been affected by this event.
Energy: Increasing the MU water flowrate clearly increases the energy consumption. The desalination unit, which is of multiple effect distillation‐thermo vapor compression (MED–TVC) type, and the desalinated water production unit must be put in service; both of these units consume more energy.
MU water has a temperature of 40 °C, and if it enters the deaerators, steam consumption will increase significantly. This is to restore the function of the deaerator and bring it to 117 °C to ensure the stripping of oxygen and other non‐condensable gases such as carbon dioxide [18, 23, 32].
Environment: All of these actions and additional production have direct impacts on the environment. Energy consumption emits more GHG. Even more stringent sampling regimes from different sectors emit more GHG. Because in such conditions, the laboratory has to quickly use four diesel cars at the same time to get to different parts of the processing site and analyze, while under normal conditions, routine samples are collected and analyzed at a much lower frequency.
Process issues (production reduction): A gas plant can produce a certain amount of industrial and drinking water; the size of this production is quite clear when viewing the distribution to various consumers. A seawater desalination unit and a demineralization unit, which are in series, should provide water to different units such as drinking water, service water, gas condensate stabilization, cooling water, and firewater. When the steam‐generating unit suddenly needs 60 m3/h of MU water due to the constant need of other parts for water, it should be expected that the height of the liquid in the desalinated water storage tanks will decrease. Sometimes this production compensation is not possible, and to keep the steam generation site alive, some consumers are temporarily taken out of the consumption circuit, which also has its own adverse impacts on entire operation.
Figure 5.11 Relationship between various impacts for consumption of chemicals on entire operation and gas plant performance.
At the end of this section, Figure 5.11 clearly represents the impacts of chemical consumption on a gas plant performance, in this figure, the relationship between the various impacts that are in coordination with EMPA is well represented. In the above sub‐sections and two industrial cases, an attempt has been made to implicitly represent the relationship between all these components.
Other cases are given in the last part of this section, in order to clarify the meaning of these interactions on each other with more focus on the potential corrosion of the equipment.
5.5.6.2.4 Industrial Case Three: Corrosion in a Stabilizer Column due to Poor Chemical Performance in WWTP
A gas plant has an independent WWTP to receive and treat its industrial aqueous effluents. One of the parts of this WWTP is the package for receiving and treating oil‐contaminated aqueous effluents, and is called the oily water treatment package (OWTP). Various potentially oily sewers (POS) and oily water sewers (OWS) are routed in this package, and two chemicals are fed into the American Petroleum Institute (API) separator and IGF before entering [20, 33]. This package consists of sections that are covered in Figure 5.12 in appropriate detail.
Figure 5.12 The schematic for influent streams and OWTP.
The normal operation of OWTP is that oil droplets and suspended solids are separated from the oil‐contaminated effluent by gravity, and by using two polyelectrolyte chemicals. The oil‐free effluent then enters a biological treatment [or biological oxidation (BIOX)] package for further treatment and reduction of biodegradable COD to allow for environmental release or advanced treatment and reuse [5, 34]. In the API separator, the oil layer created on the surface is skimmed by two scrappers (one at the beginning of the flow channel and the other at the end), and sent to the recovered oil sump (ROS) [7, 20, 35, 36]. Additionally, scums eliminated from entering stream to IGF are sent to the beginning of the package, oily water inlet sump (OWIS).
OWIS is always a recipient of POS and OWS from different parts of the gas plant. The operation of OWTP is of the batch type. Whenever the POS and OWS level in OWIS exceeds a certain level, the set of effluent transfer pumps, API separator, and IGF, as well as their chemical feeding packages, will be put into service. This operation will continue until the effluent level in OWIS reaches an acceptable value. Each gas plant has its own operation characteristics; therefore, it can be expected that the OWTP has daily, weekly, or even monthly operations. Factors such as rainfall, firefighting drills and/or performance tests, and major maintenance jobs can cause OWTP to remain in service for several weeks. On the other hand, in normal operation, this package can be held out of service for more than a month.
The nature of some POS and OWS streams is such that they can be separated into two phases after a period of time without applying any chemicals, such as demulsifier or mechanical operations. Therefore, it is possible that in some gas plants with very low production of POS and OWS, there is an oily layer on the surface of the effluent in OWIS. This oily layer can act as a magnet for other droplets of oil entering OWIS and become thicker after a while.
On the other hand, the presence of two other factors in the OWTP operation can also contribute to such an event:
- Improper selection of the reverse demulsifier chemical or its overdose to the feed stream of API separator causes a significant amount of chemical to remain in the skimmed oil by the scrapers. These skimmed oils (water–oil mixture) are routed into the ROS, then with a dewatering mechanism, the water in the mixture is removed based on the density difference (location of the lift pump suction) and is returned to the OWIS. Consecutive analyses determine the time to reach the oil and water concentration ratio of 50%/50% (minimum), by volume, then the dewatering operation is stopped and all the water–oil mixture with a ratio of at least 50%/50% is sent to the off‐spec condensate tank.
During dewatering, a significant amount of reverse demulsifier chemical enters the oily water OWIS (beginning of OWTP). This chemical mixes with the raw effluent contained in this sump and over time forms an oily layer on it (like what happens in the API separator).
- In conventional API separators, the skimming operation is appropriate because while the OWTP is in service, the field operator must check the condition of the API channel and the oil layer approaching the inlet and outlet scrapers of the channel every one hour (at least); if the oil layer formed and was approaching the scrapers, then it should guide the scraper to a lower level (by virtue of a vertical rotation mechanism) and collect the oil layer, and after that immediately return the scraper to its original position. This skimmed layer is gravitationally sent to ROS.
ROS has a constant volume. In this case, if it is full, it will overflow and according to the common designs, the overflow will go to the beginning of the OWTP. What comes out of this sump is a water–oil mixture that contains a few demulsifier chemicals, which go back to the OWIS.
If the chemical is not well selected and/or fed, or the field operator is not careful enough to skim the API separator in a timely manner, a significant volume of oily water effluent (dosed with the chemical) then goes into the ROS. Because the oil content in this skimmed effluent is very low, during the dewatering operation all ROS content must be sent to the OWIS to return to the treatment cycle. On the other hand, what goes to the off‐spec condensate tank as a dewatered water–oil mixture (at least 50%/50% ratio) is considered as part of the feed of a gas condensate stabilization unit.
The stabilization unit is designed to receive and adjust the RVP for gas condensate (see Figure 5.2). This unit consists of a set of heat exchangers, flash and gravity separators, desalter, distillation column, and compressors. Whenever the operating conditions of this unit are such that it cannot receive gas condensate from the extraction platform, these gas condensates are temporarily directed to the off‐spec tank. If, for operational reasons, the product of the stabilization unit is not of proper quality to be sent to the storage section (e.g. not adjusted RVP and not filtered, correctly), this off‐spec product (Figure 5.6) is then sent to the off‐spec tank. Depending on the design, the off‐spec tank can receive the entire gas condensate feed or off‐spec product, which is produced by the stabilization unit for a specified period of time.
After reaching stable operating conditions, the contents of this tank are received by the gas condensate stabilization unit, so that the tank is ready (empty) for further events. Due to the limited capacity to receive and stabilize gas condensate in the feed of a gas plant, it is obvious that by receiving gas condensate (and water–oil mixture) from the off‐spec tank, the amount of production from the gas extraction platform must be reduced. Figure 5.13 shows the gas condensate stabilization unit with the off‐spec tank; although in this figure the three sections shown in gray do not exist in some gas plants. This design is to prevent (or minimize) the water in the bottom of the off‐spec tank (which is the product of water–oil mixture input from ROS) into the gas condensate stabilization unit. High concentration of some readily biodegradable aqueous phases like glycols, small flow, presence of heavy metals, and major pollution by oil forces the designer to select sequencing batch reactor (SBR) for BIOX [5, 37]. Gas plants that do not have these three gray sections have more capacity to receive water in the three‐phase separator, and the water in the bottom of the off‐spec condensate tank enters the gas condensate stabilization unit, directly.
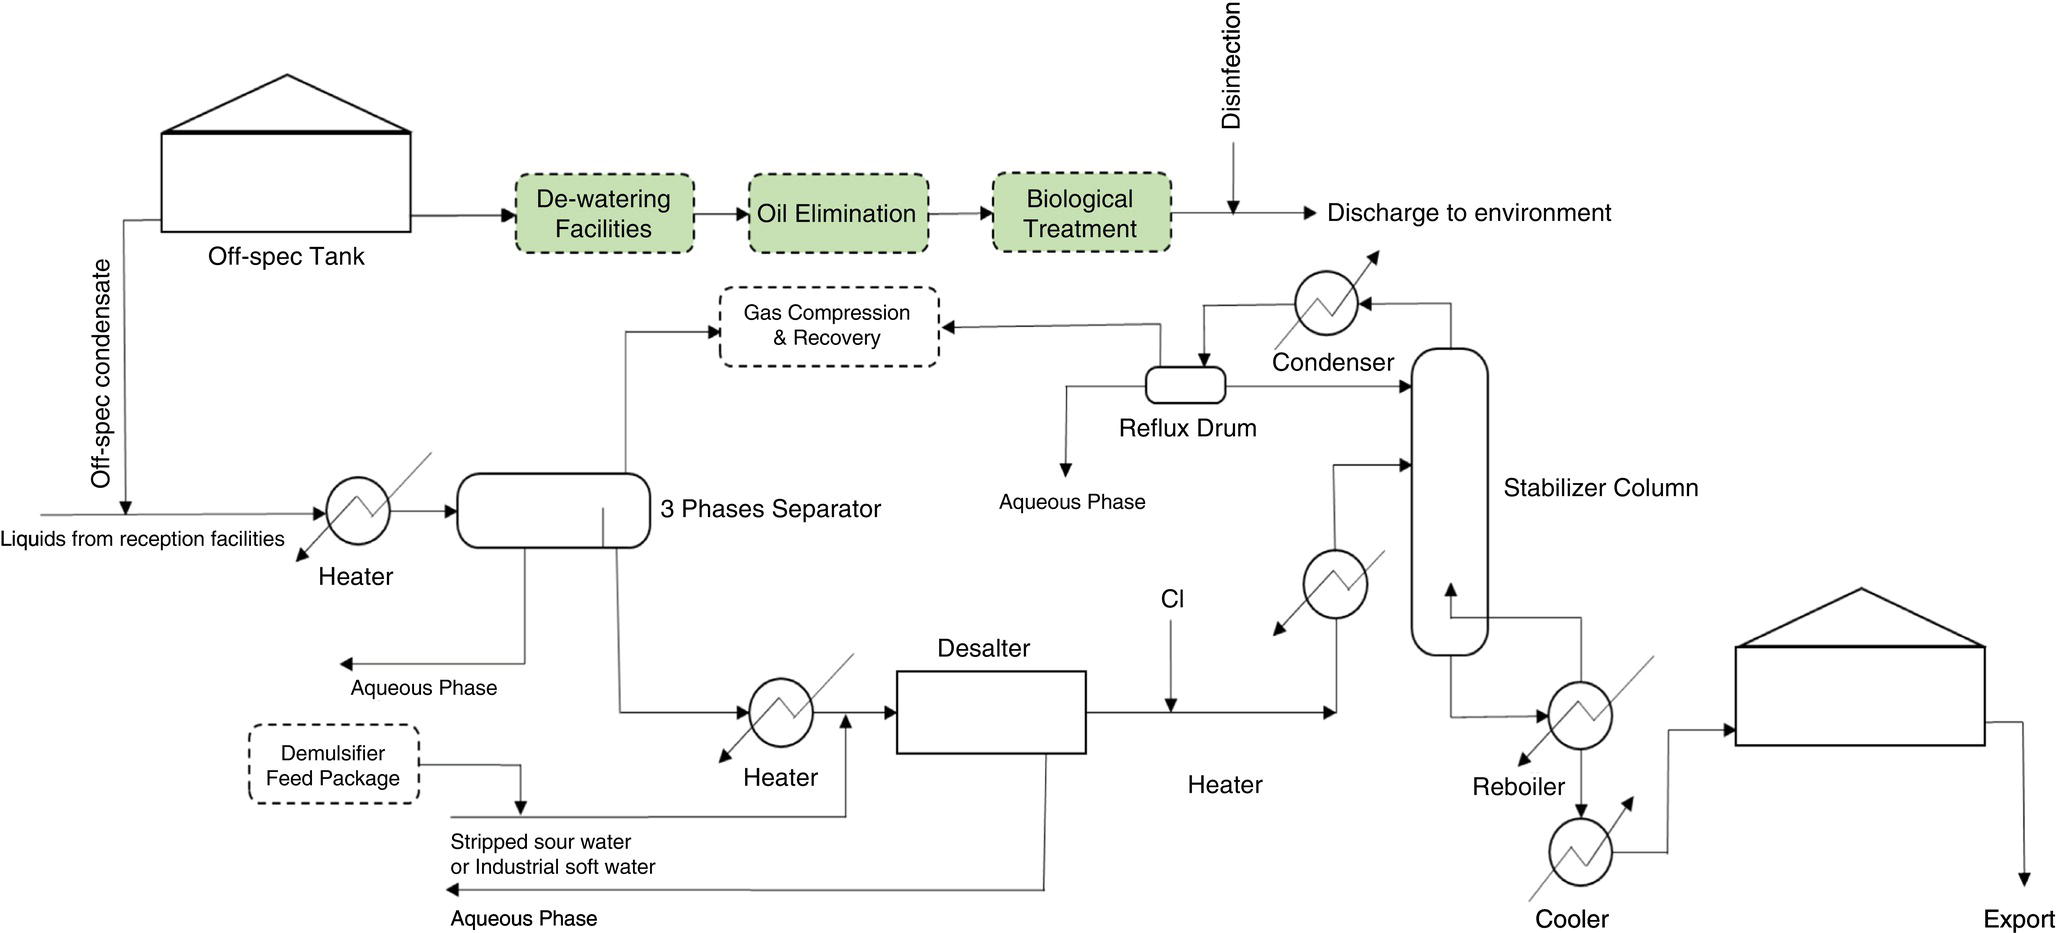
Figure 5.13 Gas condensate stabilization unit with off‐spec tank.
The process is described in the gas condensate stabilization unit as follows:
First, liquid feed enters the unit from the reception facilities (slug catcher and manifold). The fluid flow then enters a heater for better performance of the phase separation in the three‐phase separator. In the separator, a gas phase enters a header to collect valuable gases and then goes to the gas compression and recovery section. An aqueous phase present in the liquids entering the unit is formed in the separator, which is sent to the aqueous phase recovery units, such as glycol regeneration or similar facilities. Gas condensate also separates as an organic phase in the separator and enters a heater. This heater is for warming the gas condensate before entering the desalter.
Because the entry of water and mineral salts into the distillation column causes severe corrosion, these two components must be removed from the gas condensate stream before entering the column. Therefore, in order to better separate the aqueous phase from the gas condensate (organic) phase, a water‐rich stream (oil‐free water) is first used along with the demulsifier chemical to facilitate the separation of the aqueous and organic phases, and implicitly salt (inorganic) in extract aqueous phase (inorganic). A set of high voltage electrodes inside the desalter make it possible to separate the aqueous layer (and also salts) and the organic phase in a high degree [20]. Concentrated water with salt collects in the lower layer of liquids in the desalter and is sent to downstream units to purify or recover materials such as glycol‐based solvents.
After the amount of water and salt in the gas condensate stream reaches the allowable limit, the gas condensate outlet stream from the desalter passes a heater to preheat before entering into the stabilization (or distillation) column. In the column, the vapor phase is supplied by a reboiler at the bottom of the column, and the liquid phase by a condenser at the top of the column. The final product of this column, stabilized gas condensate, is taken out from the bottom of the column, and after cooling, stabilized gas condensate is sent to storage tanks to be exported to tankers and oil refineries. The gases released from the reflux drum are also recompressed due to the presence of light hydrocarbons such as propane and butane and sent to the beginning of the gas trains for NGL extraction (see Figure 5.2).

Figure 5.14 Acid corrosion at top of stabilization column (vapor outlet piping to condenser).
The gas plant had an OWTP and two trains of gas condensate stabilization. An acid corrosion was observed in the upper parts of the column and its condenser (Figure 5.14). When these corrosions were first observed in the overhaul, the definitive statement was that the chloride ion in the gas condensate hydrolyzed at column temperature to form hydrochloric acid. Acid droplets had condensed on the inner surface of the column at the top, creating localized corrosion.
According to the design, a film forming amine‐type CI was fed into the gas condensate stream entering the column. In addition to its film forming properties, this CI had neutralizer (and volatile) amine ingredients in its composition to neutralize some of the possible acidic agents created during flashing into the column and the boiling of the feed in the column. The technical conclusions have reached a point where they make the neutralizing amine in the CI more concentrated and volatile. After one year of operation, localized corrosion was observed again in the same sections without changing the extent of the attack and the depth of the pits.
Engineering studies have shown that not paying attention to the routine measurement of water content in the gas condensate entering the distillation column has caused the volume of incoming water and the amount of mineral salts in it to increase. Investigations also showed that the operating team did not routinely draw water off from the top of the column, and that this standard operating procedure was largely forgotten.
Further investigation showed that incorrect feeding of the reverse demulsifier into the feed of the API separator and its incorrect operation caused a large amount of untreated effluent dosed with the reverse demulsifier chemical to return to the OWIS and raise the effluent level inside it, the field operator has to send the API separator effluent to ROS and then pump it to the off‐spec condensate tank after dewatering (which was practically useless, knowing that the water concentration in this mixture is more than 80%). The high rate of effluent received in ROS and the very low concentration of oil in it had caused the height of the sump to increase rapidly, and due to the volume limitation of the off‐spec condensate tank, the gas plant had to receive some part of the off‐spec condensate tank content in gas condensate stabilization units, daily.
Calculations and other site evidence showed that in a three‐year period of operation, the volume of water received in the gas condensate stabilization unit was more than 27 times the design specification (unit turndown was 130%). Therefore, the equipment that was intended to eliminate the water phase (three‐phase separator, desalter, and water draw‐off facilities on column) could not remove this excess water from the design and water entered the distillation column. Examination of the laboratory databank showed that the analysis of the concentration of water entering the column, which was an important part of the quality control plan of this unit, could not be measured due to the molar ratio of water outside the defined method test, and the laboratory has not attempted to replace the test method nor to inform the operations team.
An intelligent reader may ask “Why did the operator of the gas condensate stabilization unit not gradually receive feed from the off‐spec condensate tank?” (so that she/he could better control the concentration of water entering the unit and not get too far away from the turndown). The answer is; it was not possible to reduce the feed of the gas plant from the extraction platform for this unit. On the other hand, the volume of the off‐spec condensate tank was limited to hold the off‐spec condensate, and a significant amount of water–oil mixture had to be entered daily.
Investigations continued and it was found that one of the causes of improper separation of oil from water was not paying attention to the proper dose of reverse demulsifier. The dose recommended by the manufacturer was 3–10 ppm and the consumption calculations in the three months leading up to the study showed that the dose was greater than 500 ppm This extremely high dose of the chemical resulted in the formation of a turbid mixture and a stable emulsion of water and oil at the API separator and IGF outputs, which in no way allowed phase separation (Figure 5.15). Volume constraints on ROS, OWIS, and off‐spec tank allowed the OWTP field operator to send it to a BIOX package, regardless of the quality of the effluent treated at OWTP.
Regulating the pH at the beginning of the BIOX process, as well as the biological degradation of the demulsifier by the microorganisms in related suspended and attached growth arrangements, caused the oil in the effluent of OWTP (feed of the BIOX) to separate from stream and float on the clarifiers as a free‐oil layer. Figure 5.16 represents an example of this oil contamination in the BIOX package introduced by the effluent from the OWTP.

Figure 5.15 Presentation of overdosing of a reverse demulsifier chemical into a stream of oily contaminated sewer water. While gas condensate presents equally in each bottle, the interphase layer does not see it because gas condensate is colorless.
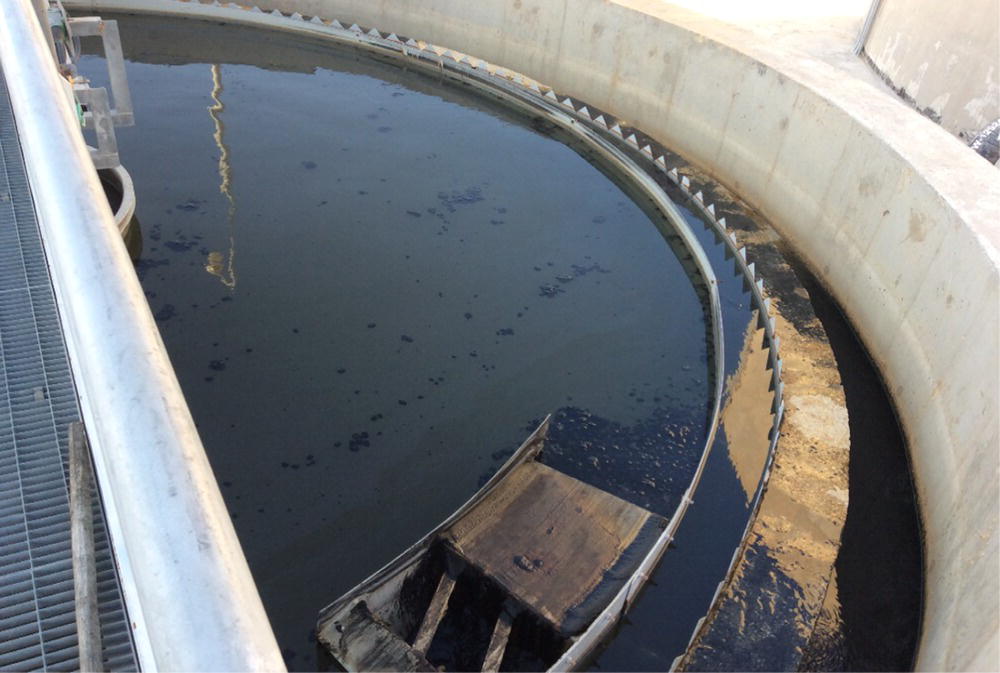
Figure 5.16 Free‐oil layer on clarifier next to a BIOX filter (BIOX filter was trickling super high rate [5]).
The WWTP also had a spent caustic soda neutralization package (SCNP) used in the propane, and butane–mercaptan removal or sweetening units [7, 36]. The spent caustic in this package neutralized with sulphuric acid, and after regulating its pH in the range of 7–8.5, the neutralized effluent went to the OWIS. Further investigation showed that the feeding of sulphuric acid was stopped due to the entry of contamination into its storage and dosing system (operation history 12); therefore it was not possible to feed acid into the reactor in the SCNP. The effluent from the SCNP was mixed with the stripped sour water (pH = 2.7–3.5) and its pH barely dropped to 11.5 (from original range of 12.3–13.5). Due to the entry of un‐neutralized effluent from the SCNP alone, the field operator had to increase the dose of the demulsifier and thought that with increasing the chemical dose, the separation would be better.
The OWTP mass and hydraulic balance calculations were carefully reviewed and it was concluded that the total oil (and some entrained water) skimmed by the scrapers from the API separator surface should have been 190 kg/h at shock load of 1000 ppm oil in feed (design case). However, a review of DCS data (level transmitters) for the volume received in ROS and OWIS showed that the volume of water–oil mixture skimmed by scrapers entering these two sections was more than 6000 kg/h (the study period of the trends was six months). Studies have shown that poor operation and lowering of scrapers instead of routinely checking the site had caused such a situation.
5.5.6.3 Operation History 1
Another gas plant had a very small volume of POS and OWS. The design and arrangement of the units on this plant was quite similar to the processing site mentioned in Industrial Case Two. At this gas plant, the operation of OWTP was inappropriate and a thick layer of oil was formed on the OWIS. This layer of oil acted as a cover on the stagnant water below, so that the water layer below could not come into contact with air and sunlight (anaerobic condition). Additionally, the management of sludge formed in the lower part of the water layer was very poor and the sludge was not removed from the system for a long time.
Measurements showed that sulfate reducing bacteria (SRB) were present in stagnant water layer with an intensity of 100 000 CFU/ml. This water layer is sent to the off‐spec condensate tank according to Figure 5.12 and from there enters the gas condensate stabilization unit, after which it proceeds to the glycol recovery and sour water stripping units. The recovered glycol, which contains at least 30% by weight of the same water, was pumped to the platform to prevent corrosion and hydrate formation of the feed pipeline to the gas plant. Part of the stripped sour water was also used in the desalter [38]; hence, the SRB in OWIS extended to the entire upstream part of the gas plant and included various units.
A standard coupon was tied with a non‐metallic string and placed under the oil layer formed in the OWIS, and after six months, several very sticky biofilm accumulation sites were seen on it. After removing the biofilms, black residuals were observed inside the pits which represents iron corrosion products of MIC [18, 39]. Figure 5.17 represents the coupon after cleaning and acid washing.
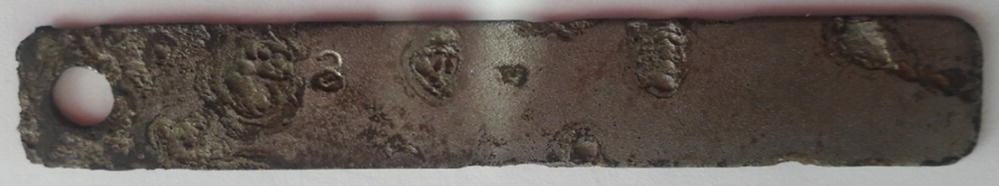
Figure 5.17 A corrosion coupon placed under oil layer in OWIS with occurred MIC.
Investigations showed that a set of heat exchangers in the reception units, which had general corrosion and minor pits, were completely destroyed after a short period of service, and laboratory and technical studies showed that the predominant corrosion mechanism of this equipment was MIC.
5.5.6.4 Operation History 2
Another gas plant reported that the transfer of water–oil mixture to the off‐spec tank was stopped due to both occasional and severe clogging of the transferring line. Investigations have shown that improper feeding of demulsifier and improper operation of scarpers in the API separator caused the transfer of large volumes of effluent to the ROS, and the continuous operation of the lift pumps in this sump caused their frequent breakdowns. Therefore, within three weeks when the main pump and spare pump were out of service, the water–oil mixture in the pipeline was coagulated and the transferring line was severely clogged.
The opening of the transferring line took a long time due to its length and large number of piping details, and the effluent retention in OWIS caused both gradual phase separation and growth of SRB in the aqueous layer. Given that this gas plant also had a design very similar to the previous two processing sites, it can be expected that the equipment upstream of this gas plant also had a risk of MIC.
The water–oil mixture transferring line was about 1500 m long and had a slope of 15° from the ROS to the off‐spec condensate tank. Therefore, when pumping from ROS stopped and dewatering was performed, this line was emptied from the dewatering drain valve. Prolonged dewatering operations and forgetfulness of the field operator to close the dewatering valve until the ROS was refilled caused a check‐valve to be installed after the dewatering valve. A three‐year monitoring of the processing site showed that the problem of transferring the water–oil mixture to the off‐spec condensate tank was completely eliminated, and due to the reduced effluent retention time in OWIS, the possibility of SRB formation and microbial corrosion risk was greatly reduced. Figure 5.18 shows the installation location of this check valve, that is installed on a pipeline with a length of 1500 meters.
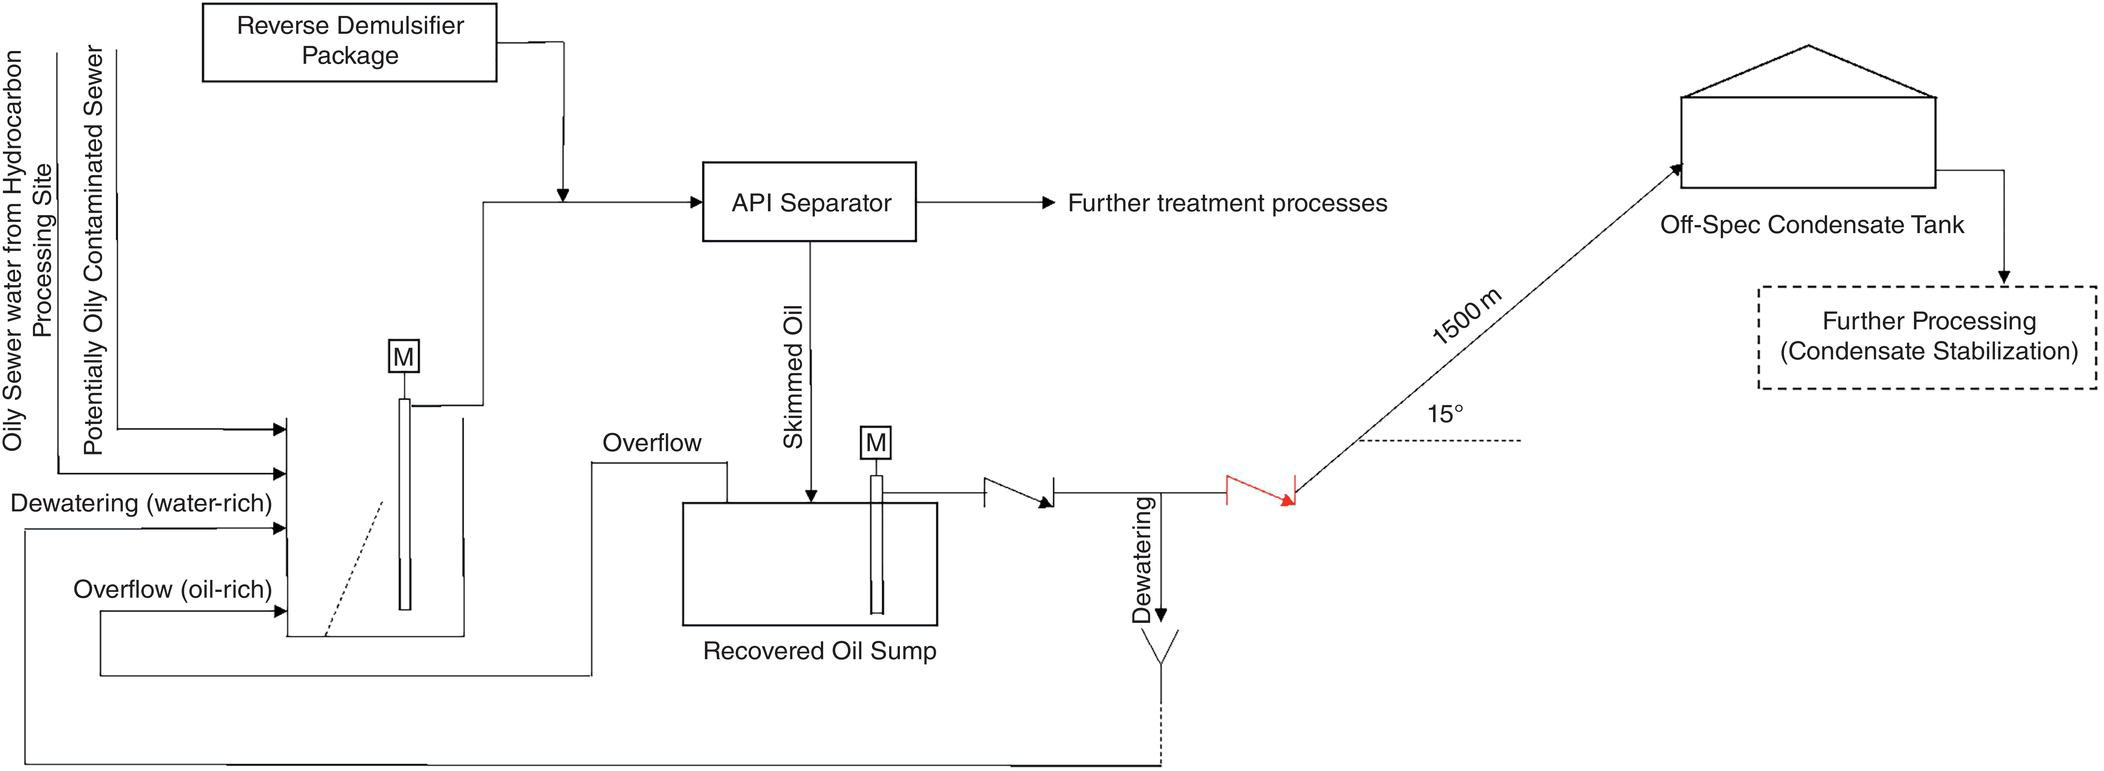
Figure 5.18 Location of OWTP, off‐spec condensate tank, and an installed check‐valve on transferring line.
5.5.6.4.1 Industrial Case Four: Corrosion in Seawater Thermal Desalination (Chlorination and Dechlorination of Seawater)
There was a set of utility facilities at a coastal gas plant. Water was supplied from the sea and entered a set of MED–TVC packages for desalination. Incoming seawater was also applied to cool large parts of the processing site (process heat exchangers). The water produced from this package was sent to other processing units such as demineralization, cooling water, firewater, and drinking water for various applications throughout the gas plant. Sodium hypochlorite was fed into seawater in two locations on seawater intake facilities (SWI) [40]. The intake basin was of equilibrium type [8], therefore, there was a set of pipes (chambers) connecting the sea and the water intake basin. Sodium hypochlorite was continuously fed into the beginning of these intake chambers (location one). After the chlorinated seawater entered the receiving basins, a set of lift pumps directed this water to the coarse filters and then sent it to the gas plant at a distance of 3 km. Sodium hypochlorite was also continuously fed into the seawater in the lift pump chamber (location two).
To prevent organisms and marine animals from adapting to the fed dose of sodium hypochlorite, four doses of shock (each lasting 15 minutes) were fed at both locations. Sodium hypochlorite was produced by electrodialysis of seawater (at a concentration of 1–1.5% by weight). It inhibited the growth of organisms and biofouling, as well as the growth of marine animals in the transferring pipes and heat exchangers at the gas plant. Figure 5.19 represents a heavy marine animal growth on the condenser feed channel and on a side wall of the evaporator in a MED–TVC due to poor feeding of sodium hypochlorite. Additionally, continuous sodium hypochlorite feeding increased the efficiency of seawater filtration in the SWI and minimized the operational difficulties caused by the entry of solid particles into the downstream facilities.

Figure 5.19 Marine animal growth in a MED–TVC.
The desalination unit was located downstream of the seawater pipelines. The packages in this unit are made of stainless steel and copper alloy. When highly chlorinated seawater if fed to the evaporator inside, the bromine gas is released from the seawater and causes the following problems; one is a corrosion problem on copper alloy and stainless steel, and another is degradation of desalinated water quality of conductivity and lower pH. Therefore, chlorinated seawater must be dechlorinated before entering evaporators in MED–TVC. Dechlorination was performed with a sodium bisulfite feed package. Based on the logic defined in it, this package operated in full coordination with continuous doses, and four daily shocks designed in the SWI. The maximum prescribed amount of residual chlorine after sodium bisulfite feeding was considered in the plant's documents as a maximum of 0.15 ppm, and another source reported this amount as 0.25 ppm [13].
Seawater feed should be deaerated prior to entering the MED–TVC, and the oxygen level should be lowered to 20 ppb [13, 41, 42]. The required dose of sodium metabisulfite for complete elimination of 1 mg/l oxygen is 6.5 mg/l [18, 19].
In the first inspection, corrosion due to the presence of residual‐free residual chlorine was observed in each of the MED–TVC packages. Studies on the amount of sodium bisulfite feeding showed that quality control in this area had several drawbacks, which are as follows:
- The fed dose of sodium hypochlorite in the SWI had not been reported to the gas plant (the concentration of sodium hypochlorite in its storage tank and its feed flow to different locations of the SWI had not been measured and reported).
- The residual‐free chlorine concentration calibration table was not prepared and was not regularly updated (using the measurement of residual chlorine at the inlet of seawater to the gas plant, measuring the residence time of chlorinated water in the transferring pipe based on the volume of the pipe and its flowrate, and, finally, measurement of chlorine demand at calculated residence time).
- At the gas plant (utility section), the equivalent stoichiometric dose for dechlorination along with the safe dose was not calculated (sodium bisulfite concentration in the tank was not measured routinely and its feeding pumps were not calibrated, also quality control for sodium bisulfite at the beginning of entering the warehouse was not performed) [19, 43].
- The control logic related to chlorination shock at SWI was not connected to the gas plant main control system for one year after commissioning. After logic connection to the control system, the timing of chlorination shock pumps (in SWI) and dechlorination shock pumps (in gas plant's utilities) showed a significant difference.
Figure 5.20 shows a view of the SWI and its position relative to the gas plant. Quality control points and other measuring elements such as flow meters and sampling points are shown.
5.5.6.4.2 Industrial Case Five: Corrosion in the Boiler Due to Improper Chemical Control in the Face of an Operational Error
A utility processing site had eight water tube boilers with a capacity of 2400 tons per hour. MU water was supplied through a thermal desalination unit and then an IOX unit with a mixed bed. Chlorinated seawater entered the utility processing site and was converted to industrial water in thermal desalination with a specific conductivity of less than 20 μS/cm. Due to the fact that the operating pressure of the boilers was more than 62 bar, this water was not suitable for entering the steam production system (as MU water), so two mixed beds with strong anionic and cationic resins were applied to bring the water quality to lower than 0.1 μS/cm.
One night in the winter of 2015 at 23:40, there was a sudden demand of 230 m3/h for desalinated water by the firewater unit. Two thermal desalination packages (out of a total of four packages) were serviced simultaneously to compensate for the need for industrial water. Traditionally, at the beginning of each package, approximately 15 minutes from the production of the package was sent to the outfall basin (where rejected to sea) to achieve the desired quality (conductivity of less than 20 μS/cm), and then all the desalinated water produced was sent to desalinated storage tanks and to general distribution (with a normally close arrangement).
The thermal desalination package had a quality control logic, which sent the produced (desalinated) water with a quality of less than 20 μS/cm to the desalinated storage tanks and to general distribution. If the specific conductivity was more than 20 μS/cm, then this water would be sent to the outfall basin to reject to the sea (Figure 5.21). Due to a malfunction in one of the valves of this control logic in one of the packages, the untreated seawater entered the desalinated storage tanks directly, for 10 minutes. This water was pumped to the demineralization unit where there were two mixed bed columns. One of them was checking the quality of the resin and had an unacceptable pressure drop. The other column was in service and its IOX capacity was quickly exhausted. Due to the unavailability of its parallel train (which was checking resin quality), the demineralization unit was taken out of service and contaminated water flowed from the desalinated water storage tanks to the steam condensate tanks in the steam generation unit.
The entire steam and condensate system was contaminated with seawater and after 6 hours, the chloride ion concentration in the BW (continuous blowdown) reached 110 ppm (which was previously 1 ppm) and the pH of the BW dropped sharply for more than 3 units. A series of measures were taken to modify and recover the boiler chemistry as soon as possible. The utility engineering department had decided to increase the phosphate in the boiler to eliminate the acidic effect caused by the presence of chloride ions. Increasing phosphate feeding and concomitant applying of NaOH to raise the pH of the system caused the phosphate concentration in the boiler to become unbalanced. This method was incorrect for recovery of the boiler chemistry (as a single and complementary action) and in the first inspection of one of the boilers, it was found that the inside of the boiler was of underdeposit corrosion type due to the heavy deposition of phosphate‐salt compounds (Figure 5.22).

Figure 5.20 Seawater intake facilities and gas plant's utilities, chemical feed and quality control points.
Figure 5.21 Seawater desalination package, its quality control logic and dumping arrangement.
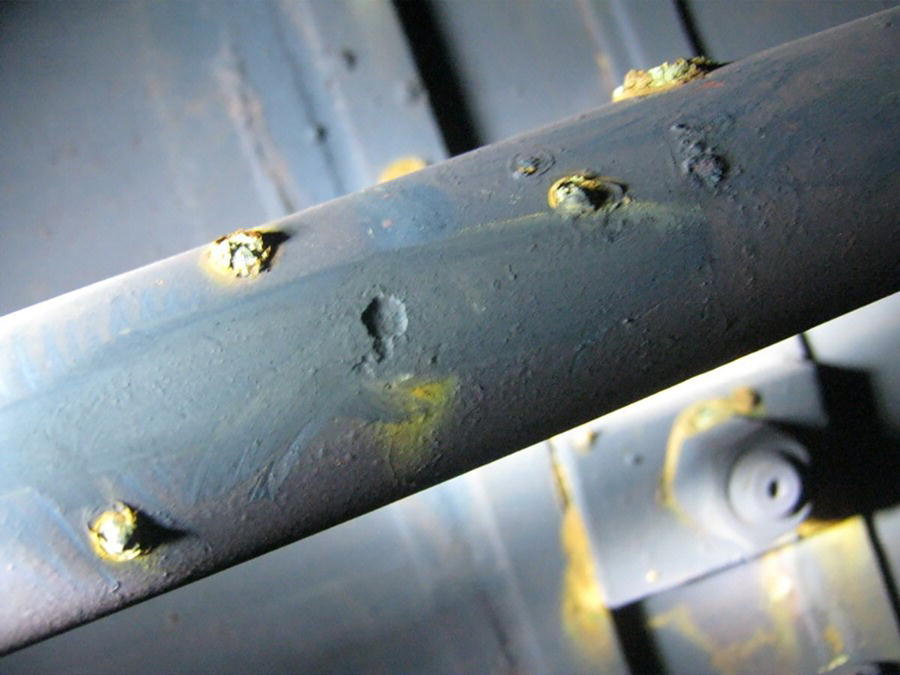
Figure 5.22 Underdeposit corrosion in a water tube utility boiler.
Considering that it was necessary to maintain steam production and there was no opportunity to empty and clean the tanks, it would have been better if the utility engineering department had performed the following actions to prevent further damage to the boilers and other equipment (Figure 5.23 presents all details and decision opportunities):
- Immediate truncation of MU water flow from desalinated water tanks and direct receipt of desalinated water from desalination packages (means distribution system).
- Increasing the neutralizing amine feeding into the condensate network as well as BFW (after deaerator).
- Increasing the continuous blowdown flowrate.
- Reducing the production of each boiler (means: heat load) and compensating the total demand of production by putting spare boilers into service.
Figure 5.23 Seawater desalination, desalinated water distribution, steam generation, and condensate purification‐deoiling system.
The incident lasted four days and the boiler chemistry was inadequately controlled during this time. One of the main reasons for the prolongation of the boiler chemistry recovering was that the utility process engineer did not monitor the return condensate with a flowrate of 1300 tons per hour, and the condensate returned to the steam condensate storage tanks with a pH of 6.5. The delay in detecting the contamination of the desalinated water storage tanks also caused the contaminated water in these tanks to enter the steam condensate storage tanks for two days, and the chloride ion to enter the steam generating system.
5.5.6.4.3 Industrial Case Six: Corrosion in Desalinated Water Distribution Pipelines Due to Remineralization Problems
The service water and drinking water of a gas plant were supplied by two seawater desalination packages. This water was aggressive due to the lack of salts, and imposed significant corrosion on the water main components, which were made of galvanized steel. The desalinated water entered the drinking water/utility water production unit, where the salts needed to adjust the LSI and AI, and CCPP parameters were fed into the desalinated water stream [9, 18, 19, 30].
In order to eliminate the aggressiveness of this water, two chemicals, calcium chloride and sodium bicarbonate, were fed into the desalinated water stream. These two chemicals were purchased as salt and were fed into drinking water and utility water at the processing site and solved in water at the processing site as prepared solutions. There was also a sodium hypochlorite feed point in the drinking water main that disinfected the water entering the drinking water main and prevented the growth of biofilm in the distribution.
Due to the ineffective management of calcium chloride and sodium bicarbonate, a set of interruptions in the feeding of the solution of these two salts into both drinking and utility water was created. The turbidity of the water and the concentration of iron in it both increased. Chlorine demand in the water main also tripled, indicating the presence of free metal ions and biofilm in the system. Many leaks were observed in the drinking water transferring pipes and inspections confirmed the presence of corrosion on the inner surface of the pipes. Figure 5.24 shows a corroded metal pipe of transferring line in desalinated water distribution system.
Further studies showed that (i) supply of poor‐quality chemicals and (ii) inadequate monitoring of chemicals along with (iii) delays in the purchase of chemicals were the three major factors in causing these corrosions. Site evidences showed that in one sample the calcium feed package was completely out of service for more than two years. Additionally, the laboratory did not routinely analyze the chemical parameters required to calculate the water stability indices. Figure 5.25 represents the daily monitoring of the LSI and AI parameter in drinking water. The drinking water production plant that was considered in this industrial case was named as plant A in the figure.

Figure 5.24 A corroded metal pipe in desalinated water distribution system.
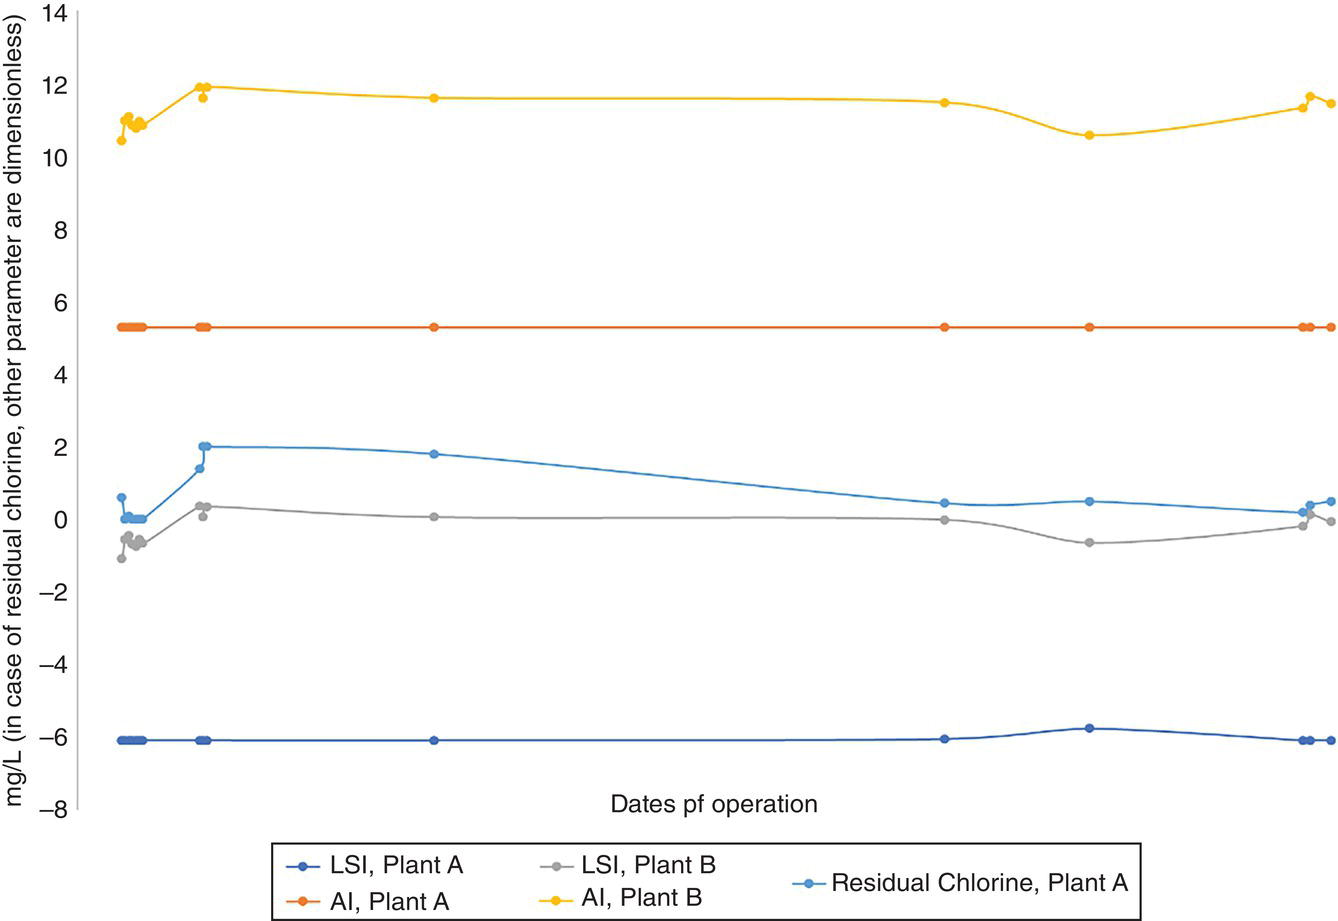
Figure 5.25 Daily monitoring of LSI, AI, and residual chlorine in two identical drinking water plants.
As can be seen in Figure 5.25, very inappropriate LSI and AI values were controlled due to improper feeding of chemicals into drinking water in plant A. The values of residual chlorine are also shown in this figure, indicating that there was no effective management of sodium hypochlorite feeding. Fluctuations in residual chlorine levels and improper control range in the drinking water distribution network lead to biofilm formation, and ultimately MIC. It is important to create suitable conditions for MIC in the event of improper control of stability parameters and electrochemical corrosion [18].
5.5.6.5 Operation History 3
The LSI and AI parameters for another drinking water production plant (B) that had a better situation regarding chemical feeding were given in Figure 5.25. At this plant, the quality control status of the chemicals, upon delivery from the warehouse, as well as the solution preparing were both correct. However, the treatment was not satisfactory because the dose of chemicals fed into the desalinated water stream (feed of drinking water plant) did not match the feed pump calibration diagrams.
The measurement of the parameters required to calculate the stability indices and residual chlorine was performed by the same laboratory. As can be seen, there is an unacceptable time interval between the reported values, as this is while the analysis regime was requested once in each shift. However, the laboratory has changed the analysis regime based on the number of its staff in different work shifts and as a result its ability for covering analyses of other sections of the utility plant.
5.5.6.6 Operation History 4
The drinking water main at a utility plant had a landslide fracture. Water consumption was increased to nine times the design case, and it became impossible to feed salt into desalinated water and reach the appropriate values for the stability indices, because the feeding capacity of calcium chloride and sodium bicarbonate salts was not proportional to the amount of desalinated water flowrate. Therefore, the process engineers who was responsible for drinking water quality control had increased the salts concentration in the dosing tanks to four times to achieve the appropriate LSI, and had simultaneously used the maximum feeding capacity of the pumps.
After some time, the feeding of both salts stopped completely. Increasing the feeding rate of the salts solution to achieve more appropriate stability indices was a roadmap for managing change in the system, but ultimately led to a complete halt of the feeding, and thus worsened conditions. The chemical feed nozzles of both salts were opened and complete clogging was observed. Figure 5.26 shows a calcium chloride feeding nozzle within a drinking water pipeline.
Studies have shown that the passing of the salt solutions concentrations from the saturation point and the presence of IM in the salts (too much) caused the feeding nozzles to clog and eventually stop completely. Leak eliminating lasted for two months and during this period the high flowrate of desalinated water entering the drinking water distribution system, and frequent clogging of the salt solution feeding nozzles caused the drinking water in the distribution system to have unfavorable conditions in terms of controlling stability indices and it resulted in corrosion.
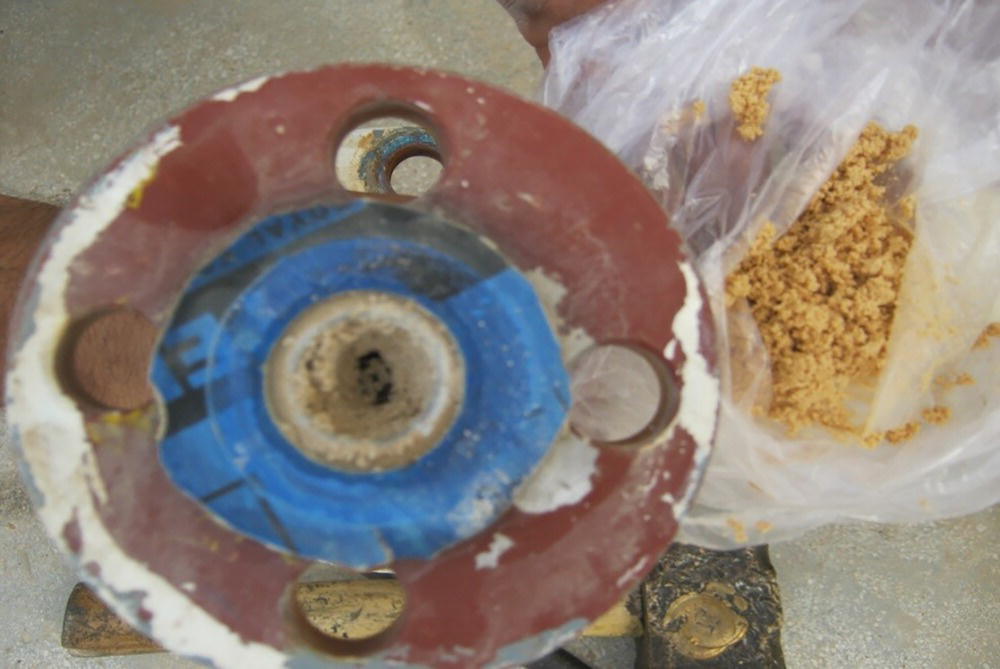
Figure 5.26 A completely clogged nozzle of calcium chloride feed prior to drinking water distribution.
Therefore, it can be concluded that the intended roadmap failed to manage the change caused by the temporary increase in flowrate. Permanent or temporary changes in the operational parameters of a processing site should be accompanied by the selection of a roadmap for managing changes in chemical feeding. This roadmap must be chosen in such a way that it has the appropriate effectiveness, for example, in this operation history, if a pump with a higher feeding capacity was used temporarily (so that there is no need to increase the concentration of the salt solution), then chemistry control to achieve stability indices was successful.
5.6 Misleading Trends with Corrosion Conclusions
It should be noted that similar trends do not always indicate the occurrence of corrosion or the creation of suitable conditions for its occurrence. The following are five industrial cases of such perceptions.
5.6.1 Phosphate Solution Preparation (Boiler Internal Treatment)
The communication structure of the departments in a gas plant was such that the points related to chemistry control were sent as a set of instructions or guidelines from the utility process engineer to the field operator of the steam generation unit. These instructions included preparation of different chemicals and adjusting the feeding rate (using the variable speed and stroke of the feeding pumps). Laboratory results over a week showed that orthophosphate began to rise and then returned to normal range.
Such results usually indicate the entry of acid into the system (and corrosion), which may have different causes. Examination of other parameters such as alkalinity and pH, in addition to residual orthophosphate, showed that these laboratory results were the result of an error made by the field operator of the steam‐generating unit who incorrectly prepared phosphate solution in the dosing tank. Chemical charging was done five additional times and, the shift supervisor (after three 12‐hour shifts) had noticed this mistake when reviewing the solution preparation logs. In order to reduce the effect of excess phosphate in the boiler, he had to open the continuous blowdown valve (which resulted in reduced specific conductivity), and when he saw this was useless, he decided to reduce the phosphate‐feeding pump stroke.
In addition, preparation of phosphate solution and subsequent actions should have been improved by training of personnel; however, it should be noted that the first sign of a change in chemical balance (here orthophosphate and pH) should not always be considered as the starting point for conclusion to corrosion. Figure 5.27 represents trend behavior of some quality parameters in boiler D (forth boiler).
In this graph, the increase in pH is not clearly known, and is represented more appropriately in Figure 5.28. There were six water tube boilers in the steam‐generating unit, and internal treatment of all these boilers was done by a common phosphate‐feeding package. This error in solution preparation caused the laboratory results of five operating boilers in the same way (one of boilers was in standby mode).
As it turns out, preparing the incorrect chemical solution caused the pH to first fluctuate, and then to stabilize at an inappropriate range. Initially a misjudgment could lead to the conclusion that the increase in orthophosphate concentration in the continuous blowdown line could be the result of acid ingress and, therefore could have caused corrosion in the return steam condensate system, BFW system, and boilers. As shown in Figure 5.28, the incorrect steps taken to return the chemistry control conditions to normal brought the boiler condition closer to corrosion [12, 23, 25, 30].
The data trend which is presented in Figure 5.29 comes from the transmitted results of an online specific conductivity analyzer on a continuous blowdown line of one of the operating boilers (boiler D). This trend represents three important times in which actions have been taken.
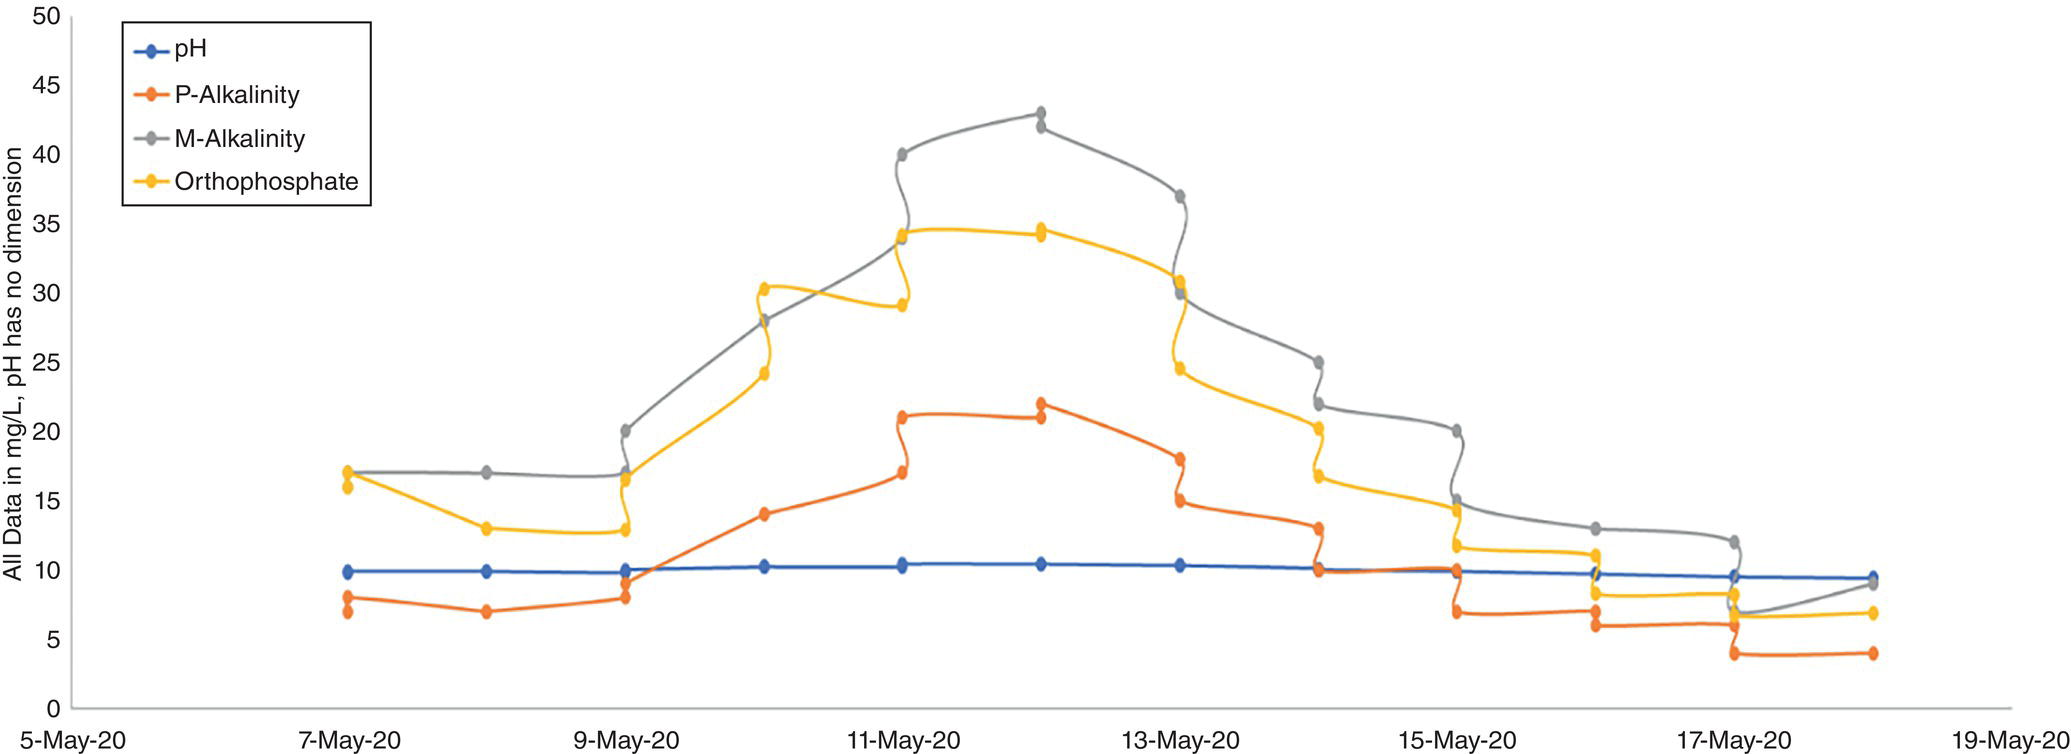
Figure 5.27 Laboratory results for boiler D in steam‐generating unit.
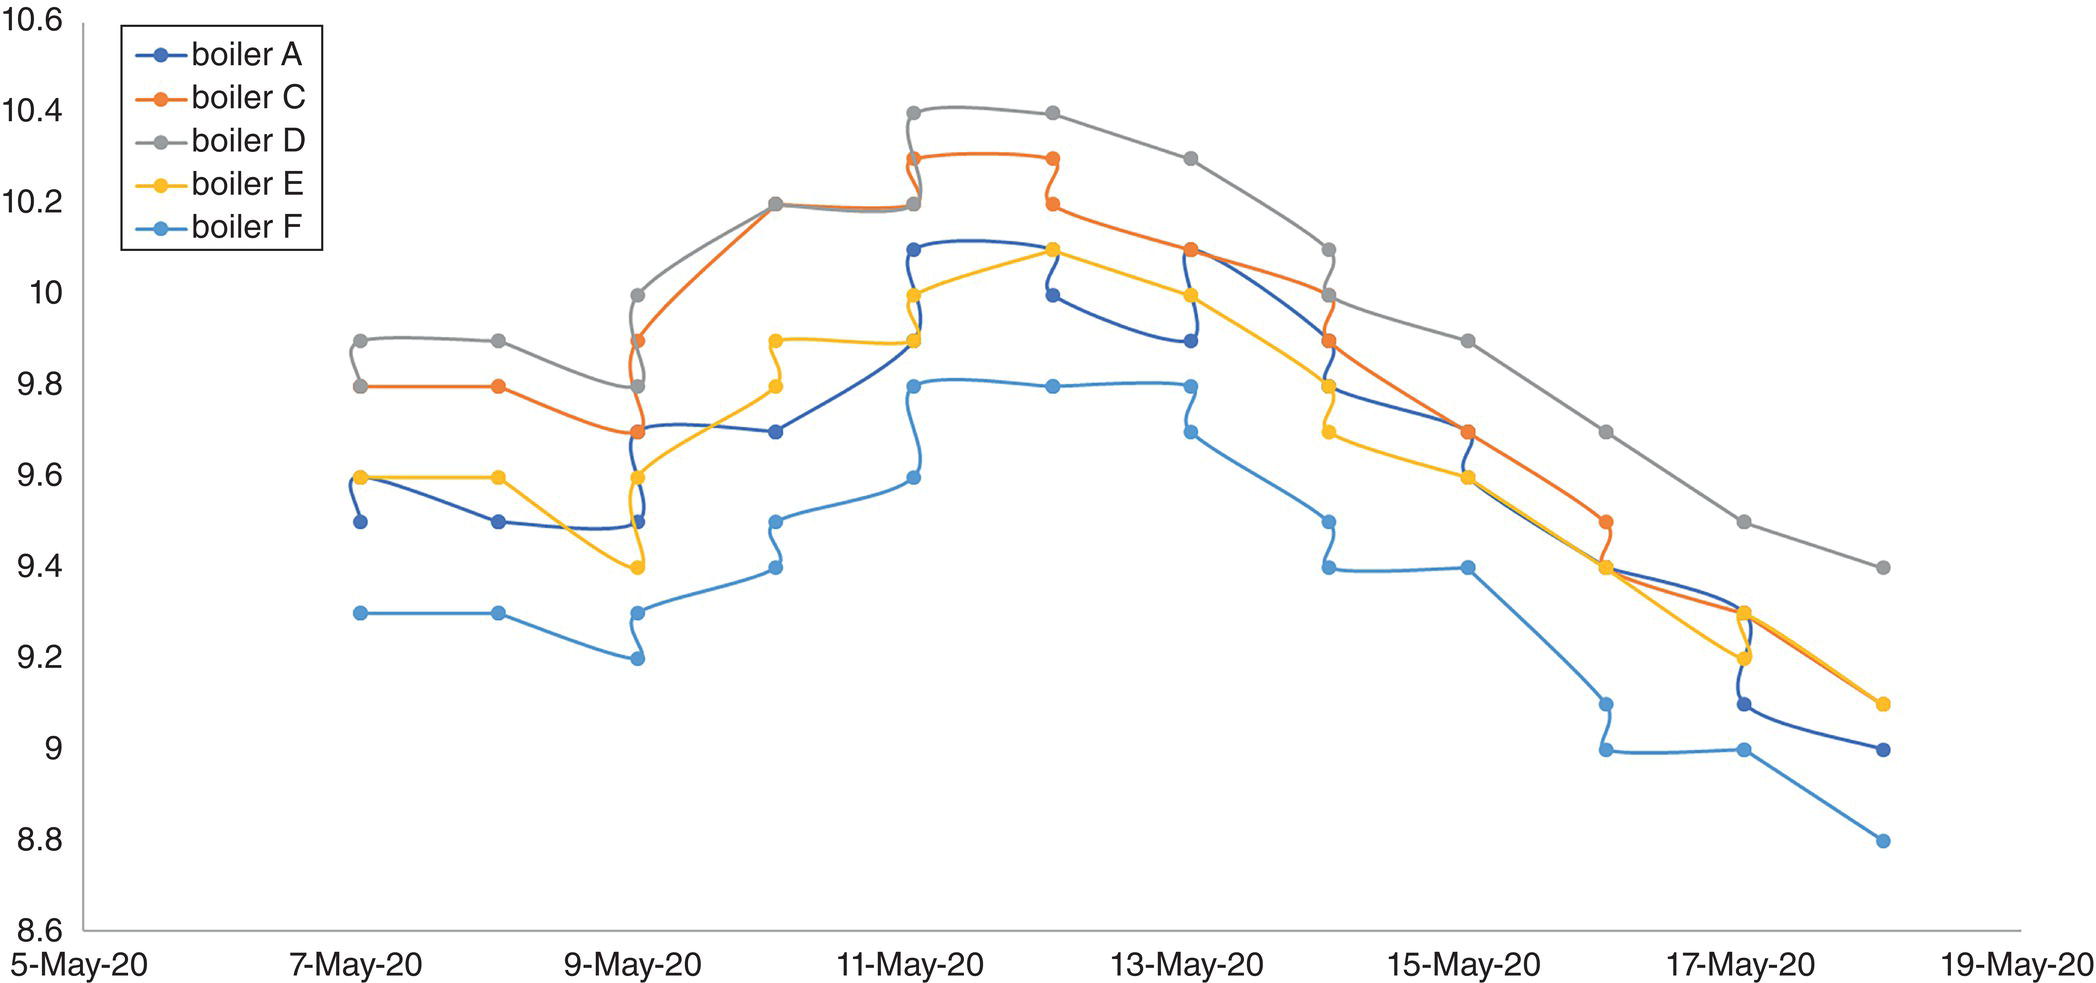
Figure 5.28 Trends of pH in five operating boilers.
Figure 5.29 Specific conductivity trend for BW in boiler D.
5.6.2 Putting A Kettle‐type Reboiler into Service that Has Been Under Maintenance
The return steam condensate in a steam‐generating unit had high iron concentrations during three 12‐hour shifts. The utility process engineer found the laboratory results to be correct after requesting re‐sampling and re‐analyzing of iron ions and total iron. Therefore, he examined the following influencing parameters:
- proper operation of deaerators;
- nitrogen blanket of steam condensate storage tanks;
- nitrogen pressure of the return condensate system in its production sections at the processing site;
- feeding of sufficient neutralizing amine and proper pH;
- sufficient feeding of volatile oxygen scavenger to prevent oxygen corrosion in the steam condensate system;
- steam condensate outlet temperature of all condensers inside the processing sections of gas plant.
The results showed that all these parameters were in acceptable condition and the investigation of operation logs did not show any change in their trends. Simultaneously, all laboratory results related to the return steam condensate from 23 points of the processing site were studied. It was found that from five 12‐hour shifts before (60 hours), until the iron concentration in the main header of the return steam condensate increased (when the utility process engineer noticed), the steam condensate output from a reboiler in the NGL extraction unit had a high concentration of iron and the operation supervisor of NGL extraction unit did not pay attention to this increase.
Upon further investigation, it was determined that six shifts before (72 hours), one reboiler had been re‐installed in the area where the high iron concentration was detected. Several steam tubes in this kettle‐type reboiler were damaged, which was serviced to a de‐ethanizer column. It took three days to repair and re‐service the reboiler; this was while the steam and its condensate paths were properly blocked and pressurized with nitrogen. The return steam condensate system was also kept under nitrogen pressure. After servicing, the iron was introduced to the steam condensate collection system.
According to the operation instructions, the field operator had to open the condensate discharge route to the WWTP to return the steam condensate special conductivity (which is the main indicative parameter of steam condensate contamination) and other parameters to normal BFW specifications. Unfortunately, this action was forgotten and the metal contamination caused by opening and closing the tube bundle, shell, and channel head, as well as the stagnation of steam condensate collection system in that section for three days, had found its way back to the main steam condensate header.
Under such circumstances, simply paying attention to the rising iron concentration in BFW could lead the process engineer to the conclusion that an active corrosion was occurring in the system. While only the entry of a contamination from upstream had led to this event, it should be noted that the entry of contaminants into the boiler cycle can cause precipitation, and in severe cases, can cause some types of corrosion over time [12, 18, 19, 23]. The steam condensate coming out of this reboiler was collected in the route of the suspect steam condensate, because the steam pressure used in reboiler was 26 bar lower than the pressure of the process fluid (ethane, propane, and butane rich gas). The steam‐generating unit was designed in such a way that there was no CPP (several trains of ACF‐IOX) in the return suspect condensate route, and only one deoiling system (two trains of ACF) was designed and installed.
5.6.3 Problems in Sampling from Deaerator and Oxygen Scavenger Analyzation
The steam‐generating unit of a gas plant had two deaerators that were in service in parallel arrangement. Oxygen and other non‐condensable gases were removed from the mixture of MU water and returned condensate by stripping steam (deaeration). An oxygen scavenger with the predominant formula, Diethylhydroxylamine, DEHA (chemical elimination mechanism) was used to ensure complete removal of oxygen up to 7 ppb (boilers were operating at pressure of 42 bar) [18, 19, 25] and to increase the efficiency of oxygen separation by steam (physical elimination mechanism). The oxygen scavenger feeding point was deaerated water in the steam condensate‐accumulating drum.
Over a period of several months, the inlet steam condensate flow to the two deaerators fluctuated and differed. The two deaerators were installed perfectly symmetrical with respect to the steam, return steam condensate, and MU water lines. However, a problem in controlling the level of one of the deaerators caused the feed to be about 35% less than the other deaerator.
Inadequate monitoring of process parameters resulted in the same feeding rate being selected for oxygen scavenger of both deaerators. Therefore, the DO in the BFW outlet of the deaerators with water flow had more fluctuations and reached 15 ppb in most cases (about 115% increase). Therefore, by studying the condition of the system and the change in the rate of oxygen scavenger feeding into the deaerator that had a higher inlet flow, the problem of DO fluctuation was completely eliminated. This was done by an independent feeding pump.
However, just measuring the DO is sufficient to ensure the absence of oxygen corrosion in the operating conditions of the steam generating unit (water tube boilers with an operating pressure of 42 bar); the oxygen scavenger supplier had recommended the maintaining of a residual of DEHA in range 150–200 ppb in BFW, and monitoring of this parameter was part of the performance guarantee of the oxygen scavenger chemical.
Six months after the control problem for receiving the specified flowrate of MU and returned steam condensate was resolved and the inlet flowrate to both deaerators was equalized, the oxygen scavenger residual fluctuated sharply over a two‐week period. While the rate of oxygen scavenger feeding to both deaerators was 4.2 L per hour, the DEHA residual in one deaerator was four times lower than the other. At the same time, the concentration of DO in the BFW output from the same deaerator was reported to be about 10 ppb, and the operation team feared an increase in possible oxygen corrosion.
After several studies, it was shown that the laboratory sent its Orbisphere continuous oxygen meter out of the gas plant for periodical calibration and instead used colorimeters, which can cause errors. It was also found that the lab department had lost the portable residual DEHA measuring device two months before, and the sample was transferred to the laboratory at 30 °C (more than 3‐km distance) and analyzed after one hour. This was not enough to cause the result of one of the deaerators to deviate, because this method was same for both; hence, the investigations continued.
Technical studies and subsequent analyses all showed that both the DO in the BFW and the DEHA residue were appropriate from the outset. However, in this sample, all signs indicated the onset of oxygen corrosion conditions in the system.
Since the reactivity of the oxygen scavenger to air was very high, attention was paid to the lack of sealing of the sampling lines. It was found that the deaerator sampling lines, which had less DEHA residual in analyses, had leakage which returned to normal after sealing and tightening the related connections; the piping of these sampling lines was an unusually long design. Further investigation showed that the cooling water valve in the same deaerator sampling cooler also had problems and, due to the impossibility of temperature regulation, the sample man often collected the sample at a temperature of more than 50 °C instead of 25 °C [44, 45].
5.6.4 Problems in Sampling and Analyzing Specific Conductivity from Demineralized Water
A water treatment plant met the needs of the steam‐generating unit for MU water. In the pre‐treatment unit, the technology used to treat water was IOX. In this unit, two mixed beds, each with a capacity of 100 m3/h, were designed and installed. These resin beds were of strong cation and anion type and could operate in series or in parallel arrangement. The design specification of product quality, demineralized water, was the specific conductivity and less than 0.2 μS/cm.
To monitor the demineralized water quality produced in this unit, an online analyzer was installed in the output stream route of this unit and sent a specific conductivity to DCS every three seconds. According to the maintenance department policy, an analysis was performed by the laboratory as a cross‐check for each analyzer within the utility processing site.
Because the analyzer had failed three times in the past year, quality controllers at the water treatment plant had more confidence in the lab results. Hence, when the result of the analysis of 0.4 μS/cm was reported, (and the many times rinsing and regeneration of the resins did not change this result), they were sure that the resins had reached the end of their life and that a series of initial and then detailed tests or a unit performance test should be run [22, 23, 31].
It was soon discovered that the laboratory had not used a degassing device to measure specific conductivity, which was an important practice [31]. This was while the existing online analyzer sensor had a degassing probe. It was also found that the temperature corrections used in the online analyzer were not the same as the laboratory portable device, and that the change in speed at the inlet of the degassing probe and its inadequate ventilation due to the short length of the siphon tube connected to the probe caused the values to transmit higher than expected. In this case, it was thought that the quality of demineralized water (MU water to the steam generation unit) would definitely cause precipitate in the boilers along with corrosion by deposition of hardness ions in the downcomer tube bank, and damage by overheating [18, 19, 23]. However, studies had shown that water quality is quite good from the start, and the trends reported by the lab, as well as the online analyzer, had been misleading.
5.6.5 An Improper Sample Point and Mistake in Determining Free Residual Chlorine
A utility processing site produced the industrial water it needed by desalinating seawater with MED–TVC technology. The water entering the processing site was chlorinated and filtered seawater. Because residual free residual chlorine could damage desalination equipment (stainless steel and copper alloys), free residual chlorine was first removed with sodium metabisulfite to the lowest possible level (0.15 ppm per design specification). While a safe dose was intended for the dechlorination agent, obsessive thinking that resulted from successive incorrect solution preparation (bisulfite dilution) over a period of time allowed the free residual chlorine remaining after dechlorination to be measured. The utility process engineer named this point “after bisulfite feeding.”
It is quite obvious to what extent this non‐standard sampling point affects energy consumption and the environment, as well as the overall efficiency of the process. Because it was installed at the end of the seawater supply header, it must be a continuous drain. Because electricity had been used to transfer water from the SWI to the gas plant operation zone, some of this energy had been wasted through this sampling point. The total efficiency of the unit (but not each of the desalination packages) was defined in terms of total seawater pumped and total desalinated water produced, and because seawater was discharged continuously from three similar sampling points (each package = one sampling point), a significant portion the chlorinated seawater returned to the sea (waste of energy and more GHG emission).
A non‐standard sampling point was provided for this purpose. There was a drainage‐piping element in the desalinated seawater piping at the desalination unit. The utility process engineer, regardless of the piping arrangement and based on trust in the proper functioning of the isolation valve and the existing check valve, selected it as a sampling point and placed sampling and determination of residual free residual chlorine in the list of routine laboratory analyses. Figure 5.30 clearly shows the arrangement within this unit.
The result of laboratory analyses showed that the free residual chlorine in this pipeline was between 0.3 and 0.8 ppm. The vendor of the seawater desalination package, meanwhile, set the maximum working concentration in seawater feed equipment at 0.15 ppm. Therefore, it was concluded that free residual chlorine had entered the packages and corrosion conditions had been provided. The laboratory results for determining the sodium bisulfite concentration in the dosing tank, as well as the rate of its feeding into the inlet seawater stream, were immediately reviewed and fortunately everything was good.
Subsequent investigations showed that the isolation valves (two gate valves) were leaking and chlorinated water had entered the header. Due to the location of that point at the end of the header, and in addition to the stagnation of water, selecting that point for sampling and determining the dechlorination efficiency could not provide a representative sample to the process engineer. Therefore, an incorrect determination of the sampling location, as well as the application of unnecessary analysis, and due to covering, the sensitivity of proper sodium bisulfite solution preparation had caused the system to be considered subject to corrosion due to more free residual chlorine than design specifications.
Figure 5.30 Seawater desalination unit, its related sample points, and chemistry control scheme.
5.7 Chemicals, Their Corrosion, and Impacts of Their Corrosions on the Environment
Based on the experiences of presence at different gas plants and their utilities, the impact of chemical consumption on the environment is classified into four separate categories. This classification is given in Figure 5.31, which classifies the environmental impacts of chemical consumption within this chapter of the book.
In this section an operation history is presented where improper use of the chemical caused corrosion, the corrosion then caused one or more of the environmental impacts created.

Figure 5.31 Classification the impacts of chemical corrosions and impacts of their corrosions on the environment.
5.7.1 Operation History 5
A sour water header of a gas plant was inhibited from corrosion by a film‐type CI. This inhibitor has a specific emulsifying property that, in the event of overdose and/or improper control of the residual at downstream, prevented the hydrocarbon (organic phase) and the aqueous phase from separating in feed‐flash drums.
As stated in operation history 23 (Section 5.10.1.5), the increase in the CI dose to the sour water transferring pipeline eventually caused severe localized corrosion in the reboiler of the two sour water stripping columns, and the two trains of stripping were taken out of service. The design had an open steam arrangement that could be continued if the reboilers were not ready. Open steam is a type of generating vapor phase in the fractionating column (here stripping) [46]. Therefore, open steam arrangement was used for six months until two tube bundles were prepared for each of the reboilers.
The use of steam caused the steam to return to the condensate system and the utility plant was forced to supply 23 tons of demineralized water per hour as MU water to the steam generation unit. Open steam also increased the volume of raising vapor phase in the condenser. To condense this high volume of vapor (mainly water) more air fans were put into service in the column condenser (in an air‐cooled condenser there are two or more air fans that control the rate of heat exchanging). Obviously, they experienced higher electricity consumption due to the service of more motors for air fans, which caused higher GHG emissions.
Consuming more MU water meant consuming more energy, more chemicals, and more person power, along with more quality control acts, all of which led to more GHG (see Section 5.4). Also see Industrial Case Two in Section 5.5.6.2 (Increase MU water flowrate) for study about impacts of MU water on corrosion, energy, and environment.
5.8 Configuring EMPA
In this section, management is defined as the complete knowledge of the work components (different activities) in a system and their proper performance to achieve maximum benefit. Here, the maximum profit is the result of the following conditions:
- minimum costs for chemical procurement;
- minimum costs of delivery and storage;
- minimum consumption in different points of a processing plant;
- minimum direct and indirect impacts on the environment; and
- preparing consumption reports based on facts and operation feedbacks from different points of view, and modifying decision‐making processes.
Figure 5.11 represents these different aspects of which corrosion is an integral part in the present chapter. It is important that all of these conditions and related activities are within the framework of one cycle.
A model or framework of EMPA in the utility processing sites of the natural gas processing industries is to include all activities related to working with chemicals in this field (this framework can be generalized for either processing zones of gas processing or the oil and petrochemical industries). Different activities can be identified for this purpose. Each of these activities represents a specific stage of this management or framework. Inside each, a set of consecutive jobs is performed, and joining this chain will provide a suitable framework for managing different activities.
The activities of this model are, in fact, the stages that can be performed sequentially with chemicals, these are selection, procurement, delivery, storage, consumption, and reporting. Like any engineering system or any type of management system to implement a model, documentation will be an integral part of this “effective management.” These stages are a separate and general set of steps. Several factors such as the volume of chemical request, the type of chemicals used, number of chemicals, and the geographical location of a certain industry (usually processing site) can cause a number of these both stages and steps to merge or overlap.
In a gas plant, like any other process industry, all the quality control parameters are on the threshold of change. Suffice it to say the temperature of the reflux of a distillation column, the opening percentage of a Joule–Thomson valve, or the flowrate of the inlet steam to the reboiler of a cryogenic column will change slightly. As a result, field process engineers have to wait for the quality of product(s), the quantity of production, or both to be affected. Of course, more comprehensively, other events such as excessive energy consumption, and increased workload of personpower must be expected, which are usually the next priority for a gas plant because of its commitment to production and, after that, export.
If we consider a modern gas plant that is built as an unmanned type, then in three examples given above, the control systems consisting of logics and other components in the control algorithm (sensors, transmitters, actuators, valves, calculators, controllers, etc.) determine the deviation(s) in a certain process. This deviation is due to an error in the control system, a malfunction of its components (such as valves or sensors), or is a response to fluctuations in the system that must be found at the initiating point.
There are obvious differences in chemical consumption with a process control action. Most of the activities in this section are based on human jobs. Clearly, stages such as selection, procurement, delivery, storage, consumption, and reporting are completely human‐based, and a set of organizational guidelines and/or engineering procedures are used to perform them. However, the consumption activity of the processing site may have two different approaches; (i) chemical feeding based on manual calculations and issuing guidelines for preparation of solutions and feeding, along with quality control with predicted physical–chemical lab experiments (or online analyzers), or (ii) chemical feeding based on pre‐designed control algorithms. In the rest of this chapter (Section 5.10.1.5), more information about consumption details is provided on the processing site.
The above paragraphs clearly show that documentation is a serious need when working with chemicals. Like the digital control systems and histogram features embedded in the DCS, here in most cases, there is no such thing as a histogram (or other type of automatic record‐keeping systems). As a result, when you need to refer to DCS records in terms of chemical feedings, only a few limited numbers of all the required information will be available, such as results from analyzers (if they are calibrated and transmit values properly) or numbers recorded from flowmeters. Some processing sites have features such as metering pumps that record the fed flowrate of the prepared solution or neat liquid chemicals [47]. Of course, the numbers recorded by them without regular and effective periodic calibration do not have any technical value for chemicals impacts on processing sites.
Therefore, in order to control all jobs in each activity of this framework, all steps must be effectively documented. Documentation will provide an opportunity to return to the system's histories and evaluate alternative routes, as well as to predict the operating conditions of areas affected by chemical feedings and to be aware of possible corrosion. Documentation is also a powerful tool for analyzing the root causes of process deviations that may have been affected by chemical feeding. Figure 5.32 represents the sequence of these activities in the context of a working model or frame.
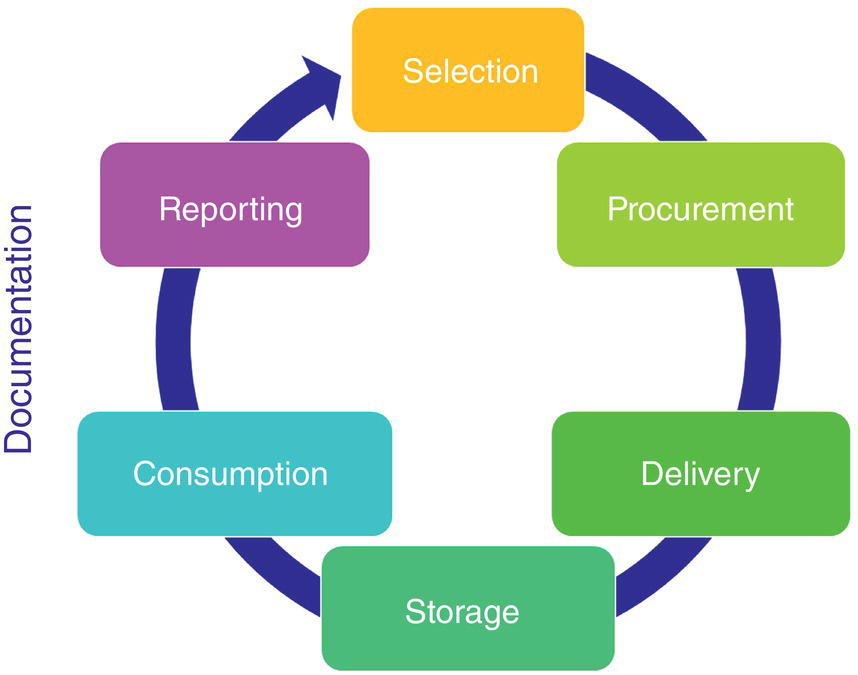
Figure 5.32 A framework for EMPA.
5.9 Setting up an EMPA
Setting up an EMPA can be easily accomplished by following these steps:
- provide a clear definition for each of the activities listed in Figure 5.32 (that is detailed in Section 5.9.1);
- collect field information to match the knowledge associated with each process additive in these defined activities; and
- define a specific job sequence for each activity and then follow it to achieve effective management.
The number of chemicals used in a processing site are limited, hence, the following are expected.
- The knowledge related to the chemicals is quite limited, and it is possible to get a good knowledge of these process additives by spending time, using the experiences of industrial experts, and manufacturers/suppliers.
- The parameters that are affected within a processing site by the use of these chemicals are quite limited and specific, and it is possible to record and classify them in a short period of time. These parameters are unique to a specific processing site and should only be written based on the experiences of the field process engineers and/or field operators on the same site.
- The impacts of using chemicals can be achieved using scientific sources, experiences of industrial experts, and experiences of the same processing industries. If a processing site has a good structure for reporting the performances of its various departments, it can be expected that these impacts are easily identifiable and quantified, and then planned for improvement.
It is important to note that the use of data and experiences even from similar processing sites must be done with great care and rigor. There are many reasons why this should not be a priority decision for chemicals that are beyond the scope of this chapter.
Knowing the above information and the method of obtaining each, it is easy to set up an EMPA. As (i) chemicals, (ii) applications, (iii) affected process parameters, and (iv) the impacts of chemical consumption (subject of Figure 5.11) are well defined, they can be achieved by conducting various sensitivity analyses to the knowledge related to them. Management of change (MOC) complicates this implementation method slightly; the initial suggestion may be that MOC should not be incorporated into these procedures at first, and after an EMPA has demonstrated success and has been properly implemented into the system in a processing industry, we then define MOC and attach it to the current EMPA.
5.9.1 Description of Activities
Here, the various activities of the EMPA are described separately based on Figure 5.32. In order to better explain, this section describes one or more operation histories (limited in description) in each activity. Each of these operation histories includes other activities, but in the process of describing them, an attempt has been made to express the same activity more prominently.
5.9.1.1 Selection
Each unit operation in a processing plant has its own considerations, and to reach an optimal point in selecting a chemical, one must first consider these unique considerations. The most important consideration in choosing a chemical is the quality control that is gained by that chemical. A process additive must first meet the purpose required by the site process designer or field process engineer, then it will be time to evaluate its other features, and it is just as important to address its impacts on the production processes.
It should be noted that the selection of chemicals for a processing site is part of the site developer's commitment to detailed design (detailed design is one of subsections in plant's development contract). Therefore, the initial chemicals selected by the process designers in the project are delivered to the owner as one of the project documents and can be used for the normal operation of the site. This document can be used until the last day of a process industry under the following two conditions; (i) manufacturing/supplying chemicals can be performed with no difficulty, (ii) changes in site processes do not force the field process engineer to change the chemical. Therefore, it can be expected that in the hydrocarbon processing industries, the same basic document, called the “Chemical Selection” will last for the rest of plant life.
5.9.1.2 Operation History 6
An important distinction must be made between “substituting” a chemical with “replacing” it with another. For example, at a gas plant, a film‐forming CI was used to prevent corrosion of the sour water pipeline. Some process limitations as well as changes in the chemistry (quality) of generated sour water led the process engineering department to eventually decide to use a neutralizing amine instead of a film‐forming CI. In this case, an alternative was made (replacement) because the new chemical was not functionally similar to the previous one.
Figure 5.33 shows corrosion‐monitoring coupons after six months in sour water pipeline. As it turns out, when using the film‐forming CI, a number of pits are created by the localized corrosion. However, in the case of using a neutralizing amine, a uniform iron sulfide is seen on the surface of the coupon.
The author's experience showed that under normal operation of a processing site, the need to select a new chemical will only arise when it is not possible to procure a preselected chemical. This impossibility can be due to one of the following reasons; discontinuation of production of a chemical, increase in price, change in the formulation of a new product (from the same manufacturer), increase in process costs if that preselected chemical is used, impossibility of supply for some reason (such as the strategy of independency), or new environmental laws.
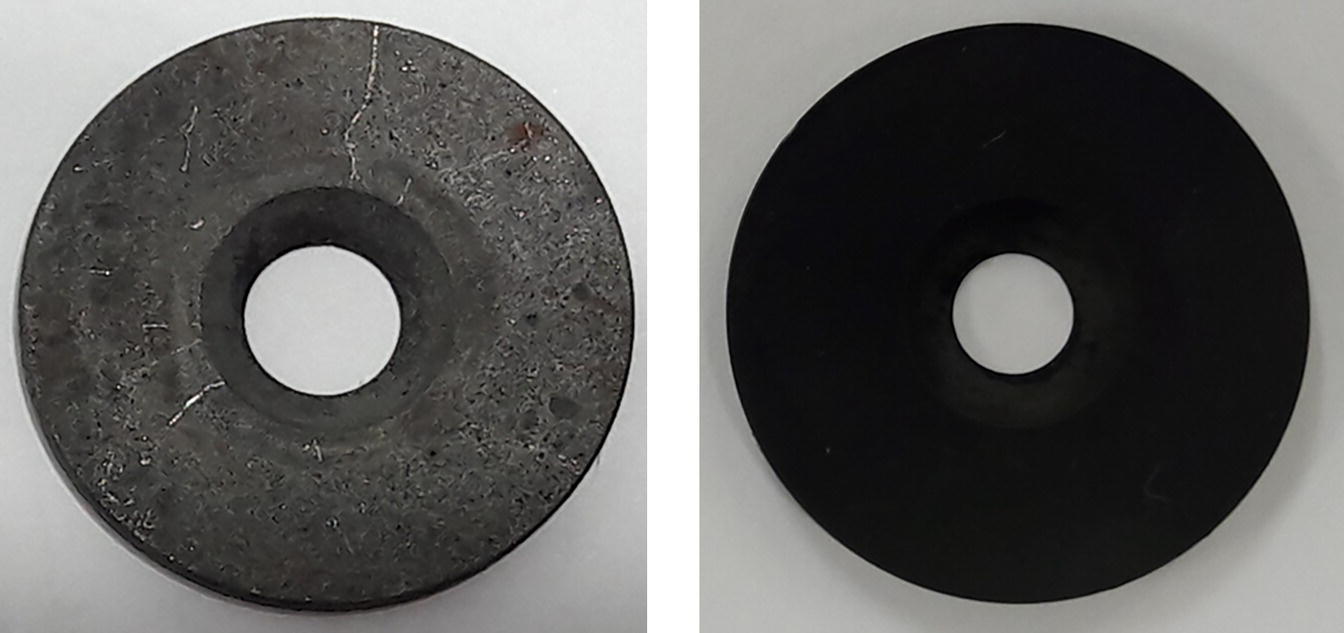
Figure 5.33 Two corrosion coupons in same location of a sour water transferring line. The left‐hand coupon represents the performance of film‐forming CI, and the right‐hand coupon represents the result of applying a neutralizer amine.
First, two basic questions need to be answered; Is the chemical mentioned in the chemical selection document already available? Will the current operational needs be met with the same chemical as mentioned in the chemical selection document? If the answer to both of these questions is yes, then there will be no activity called selection in EMPA, but if the answer to one or both of these two questions is no, this stage must be passed.
Here are the key points to consider when selecting a new chemical:
- cost;
- environmental regulations;
- ability to use storage and feeding equipment available on the processing site;
- access of technical knowledge to work with new chemicals;
- production of intermediate and final products of processes with the desired specifications in sale and export commitments, and basic design;
- possibility of chemical quality control (i) in the stage of delivery from the manufacturer/supplier and storage in the warehouse, and from warehouse to processing site, and (ii) possibility of quality control jobs after feeding into process streams;
- compliance with the governance policies of that processing industry in terms of the tendency to depend on non‐native manufacturers and related obstacles;
- paying attention to the geography of that industry and examining the possibility of storage with existing facilities, and way of transferring purchased chemicals to processing site.
5.9.1.3 Operation History 7
A gas plant had a firewater system with an approximate storage volume of 100 000 m3. The total length of the distribution lines in the gas plant's firewater main was more than 36 km, and there were many points where the water remained stagnant for weeks. There was a weekly instruction to return 10% of the firewater main volume to the storage tanks (in 30 minutes), in order to circulate stagnant firewater in the system and mix the chemicals properly throughout the network.
A biocide was selected for this gas plant to prevent biological growth as well as MIC (selection was done in a detailed engineering step of gas plant development). According to the biocide manufacturer's recommendation, the field operator should feed 100 ppm of the mentioned biocide into the tanks once a month and activate the water circulation mechanism for three hours.
According to the basic design, the MU water entering the firewater system was of the desalinated seawater type and did not pass the remineralization stage. Therefore, it did not have enough alkalinity to resist the acidity of biocide (which had a pH of 2.4) and the system suffered severe corrosion. This was while there was no package to regulate the pH on the utility processing site. Therefore, after the low pH (about 5.8), corrosion occurred in the firewater distribution system, so the feeding of biocide (means the source of acidity) was stopped. Figure 5.34 represents a standard corrosion coupon which was corroded by acidic mechanism (about 12% weight loss).
Ignoring biocide feeding caused biological growth in the system. Figure 5.35 represents a non‐metal base (made of wood) of corrosion coupon in a rack with a residence time of three months. Coupon base was in cylindrical shape and a biofilm was formed on its surface. However, it was not clear whether this biofilm formed on the base of the coupon could have caused MIC [39]. The present operation history represents how an error in choosing a chemical (here, a biocide) can lower quality control of fluid, advance the system into corrosion by acidic corrosion, and increase the potential of MIC.

Figure 5.34 A standard corrosion coupon in firewater system in low pH condition.

Figure 5.35 Biological growth on both sides of the cylinder (corrosion coupon base).
5.9.1.4 Operation History 8
A gas plant had a 43 000‐cubic‐meter firewater system. MU water to the system was desalinated seawater with a conductivity of less than 10 μS/cm and total dissolved solids (TDS) was negligible. The CI in the basic design was formulated based on silicate and phosphate [14, 19]. The corrosion coupons in the system are given in Figure 5.36.
Studies showed that this CI has not been compatible with water chemistry, and the pH required to form a barrier film to inhibit corrosion (~ 9) was not present in the firewater. Due to the unprepared CI feeding package (about three months), the firewater main was filled with aggressive water and there were large amounts of primary corrosion products and suspended iron in the system. Therefore, the modified CI was subjected to regulate pH, and the phosphate to polyphosphate ratio was adjusted to the appropriate value. After applying various changes in the system, the corrosion results reached an excellent level (0.03 mpy). Figure 5.37 shows a standard coupon in the firewater system which was inhibited by modified CI.
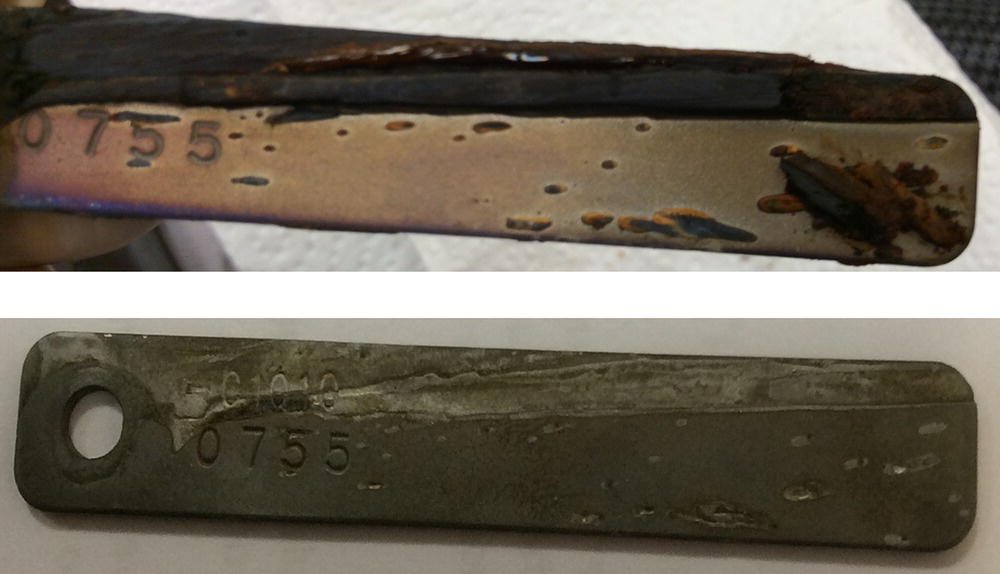
Figure 5.36 Corrosion monitoring coupon in the firewater system before and after cleaning.

Figure 5.37 Corrosion monitoring coupon in the firewater system. There were no precipitations and depositions on the metal coupon surface.
5.9.1.5 Operation History 9
An operation history of the selection of a new set of chemicals refers to the replacement of two reverse demulsifier and flotation agents. The design documents for a WWTP suggested two specific chemicals (produced by a well‐known company) to improve API separator and IGF performance (see Figure 5.12). Five years after the gas plant was commissioned, the possibility of supplying both chemicals was eliminated. In order to maintain the efficiency of equipment, these two chemicals were substituted. The result of this substitution was a significant benefit in terms of oil recovering capacity, as well as a reduction in application of utilities such as diluent water and electricity and a reduction in person power requirements of 50%. The total consumption of both chemicals decreased from 97 tons to 13 tons, yearly. It is clear that sometimes the impossibility of procuring a chemical will lead to the selection of a better one with fewer impacts on the unit operation (and in some cases on entire processing site).
During the substitution process (selection of a new set of chemicals), three things happened that could help clarify the discussion:
- A manufacturer was able to successfully pass the laboratory results and pilot test by obtaining a novel combination of polyelectrolytes, then the chemicals required to be used for one year in a WWTP were produced in a chemical plant. The chemical plant was located in the a cold region, and given that the WWTP had placed its order delivery time in February, these two chemicals had frozen due to cold travel conditions (about 1600 km distance) and changed their physical–chemical properties. Conversion to two phases along with some other problems made them difficult to use in WWTP. A large part of the shipment was returned to normal by a corrective action in the chemical plant, and it was decided that after the shipment, the chemical would be made in the same area where the WWTP was located and delivered to the gas plant warehouse.
Therefore, one of the points that should be considered in selecting new chemicals is the geographical location of chemical manufacturing sites. Sodium hypochlorite in particular falls into this category. Perhaps better conditions can be achieved by increasing the cost of chemical formulas and changing the way they are delivered; but the total operating cost of the processing site should also be considered.
- The reverse demulsifier chemical, when fed into the influent stream of API separator, clogs and blocks the feeding line into the oily water influent pipeline. The reason for this was the high strength, and consequently high kinetic of reaction of the alternative (substituted) chemical compared to the previous one. Therefore, studies have been performed to reduce the strength of the new reverse demulsifier and to use an alternative arrangement for feeding.
- After using the new arrangement and feeding a lower dose than the previous chemical, it was found that feeding pumps cannot feed values less than 10 ppm. Therefore, it was necessary to produce a low‐strength chemical (which was not possible in terms of stability) or to dilute it on‐site with fresh water. After two months of working on the formulation of this chemical, the manufacturer of the chemical delivered a sample with the ability to dilute it to the process department in WWTP. The interesting point was that in the imported type of this chemical, it was not possible to dilute with water, and if the contents of the dosing tank were not used up in three days, the entire solution would be converted to two phases and became unusable (because of humidity absorption from atmosphere). Therefore, making of a water‐soluble chemical with good stability for the manufacturer and the WWTP was considered a success.
Industrial Case Three represented well how an improper selection and overfeed of a reverse demulsifier chemical can cause excessive water received in the gas condensate stabilization unit and eventually corrosion in the distillation column.
5.9.1.6 Procurement
It should be noted that the chemicals used at the processing site impact on the entire operation (Figure 5.11). Therefore, when procuring, departments should pay enough attention to all the items that have the potential to increase the unwanted impacts of chemical consumption. Developing quality control conditions in the purchasing contract, selecting and introducing the quality control reference laboratory, and requesting the official publishing of the guaranteed quality control parameters are among the measures that must be taken into consideration when purchasing chemicals.
It is expected that some deficiencies will be felt in the initial purchases of chemicals, in which case a return to the sequence cycle of activities (Figure 5.32) is the only way to prevent further recurrence and losses. In other words, the procurement department must reflect the results of the activities cycle (EMPA) in its current and forthcoming purchasing contracts. The most important part of this work is to pay attention to the quality control feedback of intermediate (nonmarketable) and final products (marketable) in processing sites, as well as the impacts of corrosion rate and the environment on plant performance, which are all connected to the procuring of inappropriate chemicals.
When it comes to procuring chemicals, the quality of the chemicals procured is not always a fundamental issue. Sometimes the delivery time and the packaging or delivery method of chemicals are of equal importance, and in some cases even higher priority than the quality of the procured chemicals.
5.9.1.7 Operation History 10
Sodium hypochlorite, NaOCl, is a chemical used in the disinfection and control of the biological growth of seawater, treated effluent, and maintaining of biostatic conditions of raw industrial water produced in the utility units of a gas plant (Tables 5.3 and 5.4, and Figure 5.3) [48, 49]. Storage conditions at the processing site as well as being located more than 1000 km from the nearest sodium hypochlorite generation plant had caused the amount of free residual chlorine remaining in the process streams to be unsuitable, and due to the volatility and instability of this chemical over time, quality control for intermediate and final products of plant could not be done properly. One of the reasons for this was the purchase of sodium hypochlorite in 220‐L barrels, which, along with the small amount of chlorine solution preparing/dosing tanks, caused only 15l of a 220‐L barrel to be charged in each of the three NaOCl feeding packages and left another 175l in the barrel. This used barrel was not returned to the warehouse due to lack of logistics, and was kept in poor condition on the site. Analyses showed that the commercial percentage of NaOCl was stored in a barrel with the lid open for five days in inappropriate conditions inside the processing site, and the NaOCl decreased from 12% [29, 48, 50] to less than 1.5%.
Subsequent studies showed that despite the purchase of NaOCl from the chemical plant with a commercial percentage of 12% and payment based on this active percentage, the active percentage in the chemical at the time of delivery was a maximum of 7% (and sometimes 5%), indicating the method of transporting the chemical from the factory to the gas plant was unsuitable. Therefore, new clauses were added to the purchasing contract to prevent future events from happening. For example, one of the clauses was that in subsequent purchases, all shipments ordered in 40‐L barrels would be delivered to the gas plant, because the site could not dilute the concentrated chemical at delivery time based on guidelines.
5.9.1.8 Operation History 11
A gas plant consumed a reverse demulsifier to treat its oil‐contaminated effluents from hydrocarbon processing and off‐site units (Figure 5.12). It was a polyelectrolyte sent from a chemical plant at a distance of 1500 km. Because the need for this chemical depended heavily on on‐site operation conditions and the production of effluents from overhaul and surface flooding from monsoon rains, purchasing this chemical reduced its efficiency during storage as much as the annual requirement, and in some cases the penetration of moisture into the barrels (or dosing tanks) lead to the absorption of moisture and conversion into two phases of the chemical, which ultimately made it impossible to use.
The first decision to avoid reducing the quality of the chemical and thus increasing the corrosion rate (Industrial Case Three) was to always purchase fresh chemical using a partial shipment contract. Another alternative was to purchase the raw polymer material from the market and dissolve it in demineralized water (solution preparation) at the processing site. Studies have shown that purchasing dry polymer can impose more complexity on the EMPA and possibly not effectively increase the yield of oil removal. Partial shipment costs (like additional transportation jobs) over three years also forced the procurement department to notify the engineering department to reconsider the selection of chemical or oil contaminated effluent treatment process. Therefore, it can be expected that in Figure 5.32, in addition to a large cycle among the six major activities in EMPA, there is also a set of internal feedback among the sequential activities of this cycle.
5.9.1.9 Delivery
Delivery of incoming chemicals to a processing site (i.e. its warehouses) is of great importance. This activity can be implicitly included in the contract of purchasing from the manufacturer/supplier or defined as an independent activity in the EMPA cycle. It is recommended in industries where there are many different chemicals to define delivery as an independent activity. Sampling of all consignments received according to current standards, analysis of chemicals according to the provisions of the purchase contract, and obtaining analysis sheets from an internal laboratory (in plant) or external reference are the most important parts of the delivery process.
The work in this section lacks any flexibility and decision‐making based on the existing conditions. Any deviation in the implementation of written regulations on the steps of delivery of chemicals can lead to severe loss or failure to the processing site, production economy (includes corrosion), and the environment. The working algorithm in this activity is such that if the answer of a step (block) is negative, the flowchart is then stopped and referred to the purchase agreement clauses for how to return the chemicals back to the manufacturer/supplier.
Delivery issues can be due to human error or related to warehousing. It is important to note that achieving an ideal delivery is by no means possible unless the two activities of procurement and storage are done properly. So, (i) delivery of cargo during non‐working hours of delivery warehouses (after 16:00) as well as on holidays [47], and (ii) arbitrary charging of materials such as solvents in storage tanks, which are often done incorrectly, are two recurring human factors in the steps of delivering chemicals. In some cases, the driver has been seen filling the glycol tank without informing the chemical delivery operator, and due to non‐compliance with the site's current instructions for emptying the road tanker, once the atmosphere contacts the glycol, the glycol is partially degraded due to reaction with oxygen.
5.9.1.10 Operation History 12
A utility processing site had a centralized section for storing chemicals. Sulphuric acid is stored in a horizontal tank and piped to various units of the processing site. Ten road tankers entered the site almost every three months to fill this tank. A strainer and filter arrangement and a road tanker‐emptying pump sent the acid into a horizontal tank, and two sulphuric acid transfer pumps sent acid to three points at distances of 100, 500, and 1200 m at the processing site. After some time, the acid transfer became difficult and eventually stopped.
Investigations showed that the acid content of one of the 10 tankers was transferred during non‐working hours on holidays, and due to the requirement for a road tanker to enter the site during the workday with a traffic permit, the Utility Operation Department had to accept the acid tanker at 18:00. This clock coincides with the change of operational shift and there is minimal worker concentration at this time. The field operator connected the acid transfer hoses to the horizontal storage tank and put the road tanker‐emptying pump into service, but the acid was not transferred to the storage tank. When they checked the condition of the strainer they found that it was completely clogged and should be replaced or cleaned. Strainer replacement was postponed to 20:00 due to the operator leaving the area for handover of the operation logs (shift change), and the driver decided to deliver his cargo quickly; arbitrarily bypassing the strainer.
The acid transfer pipes were completely filled with a paste‐type material and the transfer was reduced to zero, disrupting the performance of all three sulphuric acid acceptor units. The main horizontal acid storage tank was opened, and more than 1 m of a paste‐type material was found inside. Laboratory analysis of this paste‐type material showed that 85% of it was composed of hydrocarbon organic matters. Subsequent correspondence with several other customers showed that the supplier had a history of contaminating several other systems, and did not properly follow the principles of cleaning its road tankers after each shipment was delivered.
Problems in the delivery of sulphuric acid to three consumers caused the acid acceptor systems (to which it was not possible to transfer the acid now) to malfunction, and the quality control to be such that the system itself or the downstream units would corrode, or increase the risk of corrosion in them. For example, one of these consumers (processing units) was a demineralization unit (see Section 5.5.6.1). The acid was used in this unit to regenerate strong cation resins. The demineralized water produced in this unit was used as MU water for the steam generation unit as well as the demineralized water required for washing the turbines blades. The impossibility of transferring acid to this unit made it difficult to regenerate the resins and ultimately caused the product to deviate from the expected quality. It is obvious how water with higher specific conductivity (or TDS) for a boiler with a certain pressure can be effective in creating precipitation, deposition, and corrosion damage [18, 19, 23].
5.9.1.11 Operation History 13
A utility processing site had written the allowable amount of IMs in calcium chloride required in the purchase contract and emailed it to the winner of the tender. The contract clearly stated that the representation of product analysis sheets is insufficient to determine IM and must be sampled at the time of delivery of the entire consignment. It was decided that the delivery of chemicals in the warehouse would be done by following the sampling instructions when receiving the shipment from the truck. The instructions have not been studied properly by the delivery operator and sampling is limited to opening only one bag and analyzing it. The inconsistency of the shipment arrival time with the presence of laboratory personnel had caused resistance to the analysis of more samples (from other bags). Therefore, a shipment of calcium chloride with an unallowable percentage of IM was in warehouse and was gradually sent to a processing site to be used in the re‐mineralization of desalinated seawater (post treatment of desalinated seawater). The feeding system consists of a solution preparing/dosing tank and two feed pumps (one was a spare pump). Calcium chloride salt was poured manually and desalinated seawater was piped into the tank for dissolving. A stirrer was placed into service at tank for at least 15 minutes, dissolving all the salt in the desalinated seawater. There was a level controller on the dosing tank which, at a height of 25% of the solution, sent a trip signal to the feed pumps.
After about one month, the feed pumps repeatedly broke down to the point that the spare pump did not respond to the high number of failures. Therefore, the feeding was stopped and the desalinated seawater was sent to the downstream units without any post treatment.
Investigations have shown that both feed pumps failed due to the suction of sludge‐like materials and insoluble solids (or IM). Examination of the calcium chloride in the warehouse showed that the IM in more than 50% of the delivered shipment was about five times the allowable limit written in the text of the purchase agreement. In some bags, the amount of impurities was so high that debris and gravel particles were visible to the naked eye.
The document, which was communicated to the field operators as EMPA on the processing site, emphasized that before sending any chemical from the warehouse to the processing site, all the required analyses are performed and if the quality was appropriate, the chemical would transferred to the processing site. The EMPA document also stated that the contents of the solution preparing/dosing tank should be completely emptied after a maximum of five times of charge or solution preparing, and the bottom of the tank should be washed with water.
In this example, the failure to follow the three activities envisaged in the EMPA, namely (i) delivery instructions for the main warehouse, (ii) instructions for sending the chemical to the processing site, and (iii) instructions for washing the solution preparing/dosing tank, caused complete failure of the feed pumps and then stopped the calcium chloride being fed into the seawater desalination plant. It is quite clear to what extent the non‐feed of this salt into desalinated water (in order to achieve water stabilization) caused electrochemical corrosion in metal piping and other equipment [9]. Figure 5.38 represents the results of stoppage in remineralization of desalinated water.
The two cases given in this section clearly point to the important role of proper delivery in achieving proper quality control. Depending on the structure governing the activities of a processing site and the complexity of chemical quality control jobs, delivery can be extended from one step to two or more steps.
5.9.2 Storage
Both selection and procurement activities have a major impact on chemical storage. Selecting chemicals that fit well within the storage facilities in the industry, as well as the type of purchase contract (partial or total shipment), can ensure the correctness of storage activities. In storage, some important points should be considered, such as; storage of chemicals based on the conditions in the technical documents related to each, analysis and preparation of periodic reports of the status of chemicals in warehouse (including inventory), and management of input and output dates for each chemical.

Figure 5.38 A standard coupon in glass holder (top left) and removed from that after six months (top right), corrosion products on a laboratory scale (bottom left), and the cleaned and dried coupon (bottom right).
5.9.2.1 Operation History 14
A utility processing site purchased the dry calcium chloride, CaCl2, it needed in 25 kg, double‐layer bags. This chemical was delivered in 400 kg pallets (including 16 bags stacked on top of each other). Unloading the pallets from the truck and transporting them to the warehouse, moving the chemical into the warehouse, tearing the bags for sampling (without following the instructions for simultaneous sampling and delivery to the processing site), and the moisture adsorption of calcium chloride all caused a loss of quality for 70 tons of this chemical in three years.
Due to the absorption of moisture, the solubility of the chemical in water was severely reduced and created two problems for the utility processing site; (i) it was not possible to make pre‐calculated concentration for calcium chloride solution and to feed more of the solution into the process stream, and (ii) decreased calcium quality caused a significant amount of IM to settle in the solution preparing/dosing tank and caused the suction strainer of diaphragm pump to suck in particles and shut it down. In this case, the impossibility of feeding sufficient calcium chloride into the process stream reduced the quality of the product (desalinated seawater) as well as the electrochemical corrosion of all related equipment.
5.9.2.2 Operation History 15
A gas plant had a storage space disproportionate to the volume of chemicals it needed. The delivery of a shipment of 500 tons of activated carbon had left the liquid catalysts needed for the Merox™ process (a typical unit operation for elimination of sulphur from propane and butane [2]) stuck in corners, and the warehouse staff had lost access to the 4.5‐L catalyst containers. Along with to the simultaneous need for these catalysts with major overhauls and the lack of forklifts to move at least 30 activated carbon pallets, the warehouse worker had given the new catalyst shipment to responsible operation personnel in another part of the warehouse. Forgetting to reduce the inventory by removing older chemicals, the five gas plants were faced with 28 tons of expired liquid catalysts after one year, all of which had expired due to the lack of simple storage tips (more than two years difference between new and older materials expiration date).
5.9.2.3 Operation History 16
One utility processing site required 17 tons of sodium hypochlorite, NaOCl, per year. This processing site purchased all the sodium hypochlorite it needed from a chemical manufacturing company 1000 km away. Due to the location of the utility processing site in the tropics, as well as the lack of facilities (such as cold rooms and initial dilution to maintain the quality of the chemical), its commercial concentration was reduced from 12.5% to 5% in the first analysis after delivery of this chemical (about two months later).
Decreased effective concentrations of sodium hypochlorite and chemical deficiencies eventually led to poor quality control of products such as desalinated chlorinated seawater as industrial feed water. With a residence time of approximately six days from production, this water provided the feed of a demineralization unit that purified the MU water of the steam generation unit. Water entered the steam generation unit without biological stability and microbial measurements such as TBC and SRB showed that there was microbial growth in the steam‐generating unit, and as a result there was a risk of microbial corrosion, especially in dead points like cold condensate piping and bottom of cold steam condensate storage tanks. Biological slimes fouled in these sections may decompose in the boiler to form carbon dioxide and chlorides [24]. Chlorides should be limited in BW cycle [25]. It is obvious that the instability of desalinated seawater fed to the demineralization unit, in addition to increasing the growth potential of microbes in the steam generating unit, will cause biofouling in the mixed resins, which sometimes make their recovery and use very difficult or completely impossible [24, 31]. Sodium hypochlorite also has a slight oxidizing effect on some metal ions and residual desalinated organic matter in water [6, 49], which is an important factor in creating stable and non‐reversible fouling on charged resins in the demineralization unit. Oxidation of some organic matters by sodium hypochlorite may prevent the increasing level of biological growth and other anions in a boiler.
Finally, a change in the method of chemical delivery (here, partial shipment), the use of road trucks with cooling facilities, the use of a canteen with cooling facilities to create suitable storage conditions in the central warehouse and the warehouse of the processing site, change in the amount of storage per barrel from 220 L to 40 L, and a change in some consumption instructions, including how to dilute and use chlorine analysis instead of measuring residual chlorine, all improved the conditions and established a suitable EMPA for this chemical. The sum of these changes and the establishment of EMPA caused a 45% reduction in cost and a 70% increase in quality compared to the previous conditions (the study was conducted over a period of six months and the presented percentages were calculated based on the average figures reported in the six months before the study).
5.9.2.4 Operation History 17
A gas plant used a heat exchanger and a desalter to condition the gas condensate and then sent it (dehydrated) to the stabilization column for adjusting the RVP (for storage and then export). The gas condensate was first heated to a certain temperature and then entered into a desalter. The desalter had a demineralized water feed system and a transformer to create an electrical field for better separation of water (the aqueous phase or the phase in which salt was extracted). Therefore, it could be expected that the desalting process at this unit (gas condensate stabilization) was in fact a water removal process. In order to enhance the separation of the organic layer (gas condensate) and the aqueous layer (water inside the condensate, demineralized feed water, salt, and other minerals present in the gas condensate), a demulsifier chemical was fed into the gas condensate stream entering the desalter at a specified feed rate. Eventually, dehydrated gas condensate entered the stabilization column and lost its volatiles constituents such as propane and butane, and the bottom product of the column was sent to the floating storage roof tanks after degassing. If there was water in the stabilization column (i.e. distillation process) at the operating temperature of the column and in the presence of some mineral contaminants such as chloride (and carbon dioxide), it causes acidic properties and localized corrosion in the upper parts of the feed line to the column, especially in the condenser.
The demulsifier chemical was charged in the dosing tank at the condensate stabilization unit and was in service for six months. Measurements showed that salt removal and water content were in very good condition. There was then a problem with the desalter performance at the same time there was a need for chemical cleaning of one of the heat exchangers. Hence, there was a three-month break in chemical consumption. The contents of the dosing tank became two‐phase after the start of the processing site and completely lost its efficiency.
Investigations showed that there was a weakness in the readying of EMPA for this chemical; the processing site did not have temporary storage facilities and the moisture absorption of the demulsifier was not considered by the processing site supervisor. Therefore, an instruction was added to the existing set of documents so that in such events the contents of the dosing tank were transferred to closed barrels with suitable facilities or, if possible, use of a nitrogen blanket in the same dosing tank to prevent the atmosphere from entering the dosing tank.
5.9.2.5 Operation History 18
A utility processing site stored approximately 21 tons of calcium chloride for two years, which was needed for remineralization of its desalinated water. The amount purchased had no proportion to the amount of the chemical consumed daily. Many of the double‐layer plastic bags had rotted and damaged due to incorrect sampling, forklift handling, and sunlight. The cargo was stored in an open warehouse in a tropical region with an average humidity of 65–85% and a temperature of 15–48 °C.
Calcium chloride is a hygroscopic chemical and should be stored in a dry place [29, 51]. The long‐term adsorption of moisture and its subsequent condensation in the resulting crystals released a significant amount of moisture under the calcium chloride pallets in the warehouse (Figure 5.39).
Figure 5.39 Improper storage of calcium chloride in an open warehouse at a tropical region.
5.10 Consumption
This activity plays a very important role in having an EMPA, and almost all activities in the EMPA cycle will be the result of this section. Proper use can accurately highlight the strengths and weaknesses of the process and/or chemicals and positively influences all other activities. In this section, several operation histories will be given to better illustrate the concept of consumption and its place in EMPA. The consumption discussion is expected to address at least the general issues encountered; determine the chemical analysis of each process stream, issue dosing/solution preparing guidelines, periodically calibrate feed systems, routine chemical analysis of each utility or any other process stream, and receive feedback on treatment performance.
Figure 5.40 is a true block diagram of all the steps to be followed in the consumption activity. The most important part of this activity is the documentation, which must be carefully compiled under a proper classification protocol, and the various documents of each protocol must be loaded in the intended category. The documentation, which will be described in an independent section in this chapter, will be an important aid in reviewing system feedback, as well as studying its records. Classifying and preserving documents in all the activities in Figure 5.40 (as well as Figure 5.32) is the only way to distinguish process deviations from process difficulties, each of which requires its own solution method. In the absence of proper and classified documents, all correspondence made and forthcoming with chemical manufacturers/suppliers will be practically useless and can in no way be used to apply the legal clauses in the purchase contract (such as after‐sales service).
The following paragraphs provide examples to show how not following any of these steps in the consumption activity has resulted in poor quality control and ultimately increased corrosion risk (as well as other processing‐site operation parameters represented in Figure 5.11).
Figure 5.40 All steps in consumption of a chemical in a processing site.
5.10.1 Operation History 19
System Identification: a utility processing site (in a petroleum refinery) has a steam‐generating unit inside. The returned steam condensate from the hydrocarbon‐processing site is divided into two branches, one called “clean steam condensate” routes directly to the deaerators or steam condensate storage tanks; and the other branch called “suspect steam condensate,” which is purified from organics and inorganics, is sent to steam condensate storage tanks. The package that purifies suspect type of steam condensate, called the deoiling package, had problems with control logic at startup, and due to the requirement at initial startup of refinery, the startup operation team could not wait for the package to be ready.
Therefore, the steam production unit with a capacity of 700 tons per hour of medium pressure steam was started up, and after two months the deoiling package was ready to be put into service. One day after the service of this package, the concentration of DO in the return condensate to the main header (inlet to the storage tanks) increased sharply and the pH dropped by 1.5 units. Studies showed that this package removed some of the neutralizing and organic oxygen scavenger amines, and the quality control expert should have considered the effect of reducing their concentration due to the servicing of this package. Decreasing the pH of the steam condensate system and increasing the concentration of DO are two very important factors in corrosion associated with steam condensate lines and boilers [18, 19, 23].
5.10.2 Operation History 20
Defining Specs of Performance (Performance Characteristics Definition): A utility processing site would draw seawater from the sea to supply the industrial water it needed and desalinated it through the MED–TVC process. The seawater reached the utility processing site in a chlorinated and filtered type, and sodium bisulfite was used to remove free residual chlorine up to 0.15 ppm to prevent possible chlorine damage to the desalination plant material (stainless steel and copper alloys). An inadequate definition of the performance of the dechlorination chemical caused an analysis called “after bisulfite feed” placed in the quality control regime of analysis. In this analysis, the sample person had to take a sample from the sampling point after bisulfite feeding every four hours and analyze the free residual chlorine remaining in it. The low range of the measurement, as well as the numerous factors for systematic error, and errors in this analysis, sometimes caused the amount of dechlorinated chemical feeding to reach three times the required amount. Studies have shown that during the period when the system was controlled by this quality method, in many cases the equipment was at risk of corrosion (level of Cl2) and quality control was performed in an undesirable manner.
Later, with the establishment of EMPA, the proposed standard method for controlling the chlorinated seawater inlet to the desalination unit was a combination of routine sampling of a sodium bisulfite dosing tank (dechlorination chemical), and routine logging for the feeding rate of the pumps into the inlet stream. Then, applying of a stoichiometric dose for sodium bisulfite, finally a safe dose was proposed to ensure complete dechlorination [19]. The free residual chlorine analysis called “before bisulfite feed” was removed from the quality control regime of analysis because all the problems for chlorine analysis in the previous paragraph were also present here, and instead the EMPA document related to this section was changed to include controlling the quality of chlorine feed into seawater in SWI should be done by sampling the sodium hypochlorite reservoir and determining its concentration, and then regulating the amount of feeding into the seawater inlet to the utility processing site.
It is clear that in this schematic, chemistry control, which was incorrectly established in the system, in addition to poor quality control and the lack of meeting the operational needs, such as shock dose of both sodium hypochlorite and sodium bisulfite, also imposed a very large volume of useless analysis on the laboratory. This ultimately lead to the omission of more important analyses and increased corrosion risk (due to poor quality control) in other processing sections.
5.10.3 Operation History 21
A utility processing site received the raw water it needed from the sea, and the chlorinated and filtered seawater was then fed into a series of plate‐type heat exchangers to be preheated to enter five MED–TVC desalination packages. Improper chlorination caused the marine animals to grow in some exchangers and three heat exchangers were temporarily eliminated (by‐pass arrangement). Therefore, the designed flowrate caused premature destruction of the washers and leakage of the other in‐service heat exchangers (due to over flowing of inflow stream).
To solve this problem, the operating team decided to leave the seawater inlet valve that lead to the heat exchanger in a semi‐open position to allow less flowrate into the heat exchanger (a common mistake that increases turbulence and therefore cavitation). The angle of attack of the seawater flow was changed with this valve and severe corrosion was created in the plug of this butterfly valve. Opening the butterfly valve increases the conditions for cavitation by 20–60% [52, 53]. Heat exchanger insulation valve malfunction caused many problems for the utility site.
Studies showed that the amount of free residual chlorine entering the utility site was mistakenly estimated, and the low concentration of free residual chlorine (spec of performance) caused a corrosion in the plug of the insulation (on/off) valve and failure in three heat exchangers (Figure 5.41).

Figure 5.41 A corroded plug of seawater feed valve to series of heat exchangers.
5.10.4 Operation History 22
Preparation of an analysis regime: An ACF was used at a utility processing site for the final purification of drinking water. This ACF was designed as a corrective action to increase water quality and was installed on‐site (before chlorination and in the last stage of treatment process) [27]. The analysis regime was not considered for this filter and only the periodic analysis of the activated carbon adsorption capacity (by decommissioning and servicing the spare ACF) was mentioned. After some time, the preceding activated carbon manufacturer refused to sell to the utility processing site, so the required activated carbon was purchased from another reputable manufacturer and charged in the filter. After two months, the concentration of organic pollutants in the drinking water distribution system increased and the results of carbon adsorption tests, such as the iodine number and several other factors, were assumed to be good enough.
Studies have shown that due to changes in the manufacturer of activated carbon, analyses performed from the bed cannot be generalized to drinking water treatment conditions. This meant the right thing to do was to routinely perform a series of analyses of the treated water from the activated carbon bed; the quality of the effluent water is always monitored with a set of characteristic parameters of the ACF product. Thus, ignorance of the need for a routine analysis regime of the filter effluent caused problems with the quality of drinking water due to the entry of organic pollutants into the system when changing the brand of activated carbon. In addition to improper feeding of chlorine into the distribution system, these contaminants greatly increased the risk of biofilm formation and MIC [9, 54].
5.10.5 Operation History 23
Some analysis regimes are misleading, for example, at a utility processing site a process engineer presented special conductivity of a closed cooling water cycle to the laboratory as a characteristic parameter. Daily analysis and fluctuation in the results of this parameter wasted quite a bit of time and it was thought there was a source of contamination in the system; and due to its small fluctuation, caused a small change in specific conductivity and had no impact on other parameters such as pH and alkalinity. The inclusion of iron analysis in BW (continuous blowdown) routine schedule is another example of such unnecessary and misleading analysis.
Determining the required dose: For chemicals that are dosed into the system, it must be clearly specified how much of the chemical must be fed into the stream of the treating process. This dose can be fed in two ways depending on the type of chemical:
- For conventional chemicals whose chemical formula is well known, and the equilibrium data and reaction constants are known completely, the required dose can be based on stoichiometric calculations. Sometimes it's better to consider a safety factor for compensating the non‐idealities of the system, such as inadequate mixing. In this case, only the concentration or assay of pure chemical would be required, which is determined by known standard laboratory methods. The chemical purchased in this case was fed into the process stream in pure form or dissolved in water, and its impact was monitored downstream. If monitoring its impact on the treating stream was erroneous, then routine dose monitoring can be used.
- Feeding for licensed chemicals should only be done at the dose recommended by the manufacturer/supplier. In the event of a change in process conditions, the chemical after‐sales service representative must be notified immediately and the necessary advice sought. If there is a change in the storage conditions of chemicals or inconsistency of the lot number with documents delivered to the warehouse, the quality control department must immediately contact the after‐sales service department and refrain from taking any action. If any deviation is observed in the results of the analysis or the efficiency of the chemical is reduced, all process parameters must be checked first, and if no deviation is observed in the processes, the after‐sales service engineer must be notified. Dosage of these chemicals can be done as either “as chemical” or “as pure.” However, if a chemical includes after‐sales service, it is recommended to use “as chemical” type of calculations.
5.10.6 Operation History 24
A gas plant used a film‐forming CI to protect the sour water pipeline; sour water was the product of the sour gas processing and glycol regeneration. More than two years had passed since the expiration date of the CI, and due to the unpredictability of its purchase and the time‐consuming steps of the purchase‐tender (at least six months), an analysis was performed on the site and it was finally determined that if the chemical dose was increased to three times (meaning the residual CI at the end of the line) it could compensate for the effect of chemical decay. Therefore, the feeding was performed accordingly and the residual was increased from 5–10 ppm to 15–30 ppm.
The result was that, despite the proper corrosion prevention of the sour water pipeline, the increase in the film‐forming CI dose exacerbated the foaming tendency and hydrocarbon entrainment in the aqueous phase, so that the possibility of separation of water and other contaminants was missed at the inlet of the sour water stripping unit. Therefore, organic pollutants along with some very high volume mineral compounds entered the stripping column and deposited on the outer surface of the reboiler tubes. Figure 5.42 represents organic matter (and also inorganics) precipitations on a tube bundle in a train of a sour water stripping unit.
These deposits formed localized corrosion on the tubes, causing the two trains of sour water stripping to become out of service and their tubes bundles to be replaced four times (two times for each train, see Figure 5.43). In this example, it can be seen that the improper use of a licensed CI without consideration the principles of correspondence in the purchase contract, as well as the arbitrary conclusion of a few simple corrosion tests in the processing site laboratory led to localized corrosion and eventually stopped the operation of two trains of a processing unit.
Measuring the strength of a chemical: If a chemical is purely charged in a dosing tank and fed into a process stream, it is a very simple procedure, but sometimes the situation is such that it is not possible to feed pure chemical into the system. These conditions can include such things as feeding pump limitations, storage limitations, and fluctuations in treatment operations. Therefore, a chemical charge instruction is issued for preparing a solution in dosing package with water or any other solvent. This solution preparation will have error for a variety of reasons:
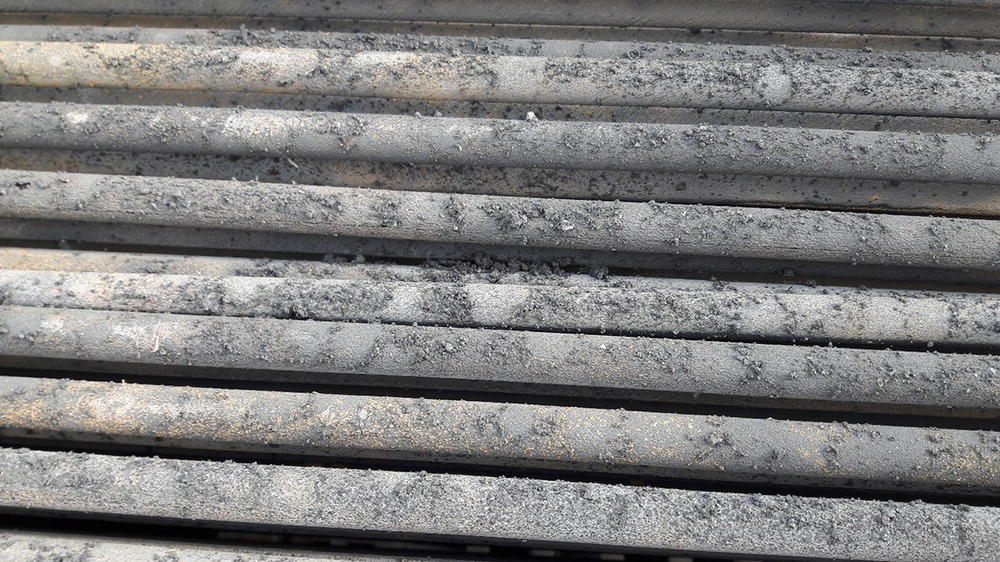
Figure 5.42 Precipitation on a tube bundle of a kettle type reboiler in a sour water stripping unit.
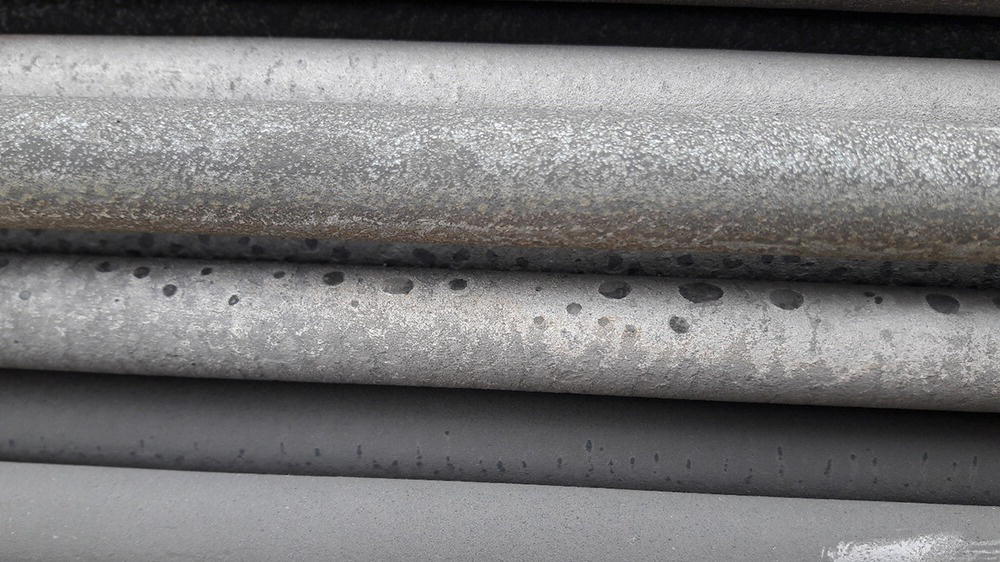
Figure 5.43 Same bundle after cleaning (localized corrosion, pits, are clearly represented).
- Change in the concentration of pure chemical and error in its measurement;
- Error in instrument for measuring the height of the chemical or the solution already in the solution preparing/dosing tank;
- Ingression of the atmosphere into the tank and partial deactivation of the solution in the tank;
- Error in measuring the concentration of residual solution (from preceding batches) in the solution preparing/dosing tank;
- Calculation error of dilution and execution error of instructions (or guidelines) issued;
- Problems in the mixer and improper mixing (there are many dosing tanks that have some problems with their mixers, like corroded propellers, unaligned shafts, and broken down motors); or
- Converting prepared solution into a nonhomogeneous one (formation of two phases due to heat, adsorption of humidity, and effect of dilution on solution stability).
Therefore, in order to know the concentration of the chemical in the tank, sampling and determination of the chemical concentration in the dosing tank should be included in the routine analysis regimes.
Knowing the strength of a chemical is also mandatory for some chemicals that are consumed in pure form. For example, although the amount of sodium nitrite, an anodic inhibitor [18, 55] feeding for the closed cooling system is provided to the site by the after‐sales service department of the manufacturer/supplier, knowing the chemical factor or chemical strength is required to regulate the concentration of residual nitrite in the system in subsequent charges and when for any reason a large amount of MU water entered the system.
Identification of production batch: There are many examples where a new shipment has different conditions and properties from the previous shipment(s). This has happened to both a new manufacturer/supplier and a previous seller. Therefore, when delivering a chemical from the site warehouse, and transferring it to the processing site to start consuming, it is necessary to pay attention to the lot number listed on the packaging of the chemical (bag, barrel, tons, etc.), and check its specifications with technical documents delivered to the commercial department. All safety calculations and considerations must be based on the same chemical available. Sometimes chemical sellers think that the purchasing department at a processing site wants to buy 200 tons of trisodium phosphate (TSP), for example, so it makes no difference whether they are delivered in 200‐L barrels with a concentration of 2% or less barrels with 5% of TSP. The purchasing department experts and quality control personnel (mainly process engineers) on a processing site should pay special attention to these issues.
Calibration of feeding packages: A liquid feeding package consists of several parts as shown in Figure 5.44. Depending on the type of chemical, a feeding package feeds chemical into the treating process stream, and more details are added to this basic form. Periodic calibration of each feeding package is a basic requirement of setting up an EMPA. In general, the only equipment that needs to be calibrated is the feed pump. Calibration tools are very simple and for feeding of liquids (which are mostly used in refineries, gas plants, petrochemicals, and utility processing sites of the energy industries) they consist of a calibration pot and a stopwatch.
For calibration, a systematic method must be created on the utility processing site, gas plant, and any other processing industries. Usually, the output of a feeding instruction should be subject to update of the calibration curves of feeding pumps. In general, there are two types of algorithms for feeding a chemical into a process stream, which are shown in Figure 5.45.
Some feeding systems depend on the flowrate of the process streams, which are called a flow pace system [47], and this dependency is placed in the computing block as a default function. Increasing the flowrate of a process stream increases the speed of rotation of the motor in the feeding pump and subsequently feeds more chemical. Therefore, the calibration graph for such a feeding system will be three‐dimensional with constant velocity or stroke curves, but if feeding of the chemical is not dependent on the flowrate of the process, then the curve will have only two dimensions (Figure 5.46). There are different types of feed pumps that all need to be calibrated [47].
Figure 5.44 A liquid chemical feed package and its minimum requirement.
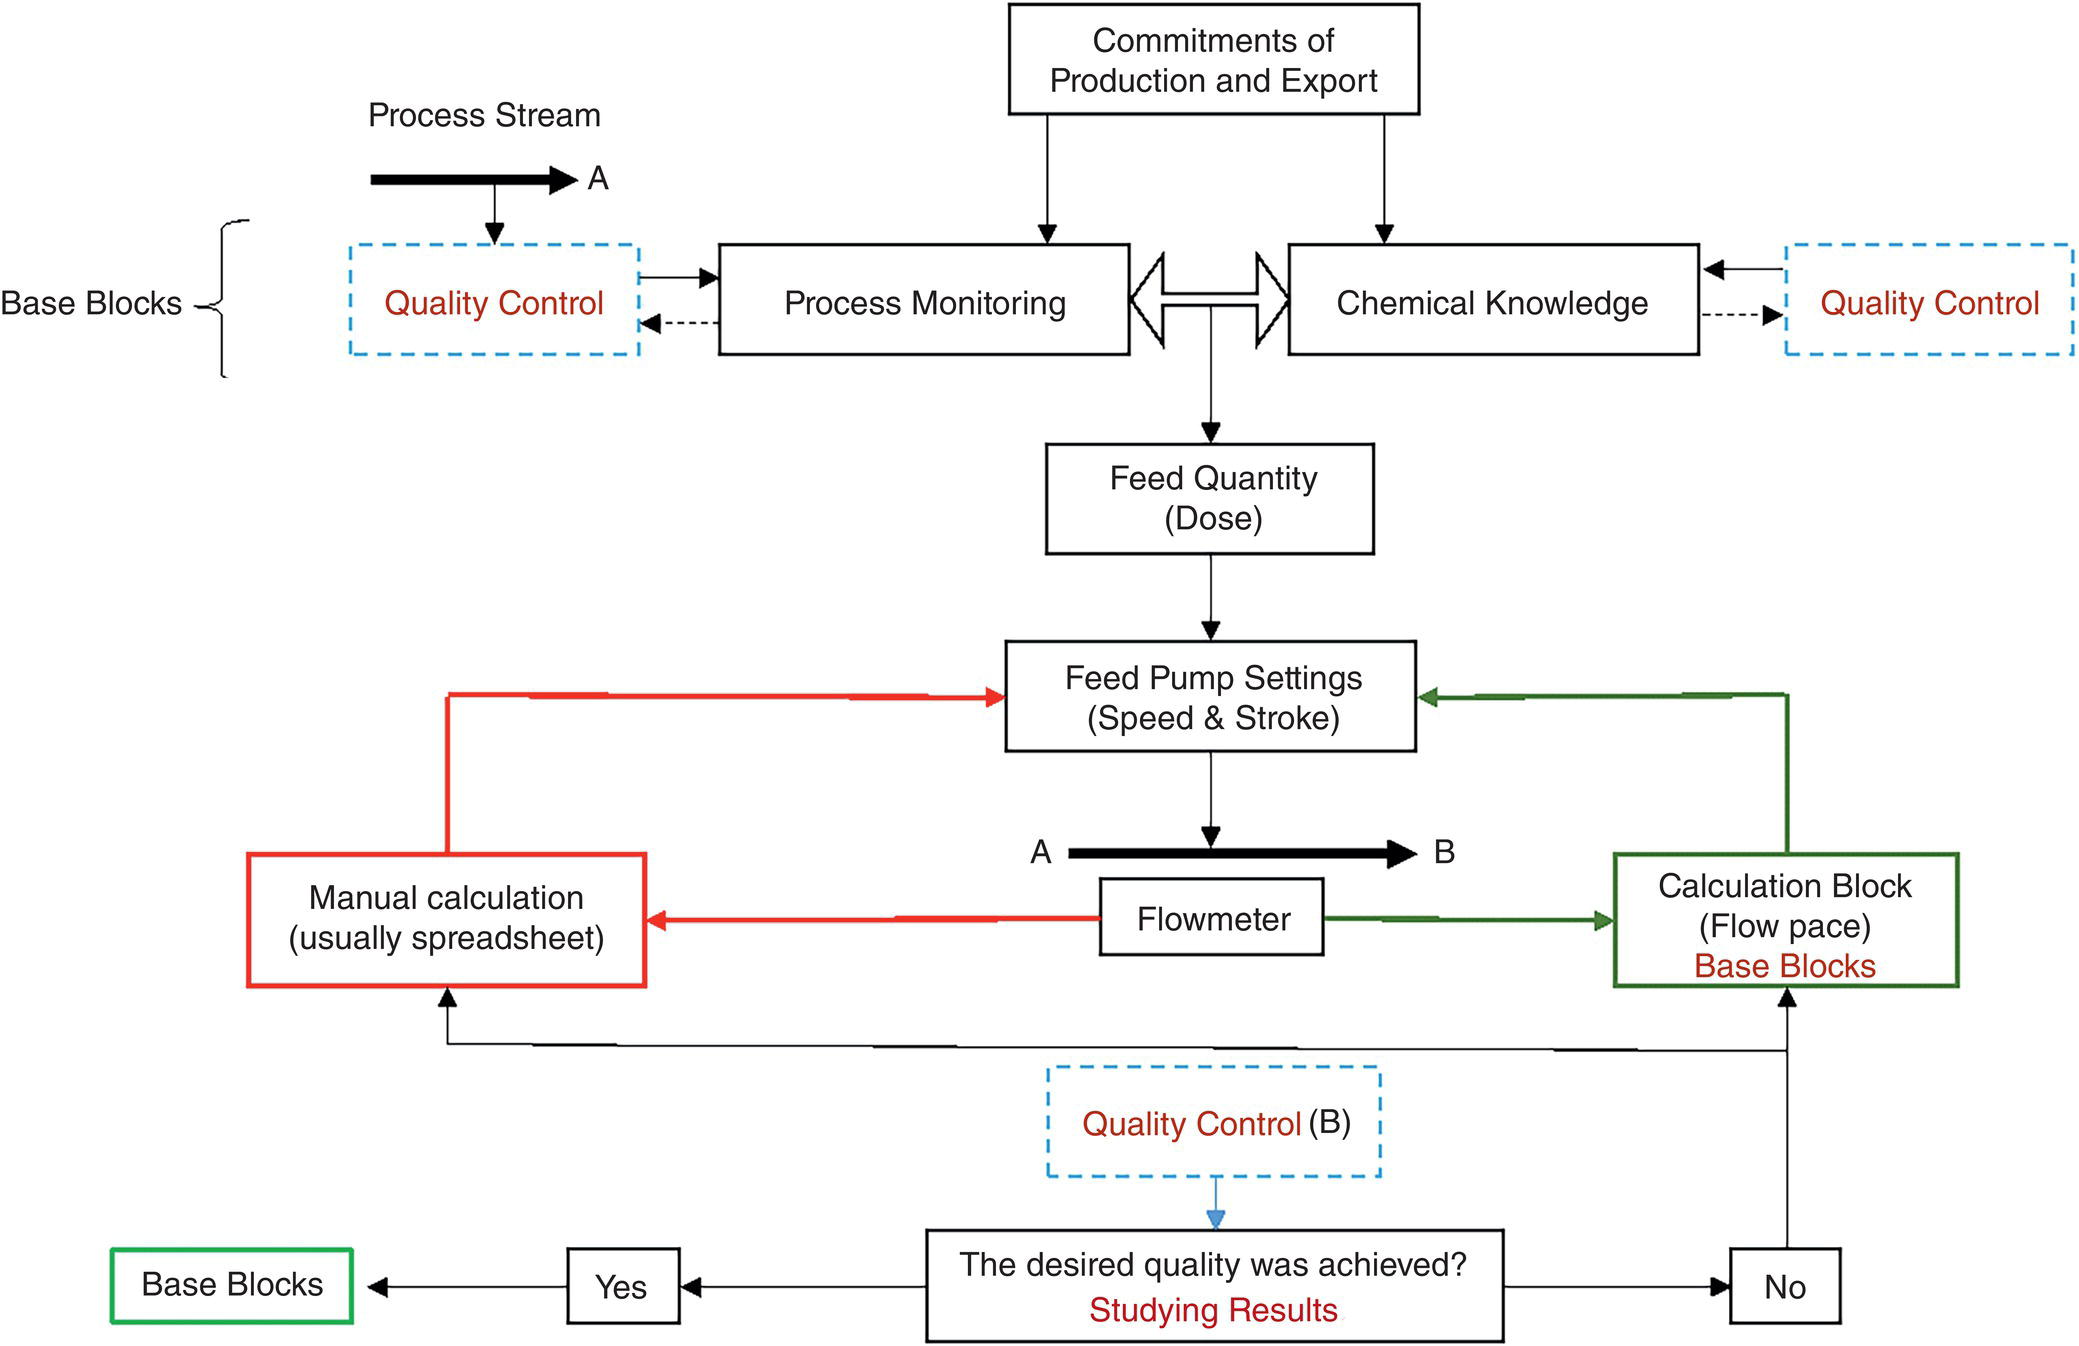
Figure 5.45 Two algorithms of feeding a chemical into a process stream.
Figure 5.46 Calibration graphs; (a) variable speed and variable stroke feed pump, (b) variable stroke feed pump.
One of the requirements for updating (or generating) calibration graphs is that over time the feeding package will have conditions for which the use of calibration graphs may not be valid even for a few days past the update being issued. The most important reasons for changing the calibrated (feeding) values for a designed chemical feeding package for a liquid can be one (or more) of the following;
- Change in the concentration of the chemical and the consequent change in the physical properties of the fluid (chemical), such as viscosity and density.
- Undesired pressure drop in the suction and feeding (discharge) section, which can be due to the corrosion and precipitation (the material of some feed packages is not suitable to the chemical and severe corrosion occurs in them). Therefore, corrosion products can accumulate as particles in the suction strainer of the feed pump and disrupt the feeding).
- Repair and replacement of feed pump parts such as diaphragm or pump course adjustment,
- Pump out of adjustment (so that it does not feed in the same setting as before).
- Leakage from the system, especially in the discharge path of feeding pumps.
- Passing pumped liquid from pressure safety valve (PSV) so that a small (or considerable) amount of the feed pump discharge stream returns to the dosing tank.
5.10.7 Operation History 25
A utility processing site used a combination of Metoxypropyleamine, MOPA, and Monoethanolamine, MEA, to both adjust and raise the pH of its return condensate. The chemical is charged in barrels in the dosing tank, and after dilution with demineralized water, is fed into eight points of the process in the steam production unit. According to the manufacturer's documentation, the recommended dose of 1.5 ppm of the chemical was to be fed into the system as pure, to reach a pH in the range of 8.8–9.2 [19]. After some time, the pH dropped and was barely controlled at 8.5. Investigations showed that a leak in the isolation valve related to the calibration pot caused the operator to make an error when updating the calibration curves for the pumps, and to misread the pumped volume of liquid in the pot. The isolation valve leak was quickly remedied, but within one week the system experienced a poor quality control reading. As we have seen, not paying attention to the basic points in the use of chemicals (here, the calibration of the feeding package) will cause the system to be at risk of corrosion due to the lack of adjustment of the pH of the steam condensate system in the predetermined amount [12, 18, 19].
Study of results: As shown in Figure 5.44, after feeding a chemical into a process stream, the expected results must be studied. For example, if a chemical is to produce a certain amount of zinc and phosphate in a process stream to inhibit the corrosion [18, 54], then the concentration of these two quality control parameters must be analyzed both up‐ and downstream (points A and B), where the mixing is done, and the treatment efficiency must be determined and recorded. Comparison of the values obtained from the analysis (after performing the error analysis in the laboratory [29]) with the expected values obtained through stoichiometry or the manufacturer's recommended dose (after performing the error and uncertainty analysis by analytical techniques in the feeding calculations, logics or manual [56]) will determine the level at which the EMPA is running. Obtaining a reasonable approximation between the expected values and the measured values for some chemical parameters is an integral part of the chemical consumption activity at the processing sites.
5.10.8 Operation History 26
One steam‐generating site used a combination of Morpholine and two other amines to adjust the pH of return steam condensate. According to the tables in the chemical documentation, 1.2 ppm of this chemical was sufficient to bring the pH to 9 (which, of course, is also influenced by the return of the steam condensate containing the amine). Considering the process stream flowrate, 2.6 tons of this neutralizing amine were required annually, but after three years of operation, the consumption of this chemical had gradually reached 66 tons per year. After much correspondence with the manufacturer and additional laboratory tests, it was found that the utility processing site had a major problem with pH measurement and did not follow pH measurement instructions from ultra‐purified dosed water [57].
Unfortunately, this utility processing site did not have an EMPA for its chemical handling activities and did not calculate and report as pure amine doses. However, the lost calculations could be recovered by considering the chemical charged in the dosing tank over three months, and the result was the dose of neutralizing amine (which was a combination of three amines) in some cases reached 30 ppm, as chemical. Therefore, a fast stabilizing pH sensor that is suitable for purified dosed water was immediately purchased for this site. By improving the measurements, the required amount of amine started to decrease and after two months reached 110% of the predicted amount (197 kg/month, or 2.86 tons per year).
As can be seen in this example, a simple mistake and ignoring the principles of working with chemicals (routine dose monitoring) has caused an inappropriate event in terms of the use of the neutralizing amine chemical. Some amines fail molecularly to form organic acid at high operating temperatures in the boiler [18]. Therefore, considering the production of organic acids in the system at an operating temperature of 435 °C, it can be expected that the system also had a risk of acidic corrosion; however, this is difficult to prove due to the adsorption capacity in some types of CPP (that contain ACF) as well as the neutralizing capacity of the newly fed amine into the system. Nevertheless, increasing the required amine concentration by 25 times (30 ppm/1.2 ppm equals 25) was a serious issue to increase the rate of amine degradation in the system.
5.10.9 Operation History 27
A gas plant had a closed cooling water system. This system consisted of a volume of approximately 20 000 m3 along with two expansion tanks, each with a volume of 1350 m3. The chemical, sodium nitrite, was fed into the system as a batch of anodic CI. The decrease in nitrite concentration made personnel think that there was an active corrosion in the system, because they recognized nitrite as a “dangerous corrosion inhibitor” [18].
Examinations showed that the field operator did not follow an important guideline in EMPA; in addition to (i) monthly controls of nitrite concentration at seven points of the system (for better monitoring of residual CI), to be applied as diluted CI (ii) for the volume of MU water received. The field operator ignored part ii above. Part of the closed cooling system leaked and the water level in both expansion tanks reached a critical level once every 20 days. The field operator opened the MU water hand valves, and at the same time did not start the diluted anodic CI feeding pump. Hence, pure water entered the system and as a result, the nitrite concentration was reduced without any destructive events. However, it was obvious the reduction of CI level could place the system at risk of corrosion [18].
It is therefore recommended that the process engineer, or any other person responsible for quality control resulting from chemical‐related activities, receive feedback from all its activities and carefully study the unexpected results that can be considered as process deviations. Figure 5.44 shows a simple diagram of the “studying results” position.
Documentation: The largest workload in any of the EMPA activities is related to the consumption stage. All steps in this stage must be documented with appropriate quality. The availability of all documents is an important aid in determining the reasons for deviations from the desired chemical control (which leads the processing site to the optimal control of all operating parameters, including corrosion). It can be considered that recording and classifying all the steps along with the necessary details can increase the level of awareness of quality control officials about the conditions of the final and intermediate products and help them to reach an EMPA.
However, it should be noted that there are many process sites that, despite documenting and classifying almost all the steps in the consumption stage, suffer from damage (and other operating parameters) due to the non‐implementation of an EMPA. Therefore, it is obvious that in order to increase the impact factor of the documentation in the consumption stage, a proper configuration must be used. The experience of more than 10 large processing sites in the field of oil, gas, and related utilities indicates a serious shortcoming when not using an effective configuration to document the steps in this area.
Tracing industrial cases in which misuse of chemicals has led to corrosion of equipment, and subsequently tracing the root causes of these misuses in consumption, have all proved to the author that following a histogram configuration works best. To better understand histogram configuration, the concept of treatment histogram must first be introduced. The performance of a sand filter, chlorine feeding for disinfection, and finally the use of a demulsifier to separate oil from water are all routinely measured, reported, and interpreted. The preparation of these results and interpretations in the form of a graduated tape based on operating days (or hours) implicitly gives us a treatment histogram for a system.
5.10.10 Operation History 28
A proper treatment histogram helped the author realize, after three years, that at a gas plant in early November, the feeding of neutralizing amine and organic oxygen scavenger (volatile) for the steam and its condensate system would always increase by 50% or more to keep the quality of steam condensate and BFW. The reason was the increase in heat transfer in the steam condensers and the consequent increase in the condensation rate, which caused the oxygen ingress into the condensate collection system and also reduced the performance of the steam traps (due to the decrease in condensate temperature by more than 70 °C). Therefore, the atmosphere penetrated the steam condensate collection system, DO increased in the steam condensate system, and pH decreased in the boiler system. The gas plant was located in the tropics, with average temperatures and wind speeds changing each year in early November.
5.11 Reporting
All activities in EMPA (Figure 5.32) must be reported, clearly and effectively. A report should include the necessary details at each step of the process, as well as feedback on each separate activity. Because the process and its needs are changing continuously, reporting should be done routinely at proper intervals. This will allow a processing site to review events and make decisions at the right time. Existence of such reports, in addition to the possibility of analyzing operating conditions and predicting future needs, helps the process engineer and other people in charge on the site to better understand the root(s) of many deviations, problems, and consequently to be able to plan for eliminating them.
Knowing that most activities in this cycle (EMPA) have a humane approach and are not controlled by logics, reporting (which is known to be an important part of the documentation) must be able to link the activities performed in EMPA with the data obtained from the DCS of a processing site. A purposeful set of reports over a period of time, such as one year, that have properly analyzed the processes can be a great feed for engineering management (or quality control) system designers who decide to make a cross‐link between manual documentation and the histograms obtained from the DCS data.
In utility and gas processing industries where a significant number of chemicals are used on processing sites, separate reports are required for each chemical. Sometimes the same chemical is used in several processing units; in this case, a separate analysis should be considered for each point of use on the processing site, as well as completely independent feedback.
Sometimes the emphasis on preparing a separate report for each chemical, and then preparing a separate report for each point of use (for each chemical) may distress the head of process engineering, but it should be known that this is a systematic approach to reduce errors, to achieve maximum quality and placement of the process at its best performance point. There are examples that a processing site, after six months of strict adherence to this approach, has been able to recognize all the parameters of its process sensitivity, and by implementing a quality control system (in interaction with DCS), were able to assign a large part of the full implementation of EMPA to the custom software.
One of the important points in these routine reports is the monitoring that ultimately leads to the announcement of the inventory and expiration date of a particular chemical. It may be interesting to note that inadequate monitoring of the inventory of a chemical can eventually cost engineers time to study and replace an improper chemical, and due to the urgency of supplying the chemical, the same chemical can be purchased again to avoid unplanned shutdowns. Inventory monitoring also has positive impacts on procurement, delivery, and storage activities.
Depending on the type of chemical, its storage restrictions, and consumption at the processing site, inventory can be announced at specific intervals. A simple application is to be able to estimate the average consumption rate in the coming days and reorder according to inventory [47]. To determine the end point and the order point, one can refer to the extrapolation of consumption rate, and refer to the “inventory strategy document” of the same chemical, respectively.
Some processing sites have developed an inventory strategy for their sensitive chemicals. For example, they always want to have at least two activated carbon filters in stock. It should be noted that this strategic inventory is reduced from the total need of the site for that chemical, and after receiving the new purchased chemical, that strategic inventory should be put in the consumption queue first. Corrosion never stops and the fight against it should not stop; hence, one of the most important applications for “strategic inventory” is to think of measures to prevent corrosion. In the meantime, the plant must have a clear definition of their strategic inventory of all kinds of chemicals that affect corrosion in some way.
5.12 Documentation
The last two paragraphs of Section 5.7 and other sections of the book reiterate the importance of documentation when working with chemicals along with some of the differences in documentation in other sections of a process site. Here are the features of effective documentation:
- Each document should help us to visualize ourselves in the past by studying it, so, we have to be good and patient writers.
- Have a set of predefined templates to take the least amount of time to refer to past actions, as well as describing past treatment conditions. Therefore, all your documentation should be consistent.
- An improvement cycle should be established to update the prepared documents, as well as identify all the documents needed to cover the details of the activities. Years of working on a processing site can tell process engineers and other quality control officials what documents should be routinely or non‐routinely prepared to help effectively review system history. Having a set of notebooks for each system covering all the site events related to chemicals can be a very effective means to create a comprehensive coverage for all the required documents.
- Considering that each of these documents must contain specific details and that many of their contents may be site specific; the details of each document are beyond the scope of this chapter. Table 5.6 is an attempt to identify and provide all the documentation required for each of the EMPA activities.
Table 5.6 Identified documents for each activity in EMPA.
| Title | Type of generating | Frequency of issuing | Main purpose(s) |
|---|---|---|---|
| Selection | |||
| Quality control plan | Non‐routine, flowchart | – | To present targets of quality control by chemicals |
| Impact evaluation | Routine, technical report | Monthly | To present chemical impacts on entire plant operation (Figure 5.11) |
| Pre‐evaluation of project chemicals | Non‐routine, technical report | – | To ensure proper chemical selection in project prior to consumption |
| Chemical selection | Non‐routine, technical report | – | To review and modify initial chemical selection document |
| Management of changes | Non‐routine, technical report | – | To present all reactions to changes in process conditions related chemical(s) feeding |
| Chemical performance | Routine, technical report | Weekly | To present the performance of a chemical |
| Feasibility of manufacturing/supply | Non‐routine, technical report | – | To inform the process engineering department regarding replacement or substitution |
| Procurement | |||
| Purchasing contract | Non‐routine, legal format | – | To clear legal aspects and commerce |
| Procurement feedback | Routine, inter‐departmental format | Weekly | To modify related actions extracted from feedback |
| Delivery | |||
| Delivery log sheets | Routine, pre‐defined logs | Weekly | To inform process supervisors and the process engineering department about re‐calculating the required dose |
| Delivery events | Routine, pre‐defined format | Weekly | To inform process engineers about documentation and use it for further troubleshooting |
| Storage | |||
| Point of reordering | Routine, pre‐defined format | Monthly | To cover the required inventory |
| Consumption | |||
| Process sensitivity analysis | Routine, technical report | Weekly | To clear all sensitive parameters impacted by chemical(s) |
| Chemical impact | Routine, technical report | Monthly | To present chemical impacts on entire plant operation (Figure 5.11) |
| Plant performance | Routine, technical report | Monthly | To present plant performance related to chemical(s) |
| Analytical regime | Non‐routine, table | – | To cover testing regime by laboratory |
| Dosing calculation notes | Routine, spreadsheet | Once per shift | To document the method of calculating required dose |
| Calibration graphs | Routine, graph (table) | Weekly | To present a new calibration graph |
| Solution‐preparing guidelines | Non‐routine, guideline format | – | To instruct the method of solution preparation |
| Manufacturer/supplier correspondence | Non‐routine, letter classification format | – | To record documents for legal aspects |
| After‐sale services | Routine, letter classification format | Daily | To follow product specialist guidelines (or procedures) for licensed chemicals |
| Troubleshooting | Non‐routine, technical report | – | To present all process deviations, problems, failures, and issues, as well as the way(s) of modifying and returning the process condition to normal |
5.13 Summary
Every processing site in the oil, gas, and petrochemical industries needs chemicals to continue their operations. A serious look at these chemicals and their impacts on the main parameters of the operation makes their importance even more clear. These chemicals have important impacts on the economy, corrosion, energy, quality control, and the environment. These chemicals can eventually lead to reduced production as well as the production of off‐spec products. Following a proposed work frame called Effective Management of Process Additives (EMPA), can help optimize the operation of a processing site to minimize or eliminate the undesired impacts of chemical consumption. A look at all the industrial cases given in this chapter shows that analyzing the impacts of the use of these chemicals on the overall operation of a process site is not possible without considering the process analysis skills from an engineering perspective. Although all of these industrial cases have tried to explain how equipment corrosion is affected by the six activities available in EMPA, it is clear that not following and not knowing any of EMPA activities can impact other management parameters in a processing site, this is stated in the several operation histories.
Abbreviations
- ACF
- Activated carbon filter
- AI
- Aggressiveness index
- API
- American petroleum institute
- BFW
- Boiler feed water
- BIOX
- Biological oxidation
- BW
- Boiler water
- C5 +
- Pentane plus (hydrocarbon heavier than pentane)
- CCPP
- Calcium carbonate precipitation potential
- COD
- Chemical oxygen demand
- CSC
- Cold steam condensate
- DAP
- Di‐ammonium phosphate
- DCS
- Distributed control system
- DO
- Dissolved oxygen
- EMPA
- Effective management of process additives (chemicals)
- FG
- Fuel gas
- GHG
- Greenhouse gas
- IGF
- Induced gas flotation
- IM
- Insoluble matters
- IOX
- Ion exchange
- LIMS
- Laboratory information and management system
- LSI
- Langelier stability index
- LPG
- Liquefied petroleum gas
- MEA
- Monoethanolamine
- MED–TVC
- Multiple effect distillation–thermo vapor compression
- MIC
- Microbiologically influenced corrosion
- MOC
- Management of change
- MOPA
- Metoxypropyleamine
- MU
- Make up
- NGL
- Natural gas liquids
- OWIS
- oily water inlet sump
- OWS
- Oily water sewer
- OWTP
- Oily water treatment package
- PCV
- Pressure control valve
- POS
- Potentially oily sewer
- ROS
- Recovered oil sump
- RVP
- Reid vapor pressure
- SBR
- Sequencing batch reactor
- SCNP
- Spent caustic neutralization package
- SRB
- Sulfate reducing bacteria
- SWI
- Seawater intake
- TDS
- Total dissolved solid
- TSP
- Trisodium phosphate
- TSS
- Total suspended solids
- WWTP
- Wastewater treatment plant
References
- 1 Guo, B. and Ghalambor, A. (2005). Natural Gas Engineering Handbook. Houston, TX: Gulf Publishing Company.
- 2 Kidnay, A.J. and Parrish, W.R. (2006). Fundamentals of Natural Gas Processing. Boca Raton, Florida: CRC Press.
- 3 Stewart, M. (2014). Surface Production Operations, Volume 2: Design of Gas‐Handling Systems and Facilities, 3e. Houston, TX: Gulf Publishing Company.
- 4 Stewart, M. and Arnold, K. (2011). Gas Dehydration Field Manual. Elsevier: Gulf Professional Publishing.
- 5 Metcalf & Eddy / Aecom (2003). Wastewater Engineering, Treatment and Resource Recovery, 5e, vol. 1. McGraw‐Hill.
- 6 Davis, M.L. (2010). Water and Wastewater Engineering: Design Principles and Practice. McGraw‐Hill.
- 7 Beychok, M.R. (1967). Aqueous Wastes from Petroleum and Petrochemical Plants. London: John Wiley & Sons.
- 8 American Water Work Association (AWWA). (2011). Desalination of Seawater, AWWA Manual M61, Denver, CO.
- 9 Lahav, O., Voutchkov, N., and Birnhack, L. (2012). Post Treatment of Desalinated Water. Hopkinton: Balaban Desalination Publications.
- 10 WHO. (2004). Guideline for Drinking‐Water Quality, 3rd ed., Chapter 8, http://www.wh‐o.int/water_sanitation_health/dwq/GDWQ2004web.pdf.
- 11 Buecker, B. (2000). Fundamentals of Steam Generation Chemistry. PenWell.
- 12 Nalco Company (2011). The Nalco Guide to Boiler Failure Analysis, 2e. McGraw‐Hill.
- 13 Saji, S.V., Sorour, A.A., and Meroufel, A.A. (2020). Corrosion and Fouling Control in Desalination Industry. Switzerland: Springer.
- 14 Duranceau, S.J., Pfeiffer‐Wiler, R.J., Douglas, S.A. et al. (2011). Post‐Treatment Stabilization of Desalinated Water, Water Research Foundation.
- 15 Cotruvo, J., Voutchkov, N., Fawell, J. et al. (2010). Desalination Technology: Health and Environmental Impacts. Boca Raton, FL: CRC Press.
- 16 USEPA. (1980). Volatile Corrosion Inhibitors and Boiler Water Additives: Potential for Nitrosamine Formation, Toxic Substances, EPA. 560/11‐80‐023.
- 17 Javaherdashti, R. and Nikraz, H. (2010). A Global Warning on Corrosion and Environment: A New Look at Existing Technical and Managerial Strategies and Tactics. VDM Verlag.
- 18 Nalco Company (2009). The Nalco Water Handbook, 3e. McGraw‐Hill.
- 19 Association of Water Technologies (AWT), Inc. (2001). Technical Reference and Training Manual, 2e. Rockville, MD.
- 20 Stewart, M. and Arnold, K. (2009). Emulsions and Oil Treating Equipment: Selection, Sizing and Troubleshooting. Gulf Professional Publishing, Elsevier.
- 21 Rossmoore, H.W. (ed.) (1995). Handbook of Biocide and Preservative Use. Springer.
- 22 The American Society of Mechanical Engineers (ASME). (2011). High‐Purity Water Treatment Systems. PTC, 31, (Performance Test Codes).
- 23 BetzDearborn, Inc. (1991). Betz Handbook of Industrial Water Conditioning, 9e. Trevose, Pennsylvania.
- 24 Crits, G.J. (2003). Condensate Polishing: Purification Technology for Steam Power. Tall Oaks Publishing.
- 25 The American Society of Mechanical Engineers (ASME). (1998). Consensus on Operating Practices for he Control of Feedwater and Boiler Water Chemistry in Modern Industrial Boilers, CRTD, 34.
- 26 American Water Work Association. (2005). Granular Activated Carbon, ANSI/AWWA B604‐05.
- 27 Chowdhury, Z.K., Summers, R.S., Westerhoff, G.P. et al. (2013). Activated Carbon: Solutions for Improving Water Quality. Denver, CO: American Water Works Association.
- 28 The American Society of Mechanical Engineers (ASME). (2002). Consensus for the Lay‐Up of Boilers, Turbines, Turbine Condensers, and Auxiliary Equipment, CRTD, 66.
- 29 Ullmann's Encyclopedia of Industrial Chemistry. 2002. Wiley VCH‐Verlag.
- 30 Kurita Water Industries Ltd. (1999). Kurita Handbook of Water Treatment, 2nd ed., Japan.
- 31 Crits, G.J. (2012). Crits Notes on Water and Ion Exchange. Chemical Publishing Company.
- 32 The American Society of Mechanical Engineers (ASME). (2014). Performance Test Code on Deaerators, PTC 12(3).
- 33 Stewart, M. and Arnold, K. (2011). Produced Water Treatment Field Manual. Gulf Professional Publishing, Elsevier.
- 34 Lazarova, V., Choo, K., and Cornel, P. (2012). Water‐Energy Interactions in Water Reuse. IWA Publishing.
- 35 American Petroleum Institute (API) (1990). Monographs on Refinery Environmental Control ‐Management of Water Discharges, 1e. API Publication 421.
- 36 Berne, F. and Cordonnier, J. (1996). Industrial Water Treatment: Refining, Petrochemicals and Gas Processing Techniques. France: Gulf Publishing Company.
- 37 Water Environment Federation. (2002). Activated Sludge, 2nd ed. Manual of Practice OM‐9, USA.
- 38 Lawrence, K.W., Yang‐Tse, H., Howard, H.L. et al. (2006). Waste Treatment in the Process Industries. Boca Raton, FL: CRC Press.
- 39 Javaherdashti, R. (2017). Microbiologically Influenced Corrosion: An Engineering Insight, 2e. Switzerland: Springer International Publishing.
- 40 Connell, G.F. (1996). The Chlorination/Chloramination Handbook. Denver, CO: American Water Works Association.
- 41 Todd, B. (1967). The corrosion of materials in desalination plants. Desalination 3: 106–117.
- 42 Silverman, D.C. (2003). Aqueous corrosion. In: Corrosion: Fundamentals, Testing, and Protection, vol. 13A (eds. S.D. Cramer and B.S. Covino), 190–195. ASM Handbook, ASM International.
- 43 American Water Work Association. (2005). Sodium Metabisulfite. ANSI/AWWA B601–05.
- 44 The American Society of Mechanical Engineers (ASME). (2008). Steam and Water Sampling, Conditioning, and Analysis in the Power Cycle. PTC, 19(11), (Performance Test Codes).
- 45 The American Society of Mechanical Engineers (ASME). (2006). Consensus on Operating Practices for the Sampling and Monitoring of Feedwater and Boiler Water Chemistry in Modern Industrial Boilers, CRTD, 81.
- 46 Treybal, R.E. (1981). Mass Transfer Operations. McGraw‐Hill Publications.
- 47 Lauer, W.C., Barsotti, M.G., and Hardy, D.K. (2009). Chemical Feed Field Guide for Water Treatment Plant Operators. Denver, CO: American Water Works Association.
- 48 American Water Work Association (AWWA) (2006). Water Chlorination/Chloramination Practices and Principles. Denver, CO: AWWA Manual M20.
- 49 Black and Veatch Corporation (2010). White's Handbook of Chlorination and Alternative Disinfectants, 5e, vol. 287. John Wiley & Sons.
- 50 American Water Work Association. (2004). Hypochlorites. ANSI/AWWA B300‐04.
- 51 American Water Work Association. (2010). Calcium Chloride. ANSI/AWWA B550‐10.
- 52 Yanga, B.S., Hwanga, W.W., Myung‐Han, K. et al. (2005). Cavitation detection of butterfly valve using support vector machines. Journal of Sound and Vibration 287: 25–43.
- 53 American Water Work Association (AWWA) (2012). Butterfly Valves: Torque, Head Loss, and cavitation Analysis. Denver, CO: AWWA Manual M49.
- 54 American Water Work Association (AWWA) (2011). Internal Corrosion Control in Water Distribution Systems. Denver, CO: AWWA Manual M58.
- 55 Nalco Company (2015). The Nalco Guide to Cooling Water Systems Failure Analysis, 2e. McGraw Hill.
- 56 The American Society of Mechanical Engineers (ASME). (2005). Test Uncertainty, PTC, 19(1), (Performance Test Codes).
- 57 ASTM D1293‐18 (2018). Standard Test Methods for pH of Water. West Conshohocken, PA: ASTM International.