Learning how to edit table calculations yourself is an advanced capability, but it gives you the opportunity to create rich metrics, such as the percent difference from an average.
In the first example, we will modify the running sum of Remittances per Capita so that it includes the preceding and next three values, which can be done from the edit table calculation dialogue by entering those numbers in their respective places.
In the second example, we will modify the Remittances per Capita percent difference table calculation to show the percent difference from the average.
Let's begin with the first example. We'll modify the running sum in the following way:
- In order to edit the table calculation, duplicate the sheet on which we created the original moving average worksheet, which maintains the integrity of the work that we have already done.
- Then, drag the pill for the moving average of Remittances per Capita from the Rows shelf to the Measures shelf, which prompts us to rename it. Let's call it Smoother Remittances per Capita.
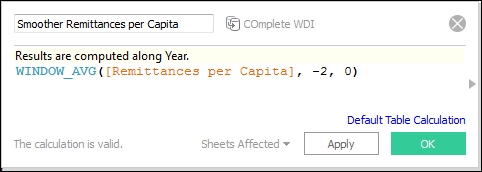
- The original table calculation, as shown in the following screenshot, has one function, one expression, a start offset, and an end offset:
- The
WINDOW_AVGfunction tells Tableau Public that the field can be addressed and we want it to apply theAVGfunction to the values - The expression, in this case, is the field on which the calculation is operating
- The start offset, by default, is two places prior to end offset and hence, it has the negative sign
- The end offset, by default, is at the current value, as shown in the following screenshot:
- The
- Modify this calculated field to include three previous and three future values by replacing
-2and0with3and3respectively, as shown in the following screenshot. You can also create an integer parameter and allow users to set the number. We will show you how to do that in the chapter on parameters:
The result is a calculated field that is much smoother than the original one.
In the second example, we'll calculate the percentage difference from the average Remittances per Capita. First, we will show you the original calculated field, and then, we'll show the changes that we made.
We duplicated the sheet on which we were working and then dragged the percent differences of the Remittances per Capita field to the Measures pane, where we renamed it to Remittances per Capita % Diff from Avg, as shown in the following screenshot:
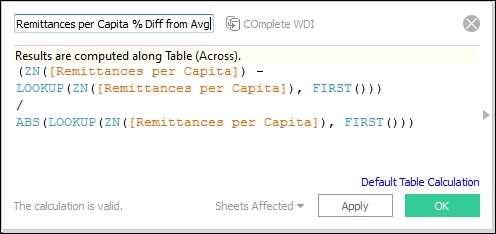
In the formula box, Tableau Public calculates the value for each year, subtracts the value of the first year from it, and divides it with the value for the first year.
The following are a few new functions in this formula:
- ZN: This means that Tableau Public uses 0 if the value is null.
- LOOKUP: This finds a value specified by an offset from the current value. In this case it's
-1, which means the previous value, but it could be anything. The other values are the FIRST() and LAST() functions. - ABS: This takes the absolute value of the previous value. When writing table calculations, you should always use ZN and ABS, even if you think you don't need them at the time, because you do not necessarily know what will be in your data set in the future.
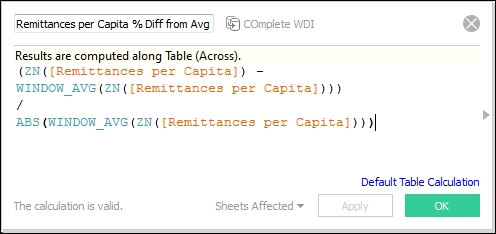
In order for this to be the percent difference from the average, change the references to the first value to the references to the WINDOW_AVG.
- Replace LOOKUP with WINDOW_AVG.
- Then, delete both instances of the string and the FIRST() function, because in this case, the WINDOW_AVG does not need an offset, like we had in the previous exercise. We want to use the average for the whole partition.
The new formula looks like the one shown in the following screenshot: