
The Main Window
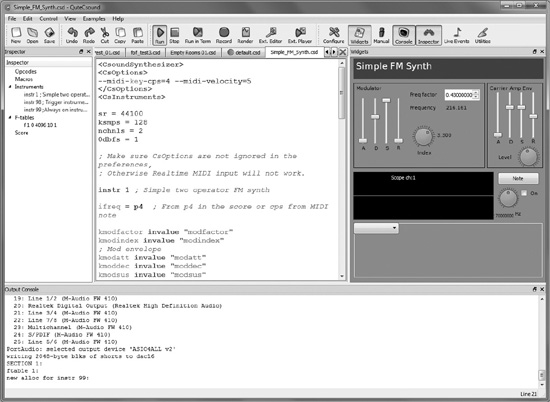
The main window of CsoundQt is divided into several panes, as shown in Figure 5.4. Below the menu bar and tool button bar, which run across the top of the window, are four areas. The Inspector runs down the left side and the Console across the bottom. The multi-tabbed text editor occupies the central area. On the right is a dual-purpose pane, which can show the Widgets, the Csound manual, or both at once. Each of these areas, except the editor, can be closed by clicking the X button in its upper-right corner. They can be resized by clicking and dragging on the border between two areas; the mouse cursor will turn into a double line with arrows when you’re in the right spot to resize the panes. Note, however, that each pane has a minimum size, beyond which it can’t be reduced. Some details of how this works are operating-system-specific. In the Mac OS version, the Editor pane can be narrowed further after you’ve closed some of the open files, because the file tabs across the top of the Editor pane have a minimum width.
The panes can be turned into floating windows by clicking on the dual-window icon in the top bar of the pane. While floating, they can be docked back into the main window by double-clicking the title bar of the floating window or by dragging the floating window into position. The latter process may prove a bit finicky. (If the Inspector docks across the top of the main window rather than along the left edge, try narrowing its window while it’s floating, and then dock it.) Double-clicking the title bar is more reliable, at least in my Windows 7 system.
In the next few pages, we’ll look at each of these areas in turn.
Figure 5.4 The main window of CsoundQt, showing the Inspector pane (left), the Widgets pane (right), the Output Console (bottom), and the text editor (center). When Csound is running, it sends messages to the user, which appear in the Output Console. Widgets are user-defined interface items. The Inspector provides shortcuts for navigating through long files.
The Editor
CsoundQt’s Text Editor pane is not fancy, although it has one very cool feature—the Split View command in the View menu. (See below for more on this.) Numerous files can be open at the same time; their names will be displayed across the top of the editor in a multi-tabbed interface. Clicking on a tab will take you to that file. If the file has not been saved since your most recent editing, you’ll see a green button beside the filename.
The editor understands quite a bit about Csound code. It uses syntax highlighting (colored text) to indicate what type of Csound element you’ve just typed. This can be quite useful. Opcodes appear in blue, comments in light green italic, audio variable names in heavy (boldface) green, p-field variable names in heavy black, reserved words such as ksmps in dark red, double-quoted strings in lighter red, light gray for unrecognized elements, and so forth.
At present, the choice of syntax colors is not user-configurable, but I’ve found the built-in system easy to read. You can, however, change the font and size of the text in the editor window, using the Editor pane in the Configuration box.
CsoundQt gets its information about which words are opcodes by consulting the installed copy of the manual. In extremely rare cases, an opcode might be undocumented. In that case, it may run properly, but CsoundQt may fail to display its name in blue.
To close one of the open files, select it by clicking its tab at the top of the Editor pane and then click the red X button in the upper-right corner of the pane. In the Windows version, file tabs display the complete name of the file, and more files can be open than there is room for on the row of tabs. In this situation, left and right scroll arrows will appear to the left of the red X button, so that you can navigate to tabs that are not visible. The Macintosh version lacks this functionality: On the Mac, file tabs have a fixed minimum width and can’t be hidden. If you open more files than there is room for in the Editor pane, CsoundQt’s main window will widen to accommodate the tabs. On my MacBook Pro laptop, it’s practical to keep about a dozen files open at any given time.
The width of the text tab character (not to be confused with file tabs) can be set in the Editor tab of the Configuration box. The number doesn’t correspond to the number of fixed-width characters in the indent; it seems to be a value in pixels. Using Tabs will help keep your code readable; it’s highly recommended.
In this area of Configurations, you can also switch auto-wrapping on or off by checking or unchecking the Wrap Lines box. Auto-wrapping of long lines is for display purposes only and will have no effect on how Csound interprets your code. If auto-wrapping is switched off, when your code contains a line that is too long for the display area you’ll see a scrollbar at the bottom of the Editor window. Auto-wrapping can make code with lots of long lines harder to read, but if you only have a few long lines, it’s convenient.
The Editor pane can be split into Orchestra and Score panes using the Split View command in the View Menu. The score will then be displayed in spreadsheet form. You’ll probably find this display very useful, especially with larger scores. The p-fields will automatically be aligned, and you can move the input cursor among them using the arrow keys or the Tab key. In addition, the right-click menu used in the Live Events implementation is available for making quick edits of the p-fields. For more, see “Live Events,” later in this chapter.
Syntax Hints and Accessing Opcode Help
When you put the text cursor on the same line as an opcode, the prototype of the opcode will be displayed along the bottom of the main window. If you need more help, press Shift+F1 (function key 1, at the top of your QWERTY keyboard). This will open the Manual pane on the right side of the main window, with the page for that opcode displayed. For more information, see “The Help Menu,” earlier in this chapter, and “The Manual Pane,” later in this chapter.
![]()
Caution In Windows systems, you may find that the standard Cut, Copy, and Paste commands don’t work in the CsoundQt editor. This problem, which should be resolved in the 0.7 release, is due to a conflict caused by three files in the plugins64 directory. If you encounter this problem, find the plugins64 directory in the directory where you’ve installed Csound and remove the following three files: fluidOpcodes.dll, virtual.dll, and widgets.dll. (You may want to save them to a separate directory that you might name “removed plugins”.) Once they’re gone, launch CsoundQt, and you should find that Cut, Copy, and Paste work normally.
The Inspector
As your .csd files grow longer, you’ll find the Inspector extremely useful for navigating quickly through the text in the Editor pane. The information in the Inspector is assembled on the fly by CsoundQt.
Clicking on a visible item in the Inspector causes the Editor to jump up or down so that that line is at the top of the visible area.
The main headings used by the Inspector are Opcodes, Macros, Instruments, F-tables, and Score. When there are sub-items to be displayed in any of these categories, they can be shown or hidden by clicking the gray triangles along the left edge. The Inspector operates, in other words, rather like a standard file browser.
Certain items will be displayed automatically. If your file contains any user-defined opcodes, they’ll show up under Opcodes, because CsoundQt sees the opcode opcode and grabs that line of text to put into the Inspector. Likewise any line of text that begins with instr. The F-tables display is a little slicker: It displays both f-tables created in the orchestra header using ftgen and f-tables created in the score using f-statements.
In addition, the Inspector looks for lines that begin with two semicolons. Only one semicolon is needed to set off a comment, but if you use two, the Inspector will understand that this comment is a tag that you would like to be able to navigate to. For instance, in an instrument, you might have comments like this:
  ;; first oscillator
  ;; second oscillator
  ;; filter envelopes
The Inspector will place a gray open/close triangle next to the instrument line so that you can find these tags or hide them.
The Output Console
When Csound is invoked and is running (or fails to run), its messages will appear in the Output Console, which can be displayed or hidden using the tool in the toolbar. The text generated by the printing opcodes, for example, will appear in this window.
If you’re new to Csound, you’ll find it useful to keep an eye on the output level data in the Output Console pane. Each time a new i-statement is encountered in the score or a real-time MIDI message starts a note, you’ll see the maximum output level for the preceding period of time. When Csound finishes playing and stops, you’ll see this line:
overall samples out of range: 0 0
These two numbers correspond to the left and right output channels. If either of them is greater than zero, some of your samples have clipped, so you’ll need to reduce the output level in some way. By scrolling back through the series of events and looking at their output values, you may be able to figure out which event or events caused the clipping.
When Csound can’t compile your file, you’ll see an error message. The line numbers pointed to by error messages in the Output Console generally fail to correspond to the text display in the main CsoundQt Editor pane. This is an area of the program that will probably be improved in the future. But the text of the error message will quote the offending line of code, so if you know what’s going on in your own code, you should be able to find the bug without too much effort.
Another useful aspect of Csound’s output text is the list of MIDI and audio ports. You don’t need this information as long as you’re using CsoundQt, because you can set the ports using the Configuration box. But if you want to run Csound directly from the terminal, you’ll need to know which values to set using the -i, -o, and -M command-line flags. The numbers you use will of course depend on your computer’s system devices, and you’ll find the list in the Output Console.
The Manual Pane
Pleasantly little needs to be said about the Manual pane. Like the other panes, it can be detached so that it will float on the screen. Assuming you’ve used the field in the Environment tab of the Configuration box to tell CsoundQt where to find the HTML version of the Csound manual, it will be displayed in the Manual pane. You can click the links in the manual to navigate through the pages. The link for the frames version doesn’t work in the Manual pane, however. The green arrow buttons at the top of the Manual pane can be used exactly like the back and forward buttons in your web browser.