
Chapter 12: Blue Team Tactics for the Red Team
As we discussed previously, pen testers are prime target for adversaries. Therefore, it's also good for us to know about defense techniques. This chapter will highlight and discuss popular blue team tooling that red teamers should be familiar with.
We will highlight the importance of centralized monitoring and offloading audit logs as soon as possible from the machine to other systems. There are some operating system features that can help with forwarding logs, but many blue teams leverage third-party solutions to tackle these challenges. A common problem is that a typical corporate infrastructure is rather diverse, consisting of a wide range of operating systems and versions, and third-party solutions provide a better abstraction layer. In this chapter, we will focus on some of these third-party tools and techniques.
These protection techniques can also be used by the red team to monitor and protect their own infrastructure, and of course knowing about these tools will help improve your red teaming skills as well.
After reading this chapter, you will have gained insights into why blue teams leverage centralized monitoring and how the red team can leverage these tools to protect their own attack fleet and pen testing assets. You will learn the basics of osquery and the Elasticsearch Stack, including Filebeat and Kibana.
The following topics will be covered in this chapter:
- Learning about centralized monitoring solutions and why red teamers should know about them
- Setting up and configuring osquery
- Learning how to use the osqueryi command-line utility to retrieve event data
- Understanding the basics of Elasticsearch and Kibana to maintain insights on machines
I always found it useful to learn about monitoring tools and techniques to improve my red teaming skills, and this chapter should inspire you, as a red teamer to do the same.
Understanding centralized monitoring solutions that blue teams leverage
In the previous chapters, we discussed some useful techniques and ideas for event auditing and how to leverage built-in operating features to gain better insights into what happens on a host. So far, most of the monitoring, alerting, and notification mechanisms we've discussed originated from the monitored machine itself; for instance, we implemented desktop notifications when someone would log on to the machine.
Guerilla style and ad-hoc monitoring, as discussed previously, fit a red team and it is good to leverage such techniques. However, to have better insights at scale and make sure logs are accessible at a later point for forensic investigations, an important part of a good monitoring strategy is to offload audit logs as soon as possible from a machine to another system. Once central logs are in place, monitoring and notifications can be implemented from the central system too.
There is a wide range of open source as well as commercial tools available and commonly, there is a mix of these in play. Many blue teams also build custom tooling that's specific to their organization. This chapter is here to get you started with this.
The tools that we will discuss are likely leveraged by your blue team. There are two reasons to learn about these tools:
- The first reason is to leverage them for protecting the red team attack fleet. Pen test teams typically run their own labs or infrastructure to store sensitive source code, credentials, and findings, as well as to archive overall security collateral. Protecting and monitoring these assets has to be a part of the overall strategy to ensure that the information is locked down and secured.
- The second reason red teamers should know about blue team tooling is to better evade detections and monitoring solutions so that detections can be improved to catch real adversaries. By learning about blue team tooling, you will learn which processes to look for to know what kind of monitoring is in place. This allows pen testers to build better strategies to stay under the radar during red team operations and, overall, improve their understanding of the drawbacks and limitations of monitoring solutions. That, again, will help the blue team and tooling to get better over time.
In this chapter, we will stay pretty basic overall. However, if these topics spark your interest, I encourage you to also take a look at RedELK (https://github.com/outflanknl/RedELK), as well as the threat hunting toolset HELK (https://github.com/Cyb3rWard0g/HELK).
So, without further ado, let's dive into some of the most popular monitoring solutions and learn about some of the basics regarding how to use them. We will start with osquery, which was created by Facebook.
Using osquery to gain insights and protect pen testing assets
A popular infrastructure for providing insights into a heterogeneous set of machines is osquery. It provides agents for all major operating systems. The best part is that it exposes operating system information via a SQL interface. osquery was created by Facebook and is open source. The GitHub repository for osquery is located here: https://github.com/osquery/.
What better way to understand and learn more about defense strategies than to start using some of the tools that our blue team friends also use? And who knows, you might find some issues or common configuration issues that help you during your operations. You will likely also realize that if you ever find osquery on a host during pen testing, it can be leveraged for quick reconnaissance as well.
Let's walk through configuring and running osquery on Ubuntu.
Installing osquery on Ubuntu
The osquery installation instructions for various platforms can be found at https://osquery.io/downloads/official/. For Ubuntu/Debian, make sure to add the osquery.io repository, as highlighted in the instructions on the website. There are basically two options to get started:
- The first one is to just download the .deb file from the osquery website and install it using dpkg. The following screenshot shows the download page:
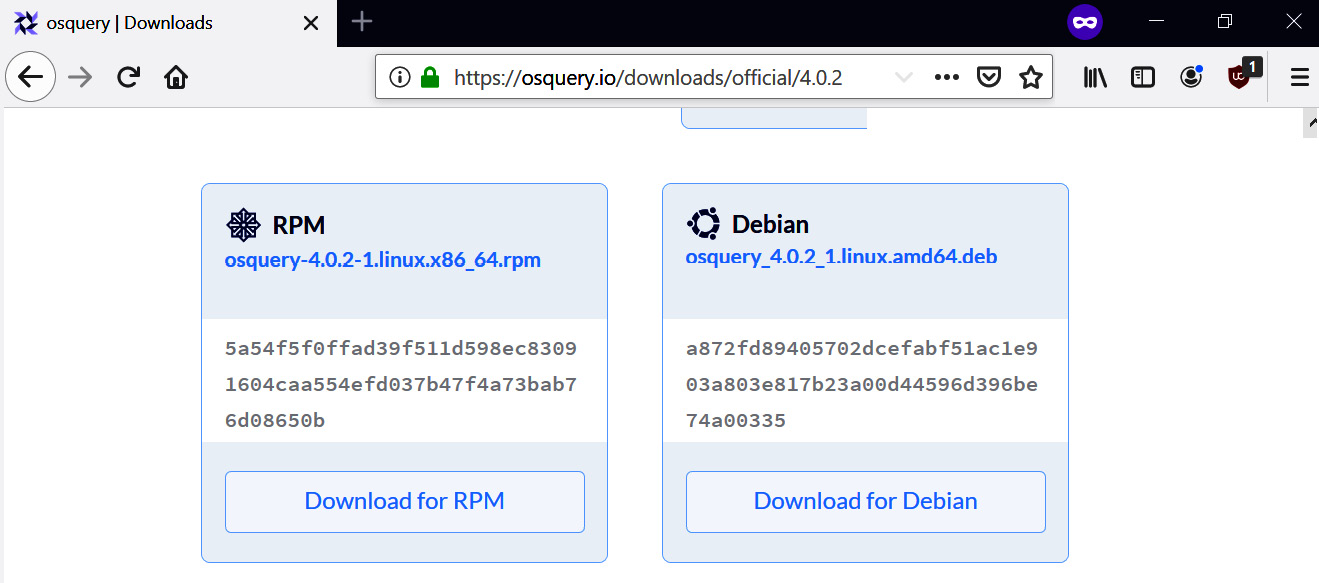
Figure 12.1: Downloading osquery
The preceding screenshot shows the download page. Go ahead and download the package and run sha256sum osquery_4.0.2_1.linux.amd64.deb to validate whether the hash matches the one from the website. Then, install the package by using the following command:
$ sudo dpkg -i osquery_4.0.2_1.linux.amd64.deb
- An alternate option is to add the osquery repository to apt using the following steps (taken from the osquery website at https://osquery.io/downloads/official/):
$ export OSQUERY_KEY=1484120AC4E9F8A1A577AEEE97A80C63C9D8B80B
$ sudo apt-key adv --keyserver keyserver.ubuntu.com --recv-keys $OSQUERY_KEY
$ sudo add-apt-repository 'deb [arch=amd64] https://pkg.osquery.io/deb deb main'
$ sudo apt-get update
$ sudo apt-get install osquery
The following screenshot shows the installation process after using this method:
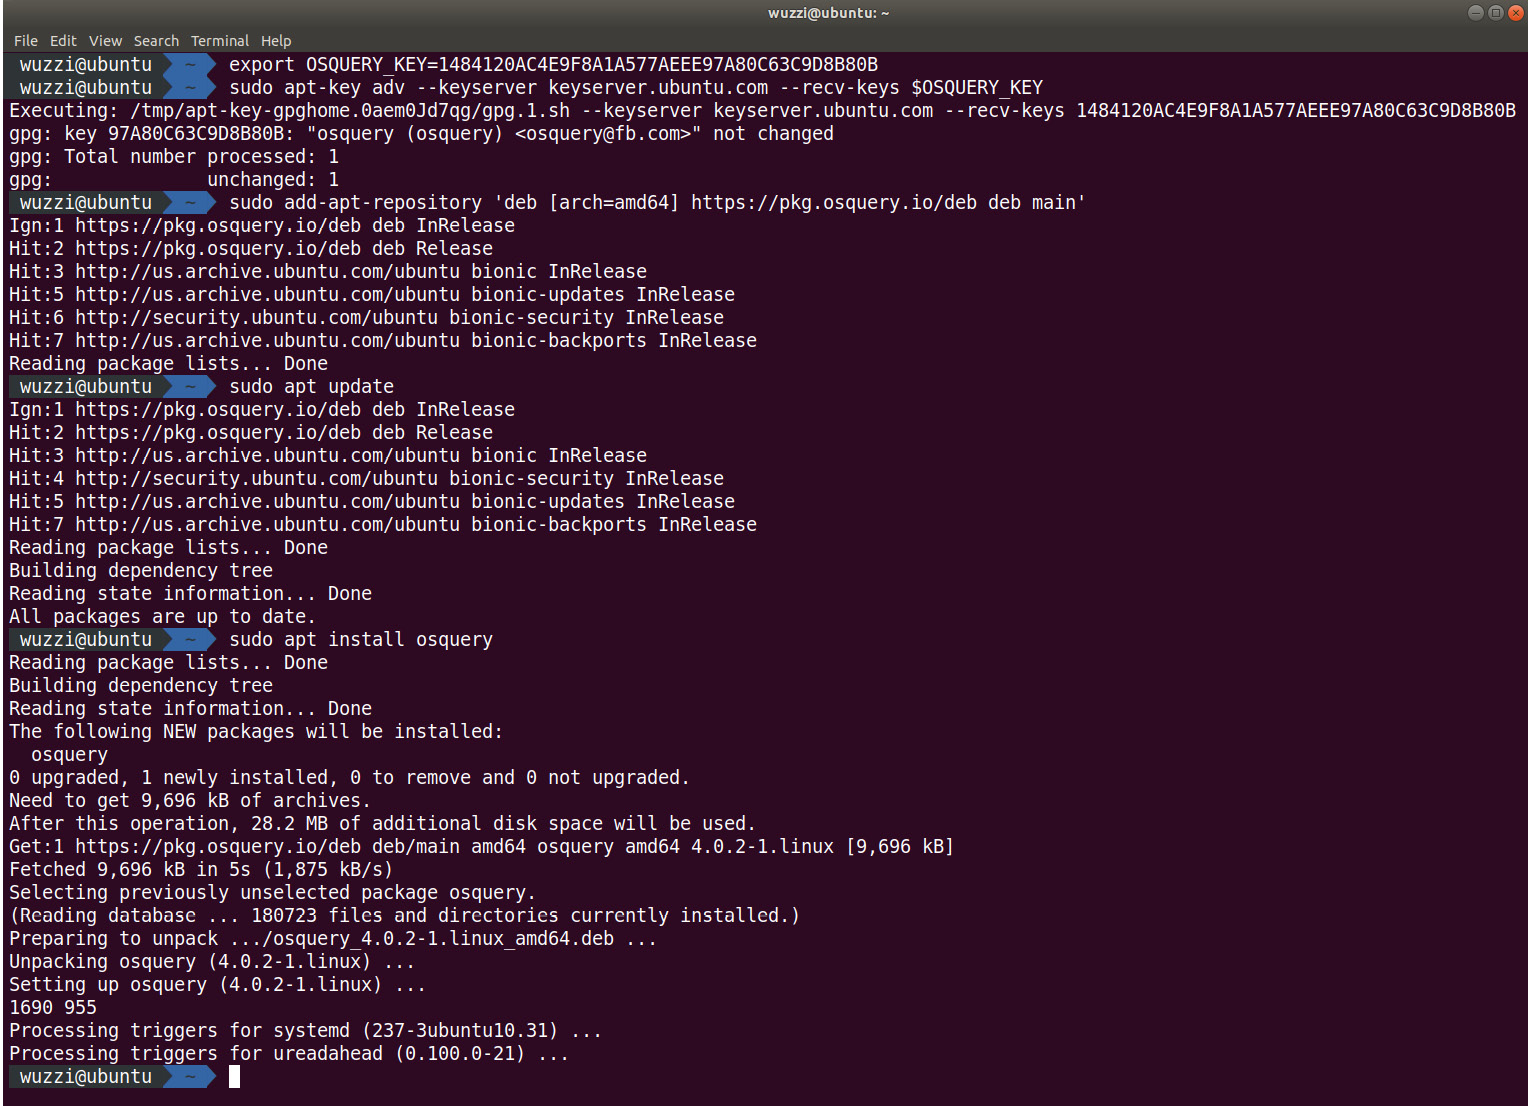
Figure 12.2: Installing osquery according to the instructions at osquery.io/downloads/official
The preceding screenshot shows the installation flow of osquery on Ubuntu after adding the proper osuqery.io deb repository and running apt install osquery afterward.
Now that the installation is complete, we are ready to explore osquery.
Understanding the basics of osquery
osquery can be run interactively by using osqueryi, as well as by using a service named osqueryd. Let's explore them. We'll start with the interactive experience first.
Using osquery interactively
Using the osqueri utility, it is possible to issue interactive queries via the command line. The following screenshot shows how to launch the interactive query interface and run a simple select statement to retrieve the hostname:
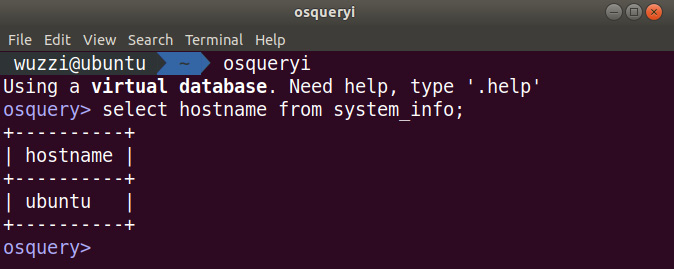
Figure 12.3: Querying information using the interactive osquery interface
The preceding screenshot shows how to run a select query. Knowing about osquery and how to query can also be useful during the reconnaissance phase when red teaming. Feel free to explore the various tables, including users and groups. Execute queries such as .tables or .schema to get a better understanding of what tables the system exposes.
Here are a few interesting queries to help you get started:
select * from logged_in_users;
select * from processes;
select * from suid_bin;
select * from last;
select * from shell_history;
select * from shell_history h where h.uid in (select uid from users);
There is a lot of useful information available. As you can see, we can query information about who has logged in, what processes are running, as well as the shell_history and what commands were run. Spend some time exploring the various tables. Make sure to run the last statement as a superuser (it will show the shell_history of all users).
Important Note
Notice how this information can also be used to perform reconnaissance during pen testing. If your organization uses osquery to collect information from hosts, it also enables an attacker who compromises a machine to quickly run queries to gain insights. A good example might be to query the shell_history table for clear text secrets by using a where clause. This technique may, in fact, bypass detections that are in place for ~/.bash_history file access.
Since the exposed interface is SQL, you can join tables. For instance, the following query will gather all the processes and show what usernames launched them. This is done by joining the processes and users tables via the uid column:
select u.username, p.name, p.path, p.pid from processes as p inner join users as u on p.uid = u.uid order by u.username, p.pid;
The following screenshot shows what this looks like when executed with osqueryi:
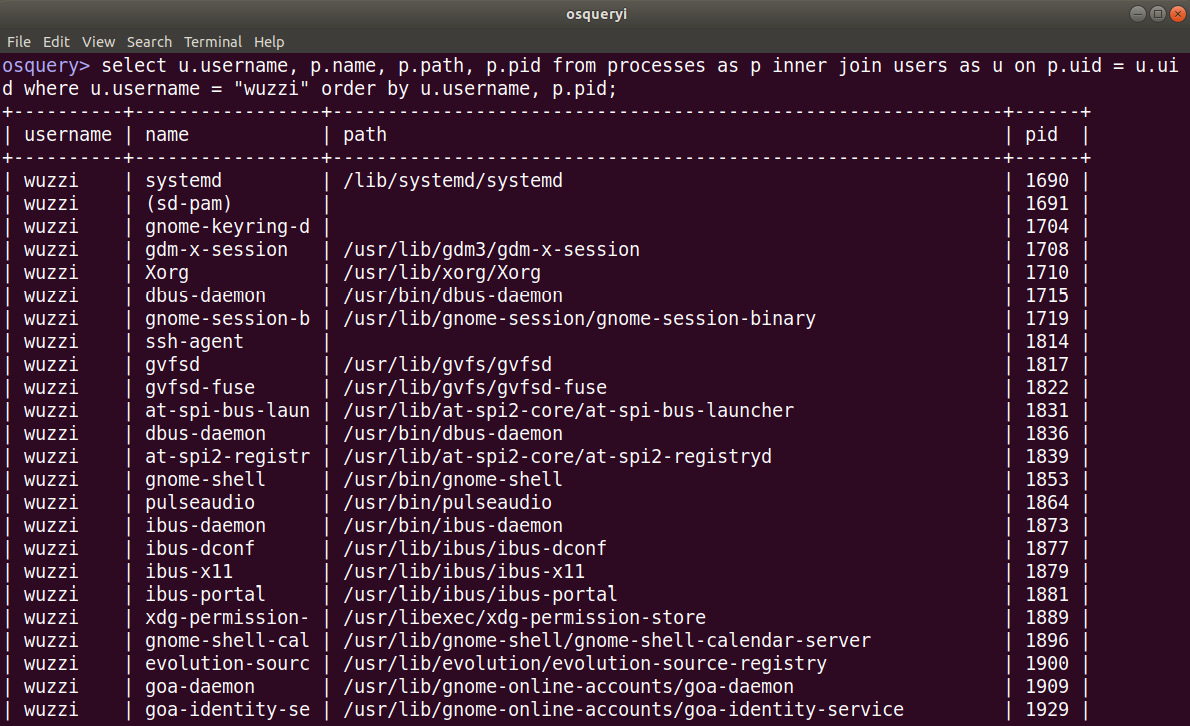
Figure 12.4: Running more advanced queries
The preceding screenshot shows how to query for processes and join them with the users table. So far, we've performed ad hoc queries. osquery also allows us to run queries in an automated and repeated fashion using the osquery daemon.
Understanding and leveraging the osquery daemon
As we mentioned previously, osquery also offers a service/daemon that can be configured using so-called query packs. The daemon will run queries regularly and keep track of any differences that might occur.
Let's set up the osquery daemon to explore it in more detail. To set up the osquery daemon, copy the example configuration file that ships with osquery to /etc/osquery/osquery.conf, as seen in the following command:
$ sudo cp /usr/share/osquery/osquery.example.conf /etc/osquery/osquery.conf
The configuration file contains the detailed settings for osqueryd, including what queries to execute and how frequently those queries will be run.
As an example, let's extend the default configuration file to include a custom scheduled query for logged_in_users every 60 seconds. Let's get started:
- To do that, add the following snippet to the configuration file:
"logged_on_users": { "query": "select type, user, tty, host, time, pid from logged_in_users;", "interval": 60 }
To better understand where this snippet needs to be placed in the osquery configuration file, take a look at the following screenshot:
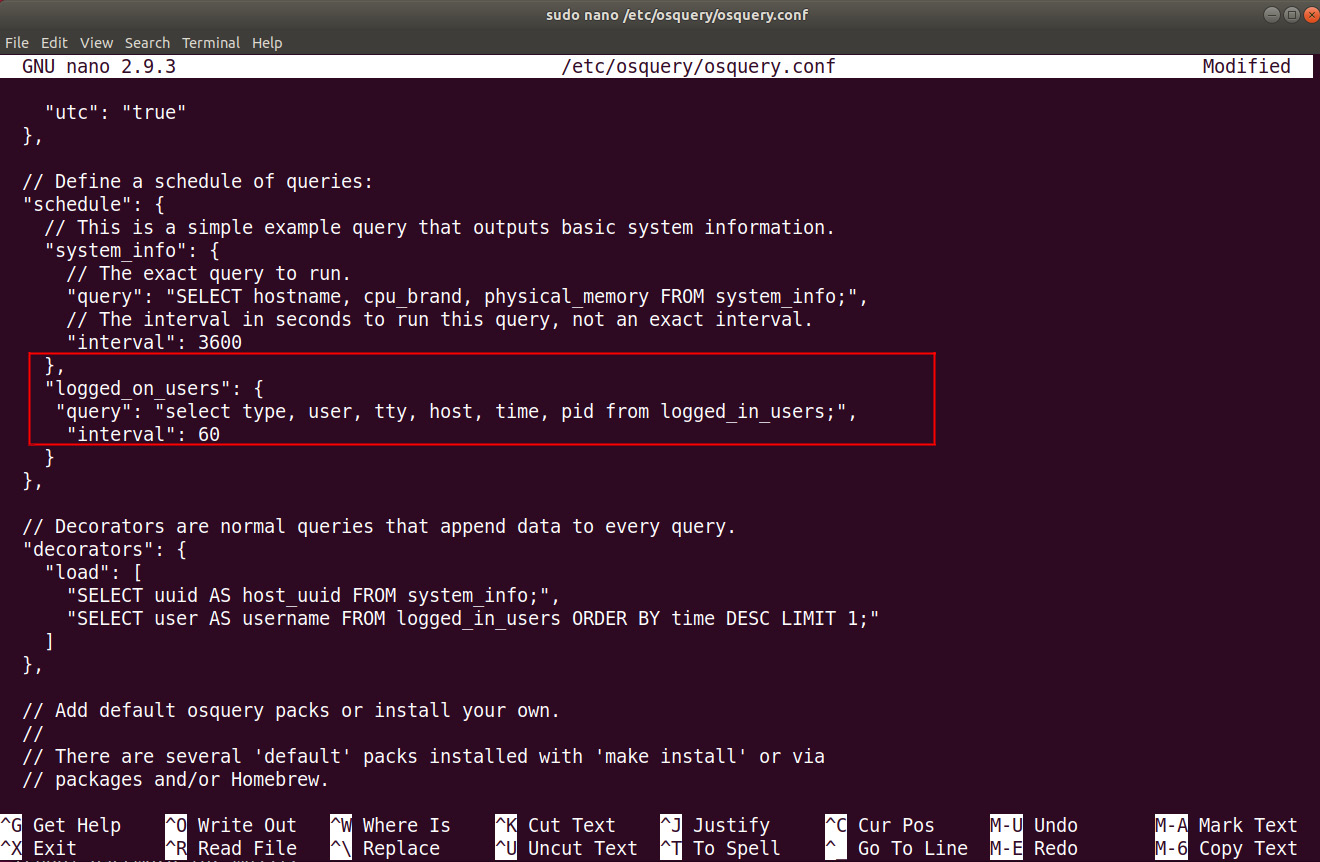
Figure 12.5: Adding a custom query for logged_on_users to the schedule
The preceding screenshot shows the modification that was made to the default osquery.conf configuration file so that it includes a custom scheduled query (named logged_on_users).
- After this, start the osqueryd daemon using the following command:
$ sudo osqueryctl start
- Now, go ahead and perform an SSH login using a different user to create some interesting data points to investigate and look at.
- To view the results of the scheduled queries, observe the osqueryd.results.log file:
$ sudo cat /var/log/osquery/osqueryd.results.log
After about 1 minute, a new log entry will appear, highlighting the added session. The following screenshot shows the log file after performing an SSH login to the machine:
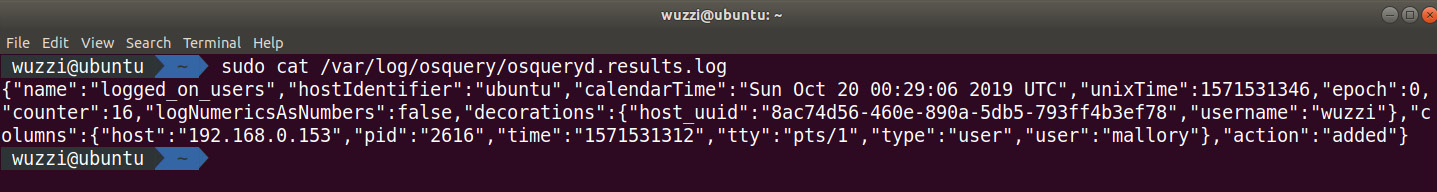
Figure 12.6: Reviewing the osqueryd log file
As we can see in the preceding screenshot, Mallory performed a logon from 192.168.0.153 and osquery captured that. This is a typical example of what scheduled queries can be leveraged for.
Important Note
Observing log files for new entries is best done using the tail command. For instance, in the preceding scenario, rather than running cat, we can use the following:
$ sudo tail -f /var/log/osquery/osqueryd.results.log
This will open the log file so that we can observe whether new lines were added. When a new line is added, then that newly added line is printed on the screen.
osquery ships with a set of default query packs that can be leveraged. The query packs that come with osquery contain a lot of useful queries, including looking for specific attack tactics, techniques, and procedures (TTPs). The following screenshot shows the default query packs:
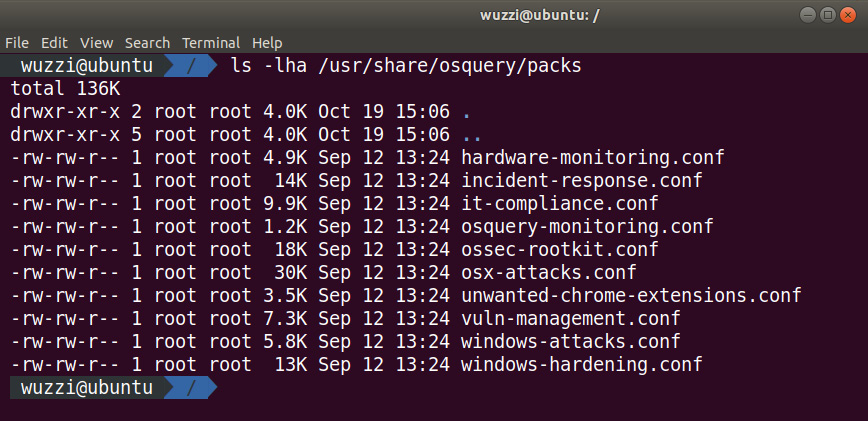
Figure 12.7: Out-of-the-box query packs that ship with osquery
The preceding screenshot shows the list of default query packs that can be used. The example configuration file that we copied over earlier already contains them. If you want to enable one of the query packs, just uncomment the query pack in the osquery.conf file.
So far, we've learned about basic queries and the query packs that ship by default with osquery. As this chapter's goal, let's implement monitoring so that we can monitor decoy files with osquery. This is what we will cover next.
Using osquery to monitor access to decoy files
One final feature to highlight and that fits the overall discussion of this chapter is file integrity and access monitoring using osquery.
In this case, we will again monitor access to the decoy prod_rsa key that we created earlier. To enable file monitoring, add the following lines to the osquery.conf configuration file:
- First, add an entry to collect file_events:
"file_events": {
"query": "SELECT * FROM file_events;",
"removed": false,
"interval": 60
}
- The second part that has to be added are which file paths to watch and which files we want to have access monitoring for. In this case, we want to watch the prod_rsa key file that we created in the previous section. Adding the following lines to the config file will accomplish that:
"file_paths": {
"sentinel_decoys": [
"/home/%/.ssh/prod_rsa"
]
},
"file_accesses": ["sentinel_decoys"],
Note
Be careful when updating the config files and ensure you add commas at the correct locations. Use the following screenshot as a reference if you are unsure.
The following screenshot shows the osquery.conf file with the snippets added at the appropriate location:

Figure 12.8: Modifying the configuration file to monitor access to the decoy file
The preceding screenshot shows the entirety of the parts that need to be inserted into the osquery.conf file.
- Once the file looks correct, save it.
- Then, launch osqueryd using sudo osqueryctl start.
- Set up tail for the osqueryd.results.log file using the following command:
$ sudo tail -f /var/log/osquery/osqueryd.results.log
- After this, go ahead and access the decoy file using a tool such as cat, or a text editor.
- Wait a few seconds. You should see the osquery log receiving the events. The following screenshot shows the lines that are added to the osquery results log file when the file is accessed:

Figure 12.9: File access monitoring using osquery
The preceding screenshot shows that the osquery daemon log file contains the file access information, which command is triggered in the event, as well as the user's session. In this case, we can see that Mallory accessed the decoy rsa key file in Alice's home folder. Pretty neat.
One thing you probably noticed is that the osqueryd.results.log file is in JSON format, but the output is very difficult to parse, as can be seen in the preceding screenshot.
There is a handy tool called jq that can be used to format and query JSON files:
$ sudo apt install jq
After this, we are ready to leverage jq and have the log results be shown in a more human-readable form. The following screenshot highlights this:

Figure 12.10: Using jq to nicely format the json output of osqueryd
The preceding screenshot shows how to pipe the contents of the osquerylogfile (which is in JSON format) to the jq command, which will print the contents of the logfile in a better human-readable form.
In this section, we learned about osquery, which is an endpoint insights tool from Facebook. We covered how to set it up, as well as how to query tables and create scheduled queries to collect information regularly. Finally, we looked at file integrity and access monitoring and how osquery supports such scenarios. We created access monitoring for the decoy file that we created earlier in this chapter.
The following, final, section will go through how this information can be offloaded to a central monitoring solution. In this case, we will ship the osquery logs to Elasticsearch and leverage Kibana for visualization and analysis.
Leveraging Filebeat, Elasticsearch, and Kibana
An effective way to gain insights around infrastructure at scale is by deploying osquery, and then forwarding the logs to Elasticsearch or Splunk to gain central insights. If you have never been exposed to the Elasticsearch Stack, there are a few key components to be aware of:
- Logstash: A utility running on a host to forward logs to an Elasticsearch cluster.
- Beats: Similar to Logstash, Beats help send data to Elasticsearch. Beats are lightweight and target specific use cases, such as Filebeat and Auditbeat.
- Elasticsearch: This is the data storage and search technology in the stack.
- Kibana: Kibana is the data analysis and visualization component that aids in presenting and exploring information.
This section is intended as an introduction for red teamers to learn about the centralized monitoring solutions and infrastructure that blue teams use, and how it can be used by red teams as well. We will look at Filebeat and Elasticsearch and use Kibana for visualization. Sometimes, this tech stack is referred to as Elastic, Logstash, Kibana (ELK)—in case you've never heard of this.
Using Docker images is the quickest way to start learning about the Elastic Stack and how it can be used to monitor machines. Red teamers will also be able to ideate how to attack or even leverage the blue team defense systems to their own advantage during operations.
The following screenshot shows what we are going to set up in this section:

Figure 12.11: Performing centralized log analysis (including osquery information) using Kibana
The preceding Kibana screenshot shows the basic security dashboard. Let's look at the Elastic Stack in more detail and how to set it up to process and visualize log information.
Running Elasticsearch using Docker
Running Elasticsearch using Docker is the best way to learn and explore the technology and its features. Elastic hosts Docker images for Elasticsearch, Kibana, Filebeat, Logstash, and more. The various Docker images are located at https://www.docker.elastic.co/, and there is some useful documentation available at https://www.elastic.co/guide/en/elasticsearch/reference/current/docker.html.
Information Note
Review the Docker website as there are frequent updates for it and newer versions available.
We installed Docker in Chapter 7, Hunting for Credentials. Here is a quick refresher on how to set up Docker on Debian. Run the following commands:
$ sudo apt install docker.io
$ sudo usermod -a -G docker $USER
Make sure to add the current user to the Docker group; otherwise, there will be permission issues when running the command.
Information Note
The preceding installation instructions are the easiest on Ubuntu to get you started. You can find more information on the official Docker website and how to install and maintain it at https://docs.docker.com/install/linux/docker-ce/ubuntu/.
Also, after the group addition, log out and log back in. If there are still permission errors, reboot and see whether that resolves the problem.
After this, we are ready to pull the Elasticsearch Docker image and run it using the following steps:
- The following command will load the (at the time of writing) latest Elasticsearch Docker image:
$ docker pull docker.elastic.co/elasticsearch/elasticsearch:7.4.0
The following screenshot shows the command in action:
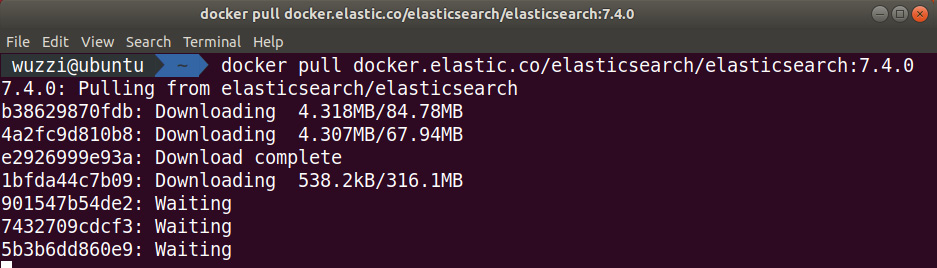
Figure 12.12: Downloading the Elasticsearch Docker image
The preceding screenshot shows the progress that can be seen during the download. Pulling the image might take a few moments.
- After this, the following command will run the Elasticsearch instance:
docker run -p 9200:9200 -p 9300:9300
-e "discovery.type=single-node"
docker.elastic.co/elasticsearch/elasticsearch:7.4.0
The following screenshot shows Elasticsearch startup in single-node developer mode:

Figure 12.13: Running Elasticsearch in developer mode
The preceding screenshot shows how quickly a working Elasticsearch instance can be set up using the Docker images provided by Elastic.
Important Note
This is a test configuration and is running insecurely (there is no authentication). So don't use this specific configuration in production.
If everything worked correctly, Elasticsearch will be accessible at localhost:9200, as can be seen in the following screenshot:

Figure 12.14: Navigating to port 9200 of the Elasticsearch instance
If you are unclear on what IP address Elastic is listening on, just run ip addr on Linux (or ifconfig on macOS) to identify the Docker-specific network interface and its IP address. If you are on the same machine, just use localhost:9200.
Information Note
Take note of the name of the cluster, that is, 7f0b0abe591c, as we will need that information to connect Kibana to the Elasticsearch instance.
That's it! Now, we have an Elasticsearch instance up and running for testing and using the Docker images from Elastic. Next, let's look at how to install Kibana and how to point it to the Elasticsearch instance.
Installing Kibana to analyze log files
Kibana is the data visualization component that is commonly leveraged by blue teams and threat hunters. To get Kibana up and running (by using Docker again), perform the following steps:
- Pull the Kibana image from the Elastic Docker Registry that matches the version number of Elasticsearch—in my case, that was version 7.4:
$ docker pull docker.elastic.co/kibana/kibana:7.4.0
The following screenshot shows the progress when running the Docker pull command:
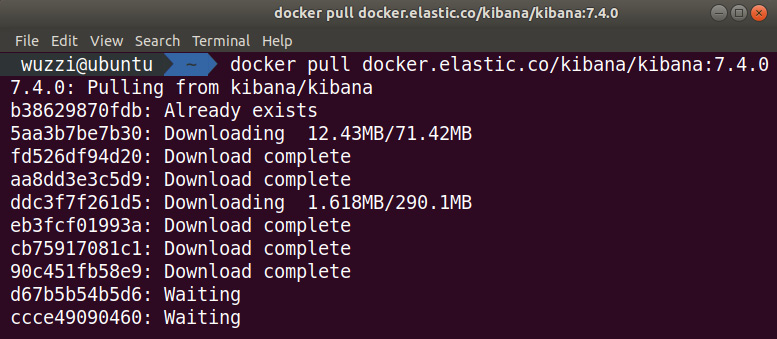
Figure 12.15: Downloading the Kibana Docker image from elastic.co
The preceding screenshot shows the docker pull of the Kibana image.
- After the download is completed, identify the name of the Elasticsearch cluster (remember the name value from installing Elasticsearch. In this case, the name is 7f0b0abe591c.). If you don't remember, navigate to the Elasticsearch instance at localhost:9200, which will show the instance name again.
- Then, run the Kibana container using the following statement (replace the highlighted identifier with the name of your Elasticsearch instance):
$ docker run --link 7f0b0abe591c:elasticsearch
-p 5601:5601 docker.elastic.co/kibana/kibana:7.4.0
The following screenshot shows the Docker container starting up Kibana:
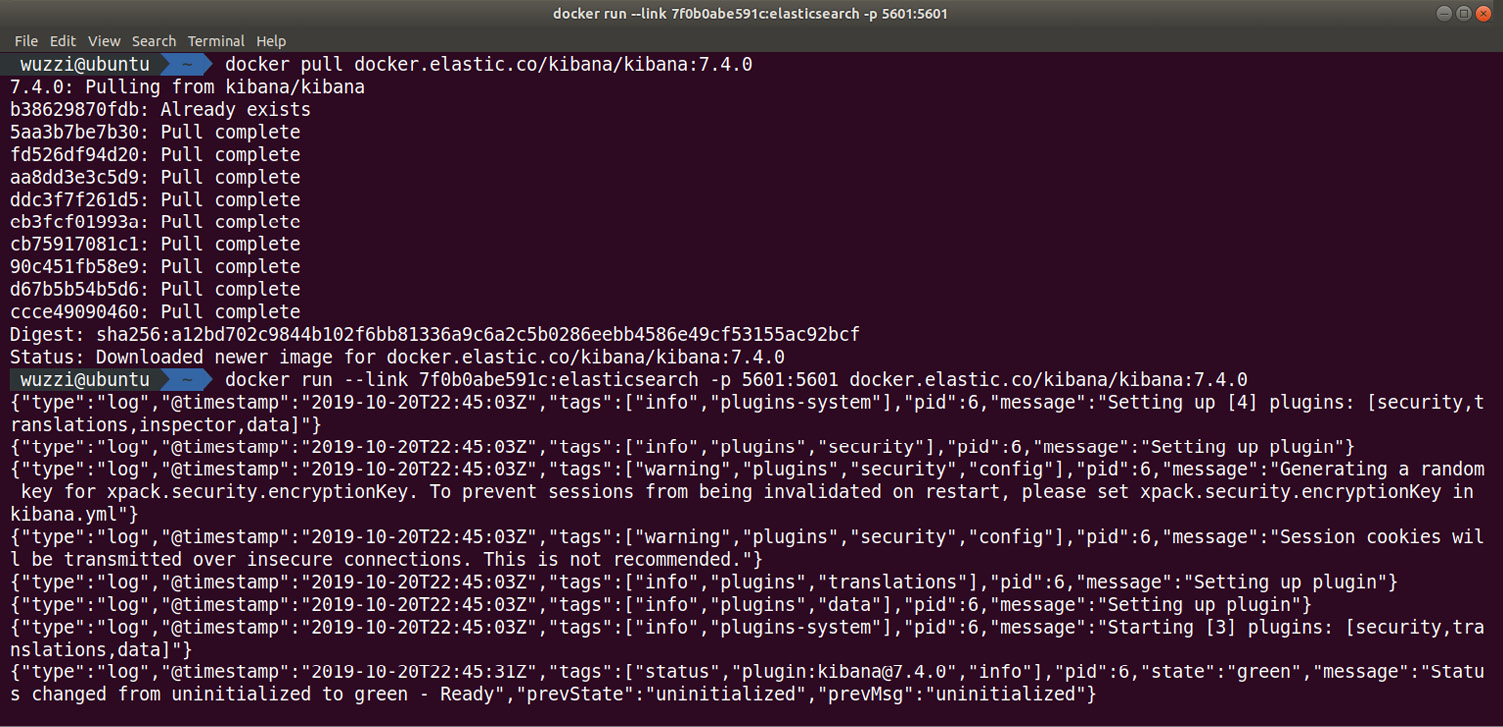
Figure 12.16: Running the Kibana Docker image
The preceding screenshot shows the download and launch of the Kibana Docker container that Elastic provides.
- After the container is up and running, navigate to localhost:5601 to experience the Kibana user interface. The following screenshot shows the browser experience:

Figure 12.17: Browsing the Kibana user interface
The preceding screenshot shows the Kibana user interface when starting it up. Explore the rich user interface to get a better idea of what capabilities Kibana offers.
Important Note
This is a test configuration and is running insecurely. Don't use this configuration in production.
Now that we have both Elasticsearch and Kibana up and running, it's time to go ahead and send some data to the stack.
Configuring Filebeat to send logs to Elasticsearch
In order to collect log files and send them to Elasticsearch, there are tools such as Logstash and the newer Beats components. Similar to Elasticsearch and Kibana, there are Docker images for various Beats available as well, but you can also directly download and install them quickly. The following steps show you how that can be done:
- To download Filebeat, make sure to pick the version that matches your Elasticsearch installation (in our case, it was 7.4.0):
$ wget https://artifacts.elastic.co/downloads/beats/filebeat/filebeat-7.4.0-amd64.deb
- After this, install the Filebeat package (again, make sure that it matches the same version as your Elasticsearch and Kibana installations):
$ sudo dpkg -i filebeat-7.4.0-amd64.deb
The following screenshot shows the installation of the package and identifying where Filebeat is located by running whereis filebeat:
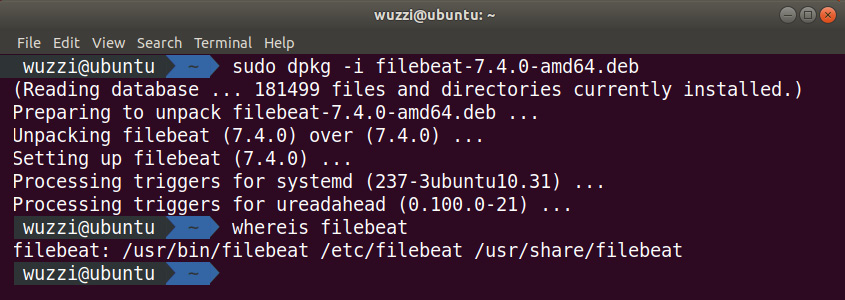
Figure 12.18: Installing Filebeat
The preceding screenshot shows the installation of Filebeat on Ubuntu.
- The next step is to configure Filebeat so that it can send logs to the Elasticsearch cluster. In order to do that, we have to update the Filebeat configuration file, which is located at /etc/filebeat/filebeat.yml. Use your favorite text editor to modify the file:
$ sudo nano /etc/filebeat/filebeat.yml
- The only change we are making is to enable uploading for the /var/log/*.log files. The following screenshot shows the filebeat.yml configuration file:

Figure 12.19: Enabling the Filebeat log collection and including osquery logs
- Filebeat comes with a set of modules, including one for osquery. To list all the available modules, run the following command:
$ sudo filebeat modules list
The preceding command lists the modules that are available.
- To enable the osquery module, run the following command:
$ sudo filebeat modules enable osquery
- Next, we create the necessary templates in Kibana for Filebeat. The following command will update Kibana with the default templates for Filebeat:
$ sudo filebeat setup
The following screenshot shows the Filebeat setup command being executed:
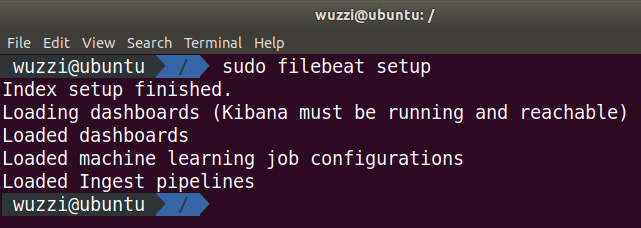
Figure 12.20: Setting up Filebeat
This will take a few moments. The output of the successful command can be seen in the preceding screenshot.
- Next, launch the Filebeat service using the following command:
$ sudo service filebeat start
- Now, data will start showing up in Kibana at http://localhost:5601.
- To create some interesting osquery events, access the decoy ssh key again that we set up for monitoring in osquery earlier.
The following screenshot shows how the raw logs are collected and accessible within Kibana:
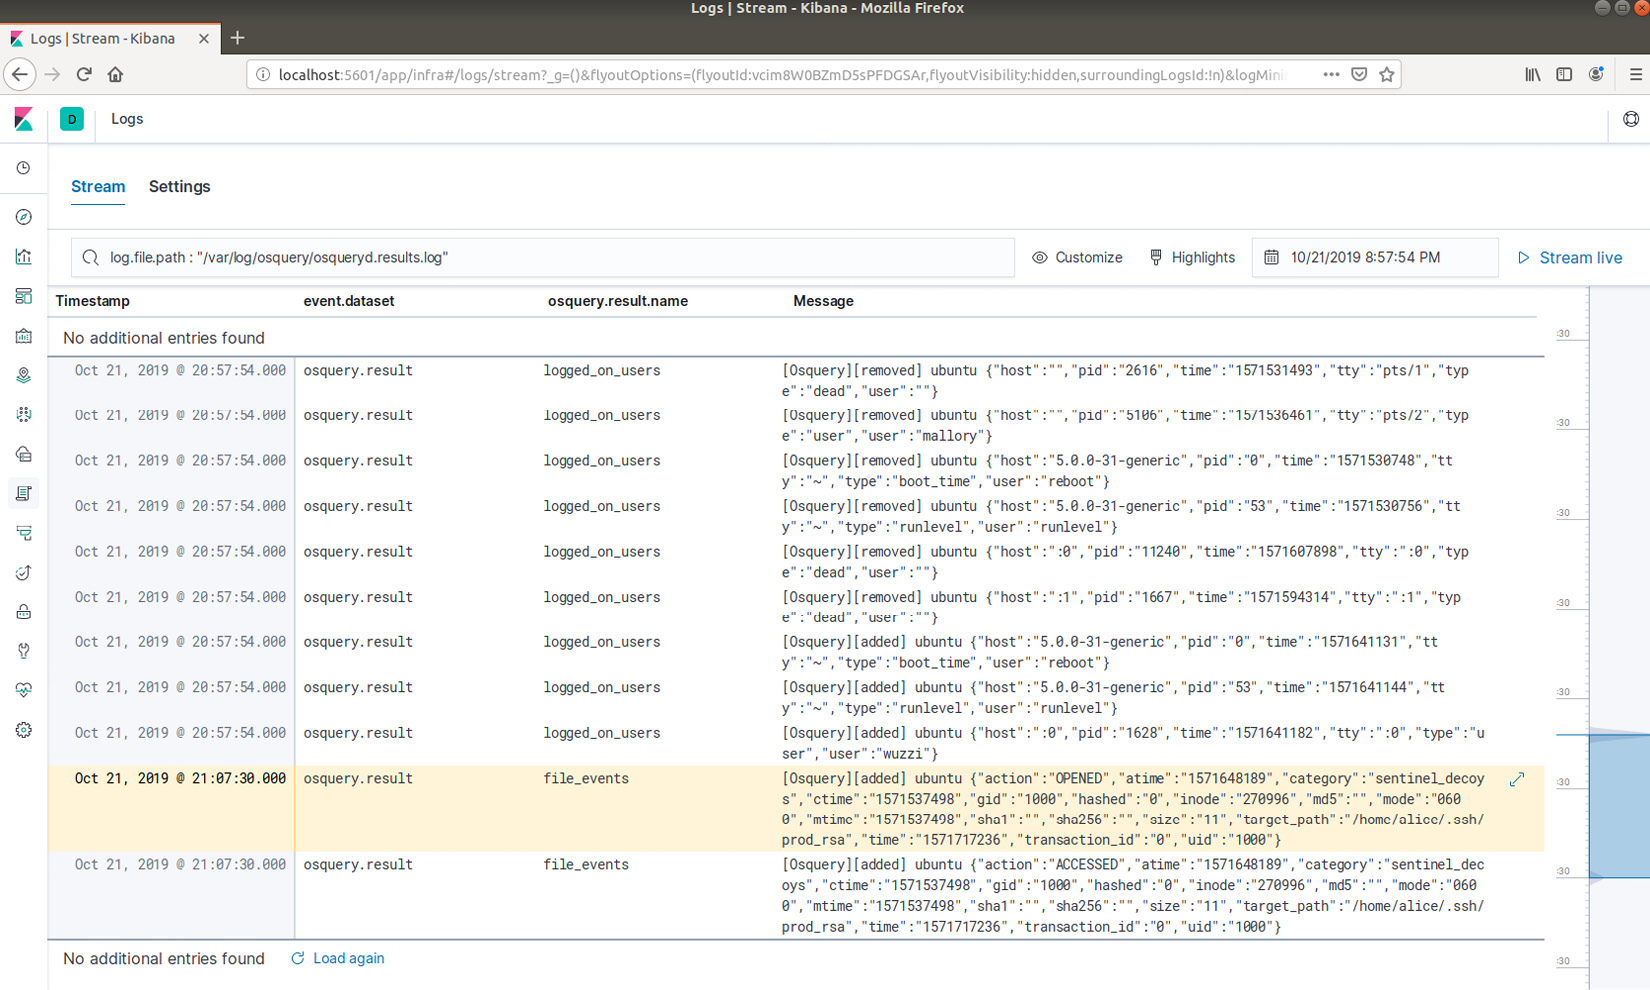
Figure 12.21: Viewing osquery log data (file monitoring query) in Kibana
The preceding screenshot highlights the file access monitoring log entry that was collected from osquery. There are a lot of powerful features in Kibana, and a lot of resources are available online so that you can learn more. There are also a lot of useful dashboards available as soon as you start loading data into the Elastic Stack.
For instance, the following screenshot shows parts of the SSH login attempts dashboard:
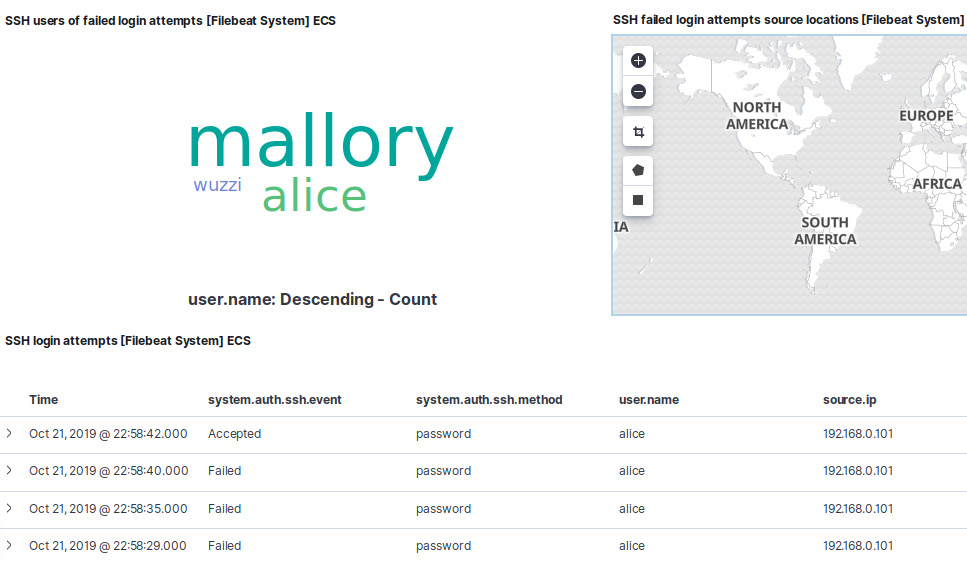
Figure 12.22: The built-in SSH login attempts dashboard
As you can see, on this dashboard, Mallory is quite active, and, in the bottom table, you can see that alice had a lot of failed login attempts but one succeeded in the end—maybe Alice's account was compromised? It's a good thing that we also know that the origin of the attack is 192.168.0.1. This can be seen in the source.ip column.
This was only a quick introduction to highlight the power of centralized monitoring, and how data visualization using tools such as Kibana can be helpful in providing insights.
Try setting up additional beats (for instance, Auditbeat) and add more machines to the fleet. If you are maintaining a large red team infrastructure, such tools can be quite useful for maintaining insights on what is happening, and, of course, to deploy and monitor access to honeypots as well.
Alerting using Watcher
It is worth highlighting that a threshold can be set up using the user interface to notify stakeholders regarding activities or anomalies across the fleet. Unfortunately, the alerting feature is currently not available in the free version of Kibana. However, you can leverage the 30-day trial if you want to check it out. You can enable it by clicking Management | License Management. After you've enabled the trial, there will be an entry called Watcher in the Management menu. It's possible to set up notifications via email, PagerDuty, Jira, Slack, and through many other mechanisms.
This was a brief detour into the world of centralized monitoring in order to shine more light on the tactics that blue teams leverage, and how this can help us gain insights into a fleet of machines. This wraps up this final chapter. I hope you enjoyed learning a bit more about blue teaming tooling and got some ideas on how to leverage it as well.
Summary
In this chapter, we covered popular blue teaming tooling and how to set up and configure it. We explored osquery as a tool to provide insights to hosts by using SQL queries and how to schedule queries so that they run in regular intervals in order to understand changes that occur to hosts over time.
After this, we looked at centralized monitoring solutions. Specifically, we investigated setting up an Elasticsearch development environment. We did a walkthrough on how to set up Elasticsearch and Kibana with the goal of monitoring access to a decoy file. Afterward, we installed and configured Filebeat to load osquery information into Elasticsearch.
If these topics sparked your interest, take a look at RedELK (https://github.com/outflanknl/RedELK), as well as the threat hunting toolset, HELK (https://github.com/Cyb3rWard0g/HELK).
Hopefully, this brief tour into blue team and threat hunting tooling was useful and provided you with more ideas on what to use for red teaming, both for defending your pen test assets as well as improving your red teaming skills, so that you can come up with techniques to stay under the radar or circumvent or leverage monitoring to your advantage.
Questions
- Can osquery be used to perform file access monitoring?
- Write a query that lists the bash history in the interactive osquery tool.
- Put your red teaming hat on: what processes might be running on a machine that might catch your activity?
- What does ELK stand for?