Case Study: Estimating Decision Equity Relative to Other Options
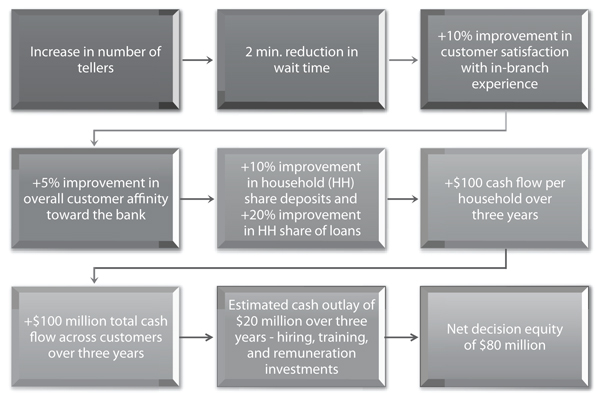
A retail bank had undertaken an initiative to improve the quality of its in-branch transactions. In an environment where other banks were encouraging their customers to stay away from the branch and use web-based and automated teller machine–based services, this organization decided to invest in providing top-notch experiences to customers that visited its branches. The location and demographic mix of its customer base justified such thinking. To provide such quality transactions, an option that was under serious consideration was the increase in the number of tellers in targeted branches during peak traffic hours in order to minimize the wait time for the customers. As shown in Figure 8.2, the increased number of tellers was estimated to reduce the average wait time for customers in these branches by about 2 minutes, which, based on an earlier model, was expected to increase customer satisfaction with the in-branch experience by an average of 10%. Improved transactional satisfaction, in turn, had been modeled to provide a series of downstream benefits—more favorable overall customer affinity toward the bank (+5%), ability to lock in greater share of deposits (+10%) and loans (+20%) from each household, and a consequent increase in cash flow per household ($100).1 Across all the households that were retail customers of these branches of the bank, the discounted value of the net increase in cash flows over 3 years was projected to be to the tune of $100 million. The bank also estimated a cash outlay of about $20 million for the hiring, training, and remuneration of the additional tellers over the same time period, resulting in a net incremental cash flow of $80 million.
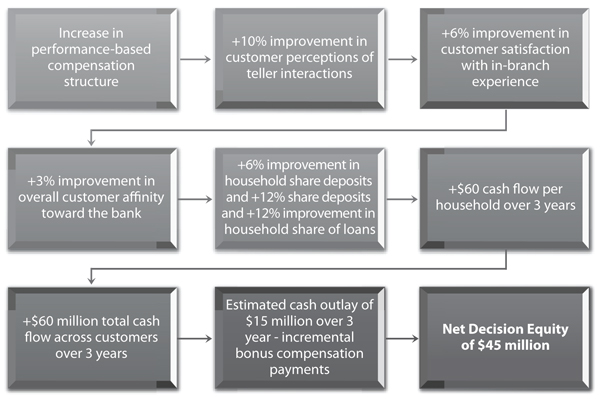
Around the time this decision was ready to be implemented, another stream of internal research pointed to an alternative strategy. Specifically, it pointed out that an increase in the performance-based compensation structure of the existing tellers would lead to a similar chain of effects or flowprint (Figure 8.2). The structure of such compensation change would motivate the employees to be more customer centric in their interactions with the customers, leading to a 10% improvement in customer perceptions of teller interactions and a 6% improvement in satisfaction with their overall in-branch experience. The increased satisfaction, in turn, would lead to about a 3% improvement in overall customer affinity toward the bank. The subsequent downstream impacts of such improvement in affinity would be similar—greater share of loans (+6%) and deposits (+12%), incremental cash flow per household (+$60), totaling up to an incremental cash flow of $60 million across the customer base over 3 years. The cash outlay associated with the change in compensation structure was estimated to be $15 million, generating a net decision equity of approximately $45 million.

Option 2. Changing the compensation structure.

Option 1. Increasing the number of tellers.
Figure 8.2. Case study: Estimating decision equity relative to other options.
As the decision makers evaluated the two options, they were able to account for the cash flows and decision equities for both on a common metric and time frame. There was some trepidation around a permanent increase in the number of employees on the payroll, vis-à-vis a more flexible compensation structure change for the current employees. Ultimately, the executives favored the first option and accepted it for implementation.
From an organizational learning perspective, the decision makers acquired knowledge about four important issues during this process. One, the flowprint exercise helped them link various moving parts of the overall customer experience that had till then been studied only within individual silos. For example, the exercise helped them recognize the linkages among employee compensation and engagement, length of in-branch wait time, quality of in-branch customer experience, overall affinity toward the bank, share of loans and deposits, and incremental cash flows. Until then, each of these measures was studied in isolation, without recognizing how they are all connected in a web of close relationships. Two, developing this big picture helped them gather a strategic perspective of their business, and of the linkages among various metrics. Now for instance, they could quantify the benefit of an increase in employee engagement in dollars and cents, instead of simply tracking it as a standalone metric and feeling good about it moving northward. The human resource team could now go to management and make a business case for employee-centric investments. Three, the decision makers were able to compare two very different decisions, that were each designed to provide the same ultimate outcome, on a common metric. In the absence of the decision equity approach, these two decisions were non comparable, and management might have acted on their intuition in selecting one over the other. Finally, the learning set a great precedent for future decision making. Management could now share a case study with functional heads, to showcase the process they should undertake to justify their resource needs by linking functional decisions to the organizational bottom line. It also encouraged functional managers to appreciate the linkages among cross-functional intermediate markers, and recognize that an upward change in these markers—including their own functional metrics—was useful only as far as its ability to link to the final desired measure of financial success.
