
Reliability Design Tools
Introduction
The importance of designing reliability into a product was the focus of Chapter 1. As technology continues to advance, products continue to increase in complexity. Their ability to perform when needed and to last longer are becoming increasingly important. Similarly, it is becoming more and more critical to be able to predict failure occurrences for today's products more effectively and more thoroughly. This means that reliability engineers must be increasingly effective at understanding what is at stake, assessing reliability, and assuring that product reliability maturity is at the level required. To assure this effectiveness, tools have been developed in the reliability engineering discipline. This chapter is a summary of such tools that exist in all aspects of a product's life: from invention, design, production, and testing, to its use and end of life.
The automation of reliability methods into tools is important for the repeatability of the process and results, for value-added benefits in terms of cost savings during the application of design analysis methods, and for achieving desired results faster, improving design cycle times. As design processes evolve, the tools should evolve. Innovation in the current electrical and mechanical design tool suite should include interfacing to the current design reliability tool suite.
Reliability Tools in the Life Cycles of Products
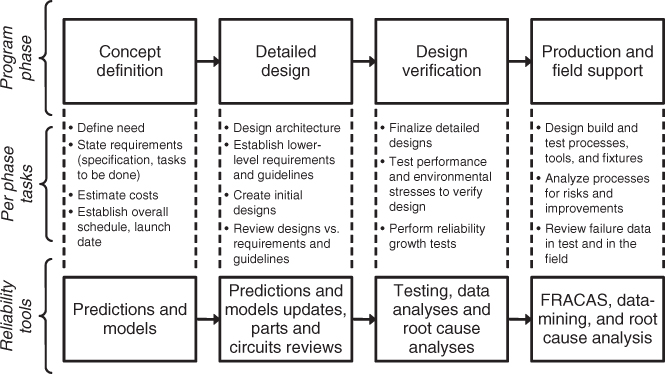
One important thing about reliability engineering as a discipline is that it is involved in all parts of a product's life: from product inception, its manufacture and use, to its end of life. This is because reliability is an intrinsic part of a product's essence, whether it is a “throwaway” coffee cup or a sophisticated spacecraft intended to last 10 years in outer space. As an intrinsic parameter, it must be taken into account in the definition, design, building, test, and use (and abuse) of the product. For each program phase, tools have been devised to enable engineers to gain insight into the requirements and status of reliability. Figure 1 provides a generalized flow, representing any product's life cycle and how reliability mirrors those phases throughout a development program. Figure 2 notes key activities and events throughout a product's life cycle.
Figure 1 Reliability involvement in program and product life.
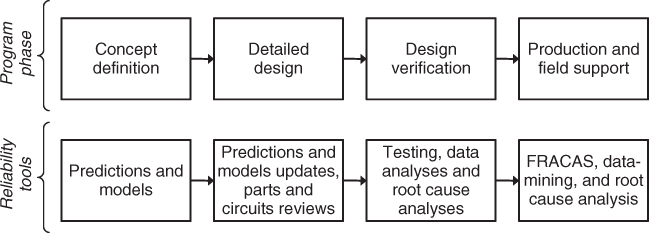
Figure 2 Program and product life tasks.
The reliability tools are designed to help the reliability function to assess and enhance the design so that the product is capable of meeting and exceeding its goals.
In this chapter we provide an overview of many of the tools used in the design life of a product: what they are, how they are performed, and how their results are used by the various design disciplines—reliability, electrical, mechanical, and software design, test, and manufacturing engineering. Figure 3 illustrates the reliability tools that are discussed here, when they might be used in a product's life cycle, and how these tools match the actions and events in each phase of a product's lifetime.
Figure 3 Program and product life tasks, tied to reliability tasks

The Need for Tools: Understanding and Communicating Reliability Performance
Engineering
For anyone to meet a goal, at least two pieces of information are needed: what the goal is, and where the existing product or action is estimated to be with respect to that goal. So it makes sense that for the design function to meet reliability requirements, reliability must be specified and estimated. The first action of reliability engineering in a product's design life is to facilitate the definition of the reliability goal or specification and to estimate whether or not the requirement is easy, difficult, or impossible. This is done with an understanding of the design's purposes, its uses and limitations, its environments, its architecture, and the time it is intended to last. Predictions and models are used to estimate the likelihood that the design will be capable of meeting the reliability requirements. Further in the design process, other methods are used to understand which parts of a design are most sensitive to reliability and what changes might affect the reliability the most. Analyses that lead to understanding stresses—mechanical, thermal, and electrical—are performed; reliability block diagrams and predictions are completed to provide the numerical status of the design. Testing is where the “rubber meets the road” not only for the obvious design parameters, but where the weak points are regarding reliability—be they due to design concerns, manufacturing problems, or testing issues. There are specific design tests that are used in testing exemplar units to provide insight into the design margins, while other screen tests assure that a minimum amount of quality and reliability are included for each finished product. Root-cause analyses, fault trees, and data analysis tools are used to detect test result concerns, as well as causes for failures. Similarly, such tools are also used for defining issues and possible causes during production and use in the field. Often, designs must undergo modifications due to changes in requirements or obsolescence of parts. When this occurs, many of the tools used in early product life are revisited and updated.
Management
The reliability status must be provided to management to assure that the performance, schedule, and cost risks are understood with respect to the goals. Clearly, besides the obvious cost and schedule losses due to missing a reliability requirement, there are many subtle but equally important losses: customer dissatisfaction, loss of brand quality, and ultimately, loss of repeat business. Another key consideration is the possibility of safety issues due to potential accidents and mishaps. Therefore, it is important that the ability to meet goals, as well as potential technical problems related to failures, be communicated to management in an objective and useful manner. For the tools to be effective, they must facilitate fulfillment of this need.
Customers
The real winner in designing and building a product that meets specifications with margin is the customer. This means that the supplier designed and built the product as intended, and that the product lasts. In some cases, such as for space or military customers, the customer representatives are involved directly in the development process. As such, they are informed as to the reliability status throughout the design process. But even commercial customers are swayed by studies of quality and reliability of products, so that it is always to the producer's benefit to know what the product reliability is and how it will be received by the public. The most important test of any product is how well the product stands up to customer expectations. The reliability tools help to define reliability goals and logically assess progress toward those goals. The benefit to using such tools is to provide a means of communicating such assessments: to management, to design engineers, and to customers.
Reliability Tools
Early Program Phase (Concept Definition)
Reliability Predictions
One of the most useful, but poorly understood, tools available to the reliability engineer is that of reliability prediction. A prediction can help us to understand the risks involved in setting reliability goals—sort of a “sanity check” for comparison to an expected capability. It can point to which portions of a product could be most sensitive to reliability concerns. It is useful in gaining insights into how part quality, application stresses, and environments can affect the overall reliability performance. Using reliability block diagrams (described below) can help one to understand the need for redundancy or partial redundancy (“m-out-of-n” redundancy).
The part about prediction that has the potential to be misunderstood is that they are not accurate. George E. P. Box, a well-known industrial statistician, is attributed as the author of the saying: “Essentially, all models are wrong, but some are useful.” This is especially true for reliability predictions. The great majority of predictions are performed by reliability practitioners using industrial or military standards, such as the U.S. military's MIL-HDBK-217 [1], Bellcore TR-332 [2], and Telcordia SR-332 [3]. The intent of each of these documents is to provide a standard method of calculating the failure rate of components used in specific environments with given stresses and quality ratings. In general, to use them you must assume that the equipment has a constant failure rate. For electronic parts for which high output quality and special screening has become the norm, this is generally true. For a large number of components in an assembly or system, the total failure rate can generally be assumed to be constant. At least for assemblies with long-life components with mixed failure modes and mechanisms, the composite assembly failure rate is reasonably constant. However, the question of validity comes into play when one looks at details, such as the use of specific model types for specific parts that are provided in the standards. In many cases, average factors and model constants are used to estimate the failure rate. These “averages” can be tweaked over time by incorporating field and test failure data (known as Bayesian techniques). This is useful in later phases of the program, but early on, such data are available only from historical data associated with similar products.
Mechanical parts, mechanical failure modes of electronic and electrical parts, and cyclic failure mechanisms are not fully comprehended in the methodology described above. In actuality, these are typically not constant failure rate modes. In these cases, where knowledge of the failure rates is critical, the most comprehensive method for predicting product life is physics of failure (PoF): that is, to understand how the failure modes are caused and to use models applicable to the underlying failure strength-to-stress interactions. This PoF modeling has a much higher fidelity than use of the standard techniques and should be used wherever practicable
PoF is using the underlying science behind failure mechanisms to model each of the key possible stress–strength relationships. In many cases such models already exist, but for new technologies, applications, or packaging, such models may require development by test. Not only are the root causes of each failure mechanism modeled, but where possible, the variabilities associated with the stresses and the material properties can be modeled to gain insight into expected failure time limits. This type of analysis results in an understanding of potential causes of failure, times to failure, and possible margins. As with any of such predictive models, it is wise to validate the models with actual stress tests. This type of analysis requires comparatively high resources, and in most programs is presently used for particularly critical applications, as cited above.
The prediction results are not just numerical values, such as mean time between failures (MTBF), failure rate, or probability of success. For them to be meaningful, their calculation methodology and underlying assumptions must be communicated as well. This allows the receiver of the information to make an informed judgment as to how much weight to give those predictions versus the risks involved. In the concept phase, these are used by managers and customers to develop an idea of the product reliability capability and where reliability should receive the highest priority. They also provide input to engineers to optimize the device to withstand applications of overstresses and environmental extremes.
Reliability Models: Fault Trees and Block Diagrams
The underlying idea behind reliability block diagrams (RBDs) and predictive fault trees is to display the logic of how a failure could interrupt the intended outcome or “mission.” Blocks A and B in Figure 4 are “series” units in that the failure of either of these two items would result in a system failure. The probability that both of these are successful is the product of their probabilities: Rsegment = RA × RB. In the general case, the segment or system reliability for n blocks is
Figure 4 Reliability block diagram.

(1) 
The C and D devices are in parallel or redundant. If one device were to fail, the second would be sufficient to allow the system to succeed. In other words, both must fail for the system to fail, where the probability of both failing is the product of their unreliability 1−R, or in this case, Rsegment = 1 − [(1 − RC) × (1 − RD) × … × Rm)].
Blocks E through m represent an m-out-of-n redundant configuration. In other words, this segment is still successful as long as n blocks are operating. So, for example, if there are 15 devices in the segment but the system will continue to succeed as long as there are still 12 in operation, this is a “12-out-of-15” redundant segment. In the general case, the segment or system reliability formula is
(2) 
The RBD is a picture of the paths that result in a success, while fault tree logic provides a similar logic picture for a failure or a specific failure mode. In both cases, the results are used to develop and communicate the Boolean logic used to provide a probabilistic model for reliability—the probability of success.
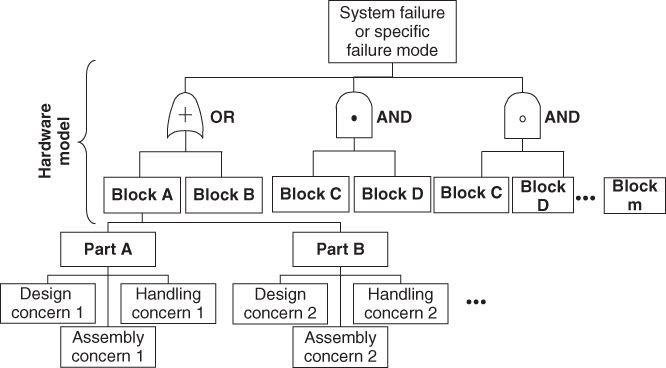
The fault tree (Figure 5) is an analysis tool that is like the “mirror image” of a RBD: Where the RBD tool helps to calculate the probability of success, fault tree logic assists the user to calculate the probability of failure. The elements, then, are blocks that provide causes of failure due to lower-level failures or events, and if done properly, to the root causes. One other key element of fault trees is that they generally include Boolean algebra symbols to show series and parallel logic. When completed, the probabilities of the lowest level of causes or failures can be used to develop an equation to provide the probability of failure. The fault on which the fault tree is based may be a system failure, or it could be the failure of a portion of the system or a specific failure mode of the system or system component.
Figure 5 Fault tree.

Either of the two tools—RBDs or fault trees—can serve to provide a picture of the logic underlying the probability calculations regarding the probability of the product lasting through a particular period of time, whether that be a specific use or mission phase or its entire expected life. As with many of the reliability tools discussed here, it also serves to provide those using the models with a means of focusing on the key drivers to those numbers and clues as to how the reliability might be improved.
This type of analysis is very useful in trading off the use of redundancy versus single series items. Even if the reliability is a comparatively high number, say 95%, such ideas may need to be explored: for example, if a system requires a reliability of 90%, but a single item X has a reliability of 80% while the rest of the system reliability is 95%. The system reliability would be the product of these two probabilities, or 76%.
However, if a second 80%-reliability item X were added so that only one of the two X's was required, the resulting reliability of the two X's would be 96%. Then the system's reliability would be 96% × 95%, or 91.2%. If more margin were needed, additional redundant units would increase the reliability further. However, there are very important factors that must be considered beyond just the numbers. Redundancy adds complexity (e.g., added fault detection and switching must be incorporated). Cost, weight, and space are additional program concerns that must be taken into account.
Reliability Allocations
One tool that is widely used is that of allocation of reliability. It is usually included in a reliability program as a means of providing specifications or goals at multiple levels in the design. So if a system has an MTBF requirement of x, four equal system components or modules would have an allocation of 4x. This stems from the constant-failure-rate assumption: If the example system MTBF is x, its failure rate is 1/x and its four equal modules would each have a failure rate equal to 1/4x. The MTBF of each module would then be the inverse of 1/4x, or 4x. Similarly, then, one can use this idea for different modules with different failure rates by apportioning the failure rates so that their sums are less than or equal to the system requirement.
Of course, this does not really work for nonconstant failure rates, where the addition of failure rates is not a valid process. In this case, the known models can be incorporated into RBD or fault tree probabilities and allocated appropriately using probabilistic models. It is also difficult to allocate failure rates among modules for which there is little or no information (i.e., in the concept phase or for new designs or technologies). In this case rough estimates of complexity or reliability can be used to help divide the reliability “budget” to provide lower-level specifications.
The intent of the allocation is to provide a tool for achieving a higher-reliability goal by budgeting the requirement to the lower-level designs (in many cases, multiple levels) to provide goals for the design engineers and their leaders.
Parts, Materials, and Process Selection
Whether designing a product from a blank sheet of paper or when developing or modifying an existing design, one of the key decisions that designers must make is which parts to use for specific applications. Of course, the most important factor is performance. The part must meet specific performance parameters in order to meet the requirements of the design. But the next tier of factors includes cost, availability, life cycle, commonality, quality, and reliability.
A preferred parts list helps to manage this decision-making process. The point is to provide straightforward access to parts that have been reviewed or used from known suppliers with positive quality and reliability credentials. This helps to avoid “surprises” such as a new supplier or part type that fails in unexpected ways or due to unknown causes. It can also help to assure that common parts are used within a product's development: useful in managing cost, schedule, and technical issues with a part or supplier. In some cases the supplier or part would perform as needed, but due to new materials or configurations, the use of such parts can represent new technologies in the manufacturing arena. These types of issues frequently result in reliability risks. So use of a part that is not in the parts, materials, or process list must go through a special review. Figure 6 is a flow diagram that shows how this list would be implemented in a process.
Figure 6 Preferred parts flow.

This process provides a framework for the designer and the components engineer to standardize parts or to make an informed decision for specific instances. This is not to say that all new technology or suppliers cannot or should not be used. It is an “insurance policy” that assures that such selections are fully reviewed and the risks delineated.
Stress Analyses and Design Guides
Design guides help to serve as a means to communicate lessons learned concerning reliability issues. In this context, the term derating is often used to mean applying a part that is better than its requirements. For example, if a capacitor is expected to work in a circuit at 5 V dc, then selecting a 10-V dc capacitor will add life to that device. This is a 50% stress ratio, sometimes referred to as 50% derating. Derating is important, because often the stress ratio on a device is related exponentially to the device's life expectancy. Choosing a low stress ratio often adds little or nothing to cost or schedule risks, so using them is clearly a benefit. The guidelines can also be used to caution against certain types of parts or circuit designs. This can be of great value in avoiding risks before they are designed-in and require modification.
Stress analysis is analysis of the design to compare the application stresses to the rated value and the derating recommended in the guidelines. It is typically performed during the design process to determine the stresses—voltage for capacitors, current or power for resistors and inductive devices, and junction temperature and power for active devices and integrated circuits—so that the guidelines can be followed. These choices also provide input into the reliability predictions and will affect that assessment as well.
When it is not possible to follow these guidelines due to the lack of availability of a part or special performance needs, these exceptions should be reviewed by peers and technical management to assure that informed decisions are made and that the requirements are properly balanced in the design before proceeding to the building and test phases.
Design Failure Modes, Effects, and Criticality Analysis
There are a variety of approaches to design failure modes, effects, and criticality analysis (D-FMECA). One of those approaches is offered in Chapter 5. A different approach to FMECA is shown in Chapter 6, but with an emphasis on process rather than design. MIL-STD-1629 provides a separate approach, often used in the military weapons design process. Regardless of which type is used, there are common uses and goals for FMECA. This type of analysis considers the possible ways in which parts or system components can fail (modes), the impact of such failures on the overall product and its use or mission (severity) and the likelihood of their occurring (frequency or rate), and the modes' ability to be detected. Another key part of these analyses is the determination of an importance or ranking of each failure mode considered.
The output of D-FMECA allows the designer to learn what failures are important and why, and to document the findings and their rationales. Each analysis should result in serious consideration of follow-up actions. Upon completion of FMECA, the entries should be ranked to find those that have the highest risk: those that can cause severe outcomes, are likely to occur, and can occur without warning or the ability to locate the problem. The highest-ranked entries should then be reviewed so that proactive responses can be made. That is, review of the architecture for possible redundancy, selection of improved quality parts, derating, self-test considerations, and even how the device in question is installed and handled. This is not to say that FMECA is used only to make design or other changes, but it serves as a pointer to issues for consideration. Other uses of FMECA outputs are to feed RBD and maintainability calculations and to support detailed testability or built-in test (BIT) analyses. However, the real leverage from D-FMECA is to provide a ranked picture of where the highest risk is in the design for further action.
BIT Test Definition and Effectiveness Analysis
Testability analysis is a multidisciplinary engineering effort involving the design and review of circuitry that either tests itself or can be tested within the product being designed. This capability of testing itself is called built-in testing (BIT). However, to take advantage of such features it is necessary to translate the intent of the BIT, as well as how the circuitry works, into a language that software engineers can use. That is, for a system or product to test itself, its processor or control sequencing function must provide the proper stimuli and interpretation of the responses. This allows the product to provide feedback with respect to a “good” or “bad” result or a level over and/or under defined thresholds. When performing this translation, the testability engineer must also take into account variability in the design due to part-to-part differences, changes in conditions such as temperature, and manufacturing or material variations.
When a design is complete, the circuitry is tested with and without faults inserted to assure that proper tests and test limits have been incorporated. Also, the testability engineer can estimate the effectiveness of BIT by analyzing which parts and part failure modes can be detected and can compare the failure rate of the detectable faults to the total product failure rate. This ratio of detectable failure rate to total failure rate is the BIT Effectiveness or probability of fault detection.
Fault isolation is another key parameter when a product is to be maintained. For example, the “check engine” light in a car can tell the driver that something is wrong. This is fault detection. However, that light, combined with “oil low,” helps us to understand the problem both operationally and for “repair”. In other words, it helps to know what to do immediately and then how to go about finding out what the actual problem is. This reduces the problem to one or a few possible causes. The fewer the items left to explore, the better the isolation is.
The probability of fault isolation is also a failure-rate-weighted average of the items that can be isolated given detection. The isolation requirements can be defined in terms of a single component or groups of x components. That is, a probability of fault isolation might be specified as an 85% probability of isolating a fault to a single unit (board, box, replaceable element), or it might be specified as a 95% probability of isolating a fault to five or fewer elements.
Isolation analyses are performed to provide a measure of goodness regarding the testability design of a product. Like many other such measures, the importance of this effort depends on the product's intended use. A simple throwaway toy, for example, is not a likely place where one might spend resources designing-in testability. On the other hand, for a device that is maintained, such as a car, a piece of manufacturing equipment, or a weapon system, such design measures are critical. In these cases, communication of testability findings with management, design/test engineering, and the customer or user, is vital to the success of a product.
Detailed Design Phase
Continued Stress Analysis
Often, a design is in a state of flux during the concept phase of a program. Therefore, it makes sense to continue to update the stress analyses as the design matures and to compare the results to the guidelines. This also allows the reliability analyses to be abreast of the design changes. The stress analysis update provides design engineering with an objective view of the applications and engineering management with an overview of potential reliability issues, which facilitates informed decision making. If followed, this helps to maximize the reliability of the final design before it is manufactured and tested.
Process FMECA
Process FMECA (P-FMECA) provides much the same type of information as that of D-FMECA, but with an important difference. It focuses on the producibility of the product: what is involved in materials handling, assembly, adjustments or calibration steps, and testing. This is important to the design of a product because the ease of manufacture often affects reliability greatly. For example, if new packaging is required, special installation methods and tools may need to be designed to alleviate specific issues. Sometimes, the design must change to accommodate a manufacturing issue that improves quality or cost issues later in the product life cycle.
Continued Use of Tools
It is important to note that the tools covered in the “early program” are still useful in later stages. Their validity and accuracy can often be improved greatly once the design details become more developed. It is in the interest of the program to gain visibility into the reliability issues as the design develops so that changes can be known and addressed.
Design Verification Phase
Failure Reporting and Corrective Action System
The failure reporting and corrective action system (FRACAS) is one of the most useful tools available to reliability engineer or to anyone who needs to understand the product reliability or how it might be improved. It is a method of collecting failure data of a product such that it facilitates the ability to look at different “pictures” of the information to show the failure history.
The idea is to provide a receptacle—usually a database—for specific factors surrounding a specific test anomaly or set of symptoms, using a standard set of inputs. These inputs then can be used to select and sort specific aspects of failure events so that the data can be prioritized using Pareto analysis or other ways to show quantities versus specific parameters. The parameters can be such factors in a report as part type, supplier, date codes, circuit cards or modules, serial numbers, date of events, or test type. This allows the user to detect failure trends, review failure histories, and gain insight for investigating the causes of failures.
The intent of FRACAS is to provide a feedback loop for failures. As tests are performed and events occur, more can be learned about causes of failure, allowing corrective actions or design improvements to be implemented. A failure review board (FRB) includes a mix of key disciplines (design, manufacturing, systems, quality, and reliability engineering) as well as leadership (technical or managerial leads). This assures a well-rounded discussion of specific issues associated with failures, and optimal actions taken with respect to root-cause analysis and corrective follow-up. Ultimately, management is responsible for the decision making but can do so with added visibility from FRACAS results.
Root-Cause Analysis and Fault Trees/Ishikawa Fishbone Charts
The underlying idea in the use of FRACAS and tying test and field failures to a means of discovering and improving system weakness is largely dependent on finding the cause of failures or failure trends. Often, failures are analyzed to the “immediate cause,” but without delving deeper, the underlying cause is not addressed. This can result in “repeats” or reappearance of the same failure modes. In other words, for robust reliability growth to occur, it is imperative to uncover and address root causes. Two tools that can assist in that effort are fault trees (Figure 7) and Ishikawa fishbone charts.
Figure 7 Fault tree.
Fault trees in this application are used for a purpose other than as a prediction tool. In this case the “fault” is an unwanted failure or event. The underlying logic is still the same: to iteratively assess the cause at multiple levels to delve into causes of the causes until a root cause is found. In this context, a root cause is an actionable process step or steps that, if addressed, would eliminate the possibility of the top event.
This is a different application than that used in predictions, so it is used differently:
- As the causes are uncovered, not only is the failed part or assembly considered but also what process or actions caused or contributed to the likelihood of the event.
- There is little or no use of reliability predictions or probabilities to calculate the probability of failure. The idea is to gain an understanding of what could have caused the occurrence and address such causes or contributors in actual practice.
- Boolean gates are often not used except for the first hardware configuration modeling. Usually, the processes involved are not redundant and therefore do not need to consider AND and OR gates. If it is found that redundancy does need to be considered, they can easily be added.
- Processes can be modeled at the top level as well. However, experience shows that the event first requires troubleshooting to some level before process steps can be considered to the depth needed.
- The output of this process should be the cause or causes addressed to develop reliability improvements (i.e,, reliability growth). This is not the same as probability of failure, where actual events have not occurred, but it, too, can help focus on high-probability issues. Both can be used to help drive improvement action.
An Ishikawa fishbone chart (Figure 8) is almost the same as a fault tree but has a different format. It can be designed to help assure that the user considers all the important processes involved. Some typical areas considered in either a fault tree or fishbone diagram to find root causes are:
Figure 8 Ishikawa fishbone diagram.

- Assembly [documentation, tool calibration, error-proofing, and electrostatic discharge (ESD) prevention]
- Human error (task loading, training, and distractions)
- Design (materials, application, environmental stresses, and engineering review processes)
- Handling (point-to-point movement, inspection handling, and protection)
- Test (test equipment, calibration, and ESD prevention)
Test Data Analysis
Life Testing and Acceleration Factor
Specific failure modes are often tied to a component life. Life in this context is different from the constant failure rate discussed earlier. It represents the part of a component's life cycle in which the failure rate is increasing. Reliability life tests are designed to provide insight into when in a product's life cycle the failure rate begins to increase with time or use. Such tests focus on specific failure mechanisms to facilitate the generation of acceleration factors, which allow devices to be tested at very high stresses to allow insight into how that same device would behave in actual lower stresses without testing very high quantities of units over very long periods of time.
Life tests are performed by applying a stress or stresses to a component and tracking the time to failure of a portion or all of a sample set. If sufficient samples are tested to failure, the failure time versus failure quantity can be analyzed statistically to develop a failure probability distribution function (PDF), a statistical model of the probability of failure versus time. If the life tests are repeated at multiple stress levels, a different type of model, a stress model, can be developed that aligns the time to failure for a specific percentage of failures (a percentile) versus stress.
This stress model can simply be extrapolated if it can be made into a linear equation. For example, the Arrhenius model is largely tied to chemically dependent failure mechanisms such as corrosion or chemical reactions. It reflects the proportional relationship between time to failure (t) and the exponential of the inverse of temperature (T):
(3) ![]()
where ɛ is a constant called the activation energy, which is dependent on the materials involved and T is the absolute temperature in kelvin. Assuming that the PDF does not change over the stress (in this case, temperature), dividing both sides by the same equation for actual stresses yields
(4) ![]()
This ratio is the acceleration factor, α:
(5) ![]()
The α factor is used to perform tests at higher stresses (in this case, temperatures) that allow direct correlation between the times to failure at a high test temperature to the temperatures to be expected in actual use. As long as the temperatures are such that new failure mechanisms are not introduced, this becomes a very useful method for testing to failure a relatively small sample of items for a much shorter amount of time.
This type of analysis is very dependent on knowing the specific failure mechanism being considered and the underlying relationship of that mode to the stresses provided in the test. In practice, a product such as a circuit card is often made up of many parts, each with its own failure mode, but the main drivers are microcircuits. In this case, engineers often use the same physical relationships but assume conservative factors in the models, so the α factor is a “greater than or equal to” value. Such modeling allows engineers and managers to understand how long equipment might last in an extended exposure to certain environments and how changing those environments could affect the reliability as well.
Reliability Growth Modeling
Reliability testing is a method of test, analyze, and-fix that helps to assure that a product at the start of its development can eventually mature to meet its reliability goals. The underlying assumption is that in the concept and design phases of a program, not enough is known about a product to expect it to meet its expected reliability capabilities from the start. So various environmental tests are performed, which are similar to the use environments expected, or the failure modes and their related acceleration factors are known, so that test time can be plotted against failure rate or mean time between failures. It was observed that if these data are plotted on a log-log plot, the plot generally becomes linear over time. Using this knowledge, the data in such testing can be used to understand what the failure rate of a unit under test is at any given point in the test, and if performed properly, the testing will result in a decrease in failure rate such that the data can be extrapolated. This allows the reliability engineer to estimate how much testing is required before the failure rate goal is reached. It can even be used to judge the effectiveness of the FRACAS/FRB process. If the slope is not steep, it may be necessary to increase resources in that area. Good design programs have been known to have a slope of at least 0.3. Reliability growth modeling is an invaluable analytical tool for estimating reliability, testing requirements, and process effectiveness for technical management.
Production and Field Support
The FRACAS described previously is not limited to reliability testing. Events in any testing and field returns should be considered opportunities for reliability improvement. This includes engineering verification, qualification testing, acceptance testing, and field returns. If the FRB with a built-in root-cause analysis process is utilized, there is continued opportunity to gain insight and consider marked improvements over time. This type of reliability growth is systemic and based on actual use. The cost-to-benefit ratio is quite small for any product for which reliability is important.
Production Testing
There are many types of tests that involve reliability engineering directly or indirectly, due to the FRACAS methodology. The tests discussed here are those that are performed with the purpose of understanding product reliability.
Highly Accelerated Life Test (HALT) and Aging Tests
Both HALT and aging are ways to develop insight into how a product is likely to behave over time. Such testing is generally performed on equipment that has a long expected life or where the reliability of the product is critical. Often, such requirements entail safety issues, customer costs, or warranties. In these cases, there is a good business case for performing such tests, because they can provide insights into possible future risks.
HALT entails single and combined thermal and vibration testing. The product of interest is mounted in a combined-environment chamber capable of random vibration and thermal excursions. Also, the unit under test (UUT) is connected to an interface or tester to allow it to be tested during exposure.
HALT is performed as a step-stress test, where the equipment is stressed to increasing levels in a sequential manner. The stresses are set to higher and higher extremes, finding the nondestructive limit, where the UUT ceases to operate properly but has not been destroyed. This allows insight into the design margin of the UUT, as well as the weakest points in the equipment. It is an excellent method of finding reliability issues on equipment that is expected to be used in specific environments.
Similarly, an aging test is an above-specification test. In this case, the assumption is that the stresses of temperature cycling, temperature combined with humidity, and salt-fog shorten the useful life of a device as they increase. The idea is to simulate in accelerated fashion the effects of long-term stresses:
- Temperature cycling on materials with thermal expansion differences
- Exposure to temperature and humidity on materials susceptible to humidity
- Exposure to a salt-fog environment, due to sealing or packaging issues
As with the HALT discussed above, this testing provides insight into the design margin and the weakest links in the design for potential improvements. Events and anomalies in both HALT and aging require a disciplined approach to root-cause analysis to assure that the findings are addressed properly and that the technical managers have the facts necessary to make informed decisions.
Environmental Stress Screening (ESS) and Highly Accelerated Stress Screening (HASS)
Both HALT and aging are excellent methods of learning about the design of equipment over a relatively short span of time and affecting that design prior to committing the program to production. Once production begins, other types of testing can provide important intelligence on how well the product is being built and tested. If ESS is included in the manufacturing process, then, as a screen, it is performed on all the equipment being produced. It is designed to stress the product so that out-of-specification weaknesses are found, to preclude “escapes” being shipped to the field. The stresses are chosen to address possible failure modes found in a manufacturing process—modes such as loose fasteners, improper solder joints or weldments, missing hardware, defective components, and improper solder joints. Typically for electronic and mechanical devices, temperature cycling and random vibration up to specification level are used to uncover possible manufacturing defects. In other words, the producer performs the screening so that the customer doesn't need to do so in use.
Any findings are generally expensive, but not as expensive as returns and unsatisfied customers. This translates into a good business practice, utilizing the FRACAS/FRB methodology to assure that future such events do not occur. This not only keeps potential problems out of the customer's hands, but allows product quality and reliability to continue to improve.
HASS is an accelerated version of ESS, such that the stresses used are beyond specification values but well below nondestructive limits. This application of accelerated stresses assures a margin in the manufactured product and shortens the ESS cycle. HASS cycles are shorter than ESS cycles since the higher stresses do not require as many cycles or time in testing to provide equivalent effectiveness at precipitating and detecting defects and failures.
Summary
This chapter covered various tools used in the reliability engineering discipline. These tools provide insight into the possible and realized reliability of a product undergoing design and use by customers. They are emphasized early in the design flow when the least is known about product capability and design but when changes are the least costly in time and money to implement. These tools require a close relationship among the design, manufacturing, and quality engineers as well as management. These tools, although not an exhaustive list of all useful tools available to reliability engineers, have some important characteristics in common:
- They provide insight into the relationship between goals and progress.
- They help to identify where the issues are and what actions are required.
- They require input from other personnel in the program, since they encompass the very basics of the design.
- They provide ready means for communicating results to those who most need the information: designers and managers.
Many of the tools described in this chapter are discussed in greater detail in other chapters. As evidenced by the information provided, if properly implemented, reliability engineering tools span the design program from concept definition to end of life.
References
[1] Military Handbook for the Reliability Prediction of Electronic Equipment, MIL-HDBK-217, Revision F, Notice 2, U.S. Department of Defense, Washington, DC, Feb. 1995.
[2] Reliability Prediction Procedure for Electronic Equipment, Bellcore TR-332, Issue 1, Bell Communications Research (Bellcore, now Telcordia Technologies), Telcordia, Piscataway, NJ, 1999.
[3] Telcordia Electronic Reliability Prediction, Telcordia SR-332, Issue 3, Telcordia, Piscataway, NJ, Jan. 2011.