
Process Failure Modes, Effects, and Criticality Analysis
Introduction
As discussed in Chapter 5, failure modes, effects, and criticality analysis (FMECA) is a tool used for addressing risk of failure. In the case of design FMECA (D-FMECA), it is extremely valuable in reviewing the design aspects of a product—from the s tandpoint of the ability to investigate possible issues for a product meeting its design requirements. Just as D-FMECA focuses on possible design failure modes at multiple levels of hardware or software structure, P-FMECA is a detailed study, focused on manufacturing and test processes and steps, required to build reliable products. The format used in this chapter is different from that discussed previously for D-FMECA, but the considerations are the same: Risks: how serious the potential event is, the chances that it will happen, and how users know about it.
Principles of P-FMECA
P-FMECA includes a review of materials, parts, manufacturing processes, tools and equipment, inspection methods, human errors, and documentation. P-FMECA reviews the build, inspection effectiveness, and test aspects of the product for possible risks of process step failures at the multiple levels of processes, including the severity of problems after the product is in the customer's hands.
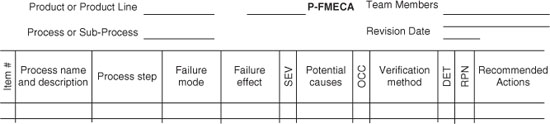
The P-FMECA process is broken down into subprocesses and lower-level steps. For each step, possible problems, their likelihood of occurring, and their ability to be detected before extensive consequences are explored for each step. The impacts to the customer, as well as to subsequent subprocesses, are considered. Throughout this process, a matrix is used to help define the scope of effort, to track the progress of the analysis, to document the rationale of each entry, and to facilitate quantification of the results. Figure 1 is an example of one type of matrix used for such an analysis. This quantification process, along with the rationale, is extremely useful, when working to prioritize possible improvement recommendations. The details of how to use this form as a tool to complete the analysis are discussed in subsequent paragraphs.
Figure 1 P-FMECA form.
Use of P-FMECA
Why P-FMECA Is Covered in a Design Reliability Book
Review of failure data in many programs indicates that many of the causes of product failures were related to processes, especially the manufacturing and test processes. These tie directly to the design function responsibilities, especially as they relate to reliability. The following considerations should be taken into account:
- The design engineer knows more than anyone how a system or piece of equipment works: what is important to its operation and what is not. Often, the design engineer plays a significant role in making decisions that drive the manufacturing process.
- The designer selects parts, defines layout and materials, and makes a myriad of decisions that define how a design is to be built and tested. For example, if a new material or component is required to meet requirements, this could affect the thermal profile used to attach the part. Often, issues with manufacturing or testing are avoided or resolved by means of the design. Design decisions must be selected considering cost, schedule, and performance.
- P-FMECA is best performed with a team of process stakeholders, including staff from manufacturing, test engineering (or technicians), maintenance (when that is a key issue), reliability engineering, quality engineering, and design engineering. This diversity provides a variety of viewpoints to consider for various issues.
An interesting example used in P-FMECA training is to consider a fire in a building. One question is: How would this affect us? Many different and interesting answers might ensue. What would cause this to occur? Almost without exception, design engineers would provide issues with assembly, installation, maintenance, and inspection, while maintenance engineers and technicians would bring up possible design problems.
The point is that the fidelity of FMECA is improved by having multiple viewpoints. This is not without cost: The more personnel who are involved in the analysis, the more discussion takes place, and this takes time. However, if guided properly, such discussion is enlightening, and the effort yields more complete and useful results. For example, a design may include an elegant means of alignment of piece in an assembly. However, if the operator must perform the alignment by “touch” or by “eyeballing,” the results almost certainly vary with operator experience, state of mind, and physical ability. Adding a fixture to assure less variability in results could be an invaluable improvement to the process at little cost. Upon completion of successful P-FMECA, some or all of the following benefits are realized:
- Improved reliability
- Improved quality and less variability (higher yields, diminished schedule, and cost risks)
- Improved safety in the manufacturing processes
- Enhanced communication between the process owners
- Improved understanding of processes and interfaces by participants
Overall Benefits of P-FMECA
The benefits of FMECA are the same as those for its design counterparts, but for processes. The total process can be considered analogous to a new design to undergo D-FMECA. Then the subprocesses and lower-level single steps are like the assemblies and the piece parts. The idea is the same: to break down the top entity to consider possible issues and their causes, judge their effects, and improve their design. The analysis results in a thorough review of the process with a prioritized list of possible problems and an improvement plan or recommendation.
Experience shows that P-FMECA is a tool not only to identify process concerns but also to motivate those who do the follow-up. After one particularly detailed D-FMECA process, a project design engineer said, “I think this is a wonderful tool. I never knew so much about this system ….” After a pause he went on to say, “But I never want to do one again … Ever!” When asked why, he responded, “Because, since I've done this, I haven't had a good night's sleep! I've never thought about so many things that could go wrong!” Needless to say, this designer was quite anxious to complete the improvement actions we developed over the course of that analysis. The same results have been observed from P-FMECA as well over the course of performing many such analyses.
One other important aspect of FMECA: Each result is prioritized with corresponding rationale. This allows the team to consult with management as to which items deserve highest priority. This, combined with cost estimates of recommendations, provides a logical decision-making tool.
What is Required Before Starting
Next we discuss key support considerations when performing P-FMECA. Accounting for these points is needed to assure a successful analysis—one that points out key risk, how such risks can be mitigated, and why they are recommended.
Management Support
Since P-FMECA is complex, it is best performed by a team. This provides an optimal environment for uncovering possible concerns and improvements. Management must support the time, money, and resources it takes to perform this effort. For a very complex, critical process, the process is longer, but the results are more valuable as well.
Cross-Functional Team
Earlier it was noted that using a team from multiple disciplines is quite useful for this type of analysis. This helps to assure multiple viewpoints and can sharpen the focus of the results to account for various possible sources and interactions of issues and their causes. Functions that typically use P-FMECA are:
- Reliability engineer
- Manufacturing engineer
- Design engineer
- Quality engineer
- Senior line operator or supervisor
Planning
With the team established and a management go-ahead, the analysis should be well planned regarding the schedule, budget for the analysis itself, ground rules for the participants, analysis location, and meeting frequency. One key element in planning is scope. It is critical that the ground rules include the processes and subprocess to be covered, and what areas will not be covered. This will help the participants stay on track and help avoid additional unplanned effort
Performing P-Fmeca Step by Step
Team Preparation
In selecting specific team members, it is important to assure that the team participants can understand the specific processes and steps to be performed, the tooling and fixturing involved, the design of the equipment undergoing the processes, and how the unit or system is to be used by the customer. The first step in performing P-FMECA is to list the processes and steps to be considered. In effect, this task actually translates the defined scope into the specific areas that will be covered. A process flow diagram, as well as the specific procedures and assembly drawings to be analyzed, are needed to perform P-FMECA. They should be kept on hand as reference material during the analysis. In fact, in many cases (where possible), examples of the actual hardware to be built, assembled, or otherwise processed should be available as well. Also, trips to the process lines to view the actual activities are extremely useful to assure that participants are aware of the details involved.
The ground rules of the effort should be established up front. For example, since each team will have its own point of view, it is valuable to settle on the criteria for ranking of specific factors (discussed further later in the chapter). A general description of the ordinal values is provided here. However, specific details and tailoring to unique aspects of a design or process will save much time later in the analysis. Specific meeting times, locations, and tabling of subjects not to be covered in P-FMECA can be covered at this time as well. A practice that has been found useful is to create a “parking lot” to collect subjects that although important or useful to discuss are outside the scope of the analysis at hand. These points can be covered at another time.
Defining the Processes and Subprocesses
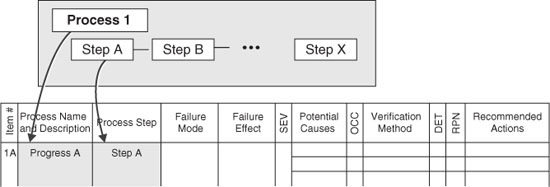
Figure 2 shows the two columns “Process Name” and “Process Step” being completed. This is the first part of a P-FMECA effort. By completing the first two columns the team actually defines the scope of the analysis. That is, if the process steps are analyzed and there are no other additions or changes, this step actually defines the level of detail and which steps are covered in the analysis. It is sometimes necessary to include additional columns. This may be necessary, based on the way the process owner has defined the process to be studied. Also, in the course of P-FMECA, other processes may be identified as worthwhile to analyze, or another change may be considered necessary. These changes are expected and can be implemented as long as the team recognizes that this is a change in the scope of the analysis.
Figure 2 Defining the process and subprocesses to be analyzed.
Failure Modes and Effects: The SEV Factor
When the analysis scope is defined, the steps are reviewed for how they might fail. In this context, a failure is when a step is missed, done incorrectly, or a defect can result. The idea is to delineate the list of possible ways in which mishaps can occur (failure modes) and look at the rest of the process to see how the entire process could be affected (failure effects). Figure 3 shows how these considerations fit in the P-FMECA form. Any failure could result in increased cost, loss of quality, schedule impact, and even harm to equipment or personnel. More specific ways in which a failure could affect the process are:
Figure 3 Failure modes and their effects.

- Interruption of subsequent process steps or processes
- Defects that could result in wasted material, rework labor, or schedule time to repair
- Unreliability or poor quality in the product shipped
- Unsafe situation on the line or in the field
The importance of the impact of these issues is the basis for each of the severity (SEV) factors defined. This is why each failure mode has a separate line and all the major possible effects are listed on that line. The SEV factor (value 1 to 10) is selected based on the most severe possible effect. Table 1 illustrates how such values can be guided by an objective listing of values. The more specific the rationale, the more consistent the analysis will be. Tables are provided as well for the likelihood of occurrence (Table 2) and the detectability of the occurrence (Table 3).
Table 1 Severity Factor Guideline Example
| Severity of effect | SEV |
| Product or plant safety at risk; risk of noncompliance to government regulations | 10 |
| Major impact on ability to produce quality product on time; includes significant interference with subsequent steps or damage to equipment; could result in mission failure | 9 |
| Product defect, rejection, failure in in-spec storage/operational environments; disruption to subsequent process steps | 7–8 |
| Customer dissatisfaction, some degradation in performance, loss of margin, or delays in the process | 4–6 |
| Slight customer annoyance, slight deterioration in performance or margin, minor rework action or in-line delays | 2–3 |
| Little or no effect on product or subsequent steps | 1 |
Table 2 Detection Factor Guideline Example

Table 3 Detection Factora Guideline Example
| Likelihood of detection | OCC |
| No means of detection; no process or equipment to find problem in time to affect outcome | 10 |
| Controls would probably not detect defect or failure; operator to perform self-inspection | 9 |
| Controls have poor chance of detecting defect; inspection alone to detect problem | 7–8 |
| Controls might detect defect; double inspection or inspection with equipment aids | 5–6 |
| Controls have good chance of detecting defect; process equipment detects presence of problem under most circumstances | 3–4 |
| Controls will almost certainly detect defect; process detects defect automatically | 1–2 |
aLikelihood of detecting defect before next process step, or before product leaves the manufacturing or assembly station (i.e., detection that would lower the impact or likelihood of the event).
Possible Causes: The OCC Factor
The next factor is intended to consider the possible ways in which the failure mode could occur (Figure 4). It is not uncommon for there to be several causes. An immediate cause is often defined as the step done incorrectly that would result in the problem. The root cause is found by asking the question: What would have caused that? This is asked many times until an actionable cause is determined. The point is to get to a reason for a possible problem that can ultimately be addressed and corrected. For example, it is not enough to state that the operator did something incorrectly. It is more important to look at what kinds of pressures are on the operator, how well trained the operators are, whether there are adequate instructions and pictures for the intended result, and whether the designs are possibilities for the tooling/fixturing or the product itself that could lower the likelihood of failure. A simplified fault tree (Figure 5) is a useful tool for helping to define the root causes, since it allows a pictorial way to view these types of questions and their answers. In this example, the fault tree is shown with no logic symbols. In most cases, the actions are all series—one of the lower-level causes will result in the next-higher-level event. This is not always the case. In instances where more than one contributing cause must occur, these must be shown with AND gates, implying two or more causes. This can be important, because the likelihood of two or more occurrences is much lower than that of just one occurrence. In general, for processes such as building, testing, and shipping, the causal relationships are serial in nature, so logic symbols are not needed. More detail about fault trees and their use in reliability problem solving is treated further.
Figure 4 Potential causes.

Figure 5 Simplified fault tree example: a tool for finding root causes.

Each cause listed is assigned an OCC factor. In all three factors, the values vary between 1 and 10. Table 2 is an example of how the values could be made objective and consistent. This particular example is especially useful if the process being analyzed is tracking defect data for statistical process control. In that case the sigma values represent a statistical method for estimating process issues in a quantifiable way. If these data are not available, other historical information or the judgment of the team must be used to arrive at a reasonable value for OCC.
Shown in Figure 6 are only individual causes, which are frequently found in process issues. However, if two or more causes were needed for the next-level cause or failure to occur, these would be considered in parallel. In practice, Boolean logic symbols would show when a single cause (OR) or multiple causes (AND) are needed. In Figure 6, no presence of logic symbols implies that only ORs are being used.
Figure 6 Verification method.
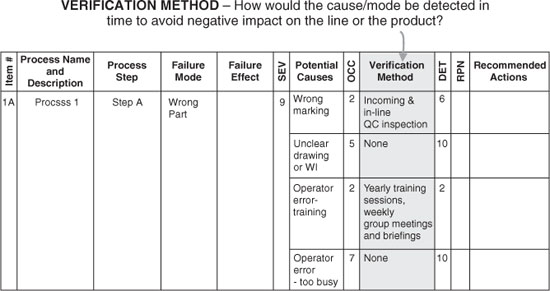
Verification Method: The DET Factor
The final factor to be determined is the detection (DET) factor. The main underlying idea is to gain insight into how well the process is set up to detect a failure, defect, or other flaw in a manner that would prevent a worsening result. Clearly, this and the SEV factors are interrelated, and the team should be flexible in its evaluation of them. Each cause has its own verification method(s) and DET values.
Questions to be addressed are:
The DET factor, then, is answering the question: How likely is it that the cause could be detected in a time or place where the effects could be mitigated? If multiple means of detection are used, all those methods would be included in evaluating the DET rank value (Table 3).
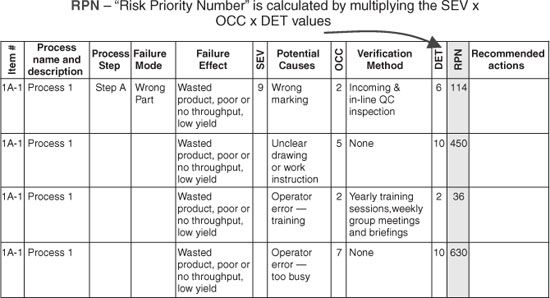
Risk Priority Number
The risk priority factor (RPN) (Figure 7) is calculated by multiplying the SEV, OCC, and DET values together. Multiplication is used in this analysis because they represent a risk tied to impact, likelihood, and reaction. Since each of the three factors can vary from 1 to 10, the product of the values will vary from 1 to 1000. By using multiplication, it is a simple matter to separate the important from the unimportant while recognizing the importance of all three factors as equal contributors to overall risk to the program. The RPN values can then be sorted from highest to lowest value, providing insight into the most important possible issues. These meet the criteria of highest impact, most likely to occur, and least likely to be detected. This method separates “the vital few” from the “useful many,” as the quality pioneer Joseph M. Juran often stated (excerpt from a Public Broadcasting System documentary, “An Immigrant's Gift: The Life of Quality Pioneer Joseph M. Juran” by John Butman and Jane Roessner, Public Broadcasting System).
Figure 7 Risk priority number.
Improvement Actions
Prioritization of Potential Issues
The point of the prioritization is not simply to select from the high-value RPNs; rather, it is to consider the higher-valued items first. It is imperative to review the actions recommended through the lens of business priorities: Are the recommendations actionable? Are they cost-effective? Are there other mitigation factors, such has human safety, to be taken into account? Some of the lower-value RPN items often have simple, low-cost solutions. These should be considered for follow-up as well. These ideas, combined with the prioritization and documented rationale from P-FMECA, provide an excellent basis for making optimal decisions.
First Address Root Cause(s)
Clearly the first place to look for effective improvements is to address the source of the issue—the underlying or root cause. For example, if the cause stems from a lack of tooling to assure proper alignment, then designing the equipment so that special alignment is not required would remove the risk altogether. If this is not possible or too costly, the next step would be to look at alignment tools in the process to decrease the risk of a mistake. “Improved training” is often chosen as a catch-all phrase in corrective actions. That is not to say that training is not important. It is. Certainly, if inadequate training is a factor, it must be addressed. However, the addition of clarifying pictures or photographs and simplified designs or steps, and assuring that the correct tools and fixturing are on hand, are often much more effective actions than general verbiage about signs or slogans, coaching or training.
Inspection is also a useful tool for catching defects, but is often overused as a corrective action. A saying among quality engineers is: You can't inspect quality in! In other words, inspections have limited impact in finding and correcting defects. Corrective actions that prevent defects—that make it easier to do right and more difficult to do wrong—are much more effective than added inspection steps. Certainly, such items as improved training and inspections can always be considered as effective additions to selected improvement actions.
Review All Three Factors
Present Recommendations to Management
Once the potential improvement recommendations are developed, the next step is to assure that they are well defined in terms that management—program, production, and design management—can understand and use. As with any engineering action items, responsible personnel, scope of effort, and schedule must be defined to assure that the recommendations are handled and reported properly to those making the decisions. These recommendations, then, must be delineated in terms of their estimated costs, so that the decision makers can evaluate the “bang for the buck” in terms of risk.
Follow-Through
As follow-up to this effort, once improvements have been implemented, or to serve as “what-if” studies, further P-FMECA updates may be made, using the initial results as a starting place and then observing the results of reconsidering the risk factors in light of the actions taken.
Reporting Results
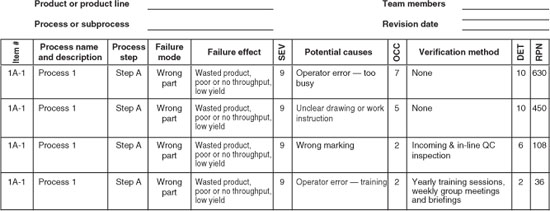
Figure 8 is an example of complete P-FMECA for the simple failure mode and causes displayed in this chapter. Note that the failure mode results have been sorted by RPN value to allow prioritization of the follow-up actions. Once these actions have taken place and their effectiveness has been evaluated, the P-FMECA can then be reviewed for changes to the existing factors to measure RPN improvements.
Figure 8 Complete P-FMECA.
The completed matrix represents a good review of the scope and level of detail covered, but this is not enough. For the results to be reported properly, a more complete assessment of the ground rules, priorities, and decisions in the performance of P-FMECA serves as a record of the complete effort. The importance of reporting results is manifold:
- The decisions, conclusions, and recommendations developed by the team are communicated in writing.
- The resents reported serve as a record of the underlying rationale behind the possible concerns and improvements developed.
- Results can help track progress after improvement actions have been completed.
- As actions are taken and risks lowered, there will be new “number 1” RPN elements. As follow-up actions are accomplishments, this analysis can serve as a road map for the next priorities and considerations.
- Future P-FMECA procedures can benefit from findings and insights reported from the initial P-FMECA.
Suggestions for Additional Reading
Electronic Reliability Design Handbook, MIL-HDBK-338B, U.S. Department of Defense, Washington, DC, Oct. 1998.
Ford Motor Company, Potential Failure Mode and Effects Analysis: An Instruction Manual, Ford, Detroit, MI, Sept. 1988
Modarres, M., What Every Engineer Should Know About Reliability and Risk Analysis, Marcel Dekker, New York, 1993.
O'Connor, P. D. T., Practical Reliability Engineering, 3rd ed., J Wiley, New York, 1992.
Procedures for Performing a Failure Mode Effects and Criticality Analysis, MIL-STD-1629A, Notice 3, U.S. Department of Defense, Wahington, DC, Aug. 1998 (canceled).