
6
Survey methods
6.1 Introduction
This chapter offers some golden rules and detailed guidance on getting the most from surveys. The main reason to run a survey is to produce statistics. This normally entails gathering data with questionnaires, but can also include polls, votes or any exercise where people answer standardised questions en masse and their responses are aggregated. If people have good questions to answer, and if they answer truthfully, surveys can provide large amounts of valuable information. These are two big ‘ifs’, of course, as detailed in section 6.2.
It looks at some advantages of surveys, along with some pitfalls to avoid. It discusses questionnaire design in detail, and some alternative survey approaches, before looking at analysing and reporting the data to produce evidence-based insight to inform decision-making and design.
Surveys
Methodology type:
quantitative
Level of participation:
consult
Time/resource needed for data collection:
low
Time/resource needed for data analysis:
medium
Useful for:
understanding site context
understanding attitudes/perceptions/values/feelings
testing/getting opinions/feedback
6.2 Survey-Based Approaches
Advantages of surveys
The great advantage of survey methods is economy of scale. They’re a quick, cost-effective way of gathering large amounts of information and generating usable knowledge, particularly on attitudes and behaviour, including:
- Investigating perceptions and opinions across large numbers of people.
- Discovering common patterns within groups.
- Comparing differences between groups.
- Gathering baseline data to assess subsequent trends or changes.
- Enabling generalisations, when sample size permits.
This versatility makes surveys a useful method throughout the design process, from identifying relevant issues at the outset to getting feedback on options, through to post-completion evaluation. They’re a familiar format for most participants, and it’s reasonably simple to create and run a survey with the user-friendly software available. Packages normally include calculation and analysis features, so statistical ability isn’t required either.
Disadvantages of surveys
Surveys, methodologically speaking, aren’t quite as straightforward to design as they may seem. It’s very easy for the questions, answer options or structure to unwittingly skew the results. I note these pitfalls not to dissuade anyone from running surveys but as a reminder that flawed surveys yield flawed information, which no one wants.
Firstly, opportunities for bias abound (see the boxed text at the end of section 6.3). Surveys rely on self-report, asking respondents to tick the box that best describes their behaviour or attitudes. However, respondents may also give what they think are correct or desirable answers; they may interpret questions in unforeseen ways, or they may under-or over-state their attitudes or behaviour. They might find the questionnaire dull and stop considering their answers carefully, or it might not include the questions or answer options they want. But their responses must still be accepted at face value.
Secondly, can the complexity of human experience and behaviour really be captured in simple answers to simple questions? A survey works fine for uncontroversial or uncomplicated topics, but not when nuanced or in-depth information is needed.
And I’m afraid there’s more. Do the findings represent the views of the silent majority who didn’t complete the questionnaire? Surveys can reflect what people usually do or prefer, but are less effective at finding out why. Behaviour and feelings may also change over time, so a dataset is a snapshot of a specific moment but has a limited shelf life, especially so in a design context where attitudes towards a proposal will often change as it develops. Don’t let this put you off using surveys; they can yield highly valuable data, but careful construction and testing beforehand are essential.
6.3 Preparation
There’s only one shot at a survey so it needs to be right first time. This means that preparation is vital, with thorough questionnaire testing and review before the survey goes live, and making sure it reaches all the target demographics: see Figure 6.1 for a suggested survey process. Double-check at the outset that survey responses will be stored securely, especially if participants’ personal details are included. And beware of consultation fatigue; make sure there are no other local consultations running at around the same time.
Sampling
The sampling strategy, in research terms, is the method of choosing participants for a project out of all the potential participants. In spatial design, the nature of the proposal and its context can determine the sampling strategy. Sometimes it’s possible to engage with all those potentially affected by a development – every household in a street, for example – so the strategy might aim for a 100% sample. But when this isn’t practicable, how to decide who participates? For a public realm proposal, the sampling strategy might focus on maximising the participation of specific groups or achieving a minimum number of responses. Is it likely that survey participants’ responses might vary according to demographic factors, postcode area and so on? If so, survey enough people to yield usable data and allow valid comparisons between groups. And if the initial survey doesn’t receive many responses from certain groups, get more responses from people in those groups until there’s enough to work with. Be prepared to make direct contact and offer active encouragement to marginalised groups to ensure they have their say. Remember that for survey results to have any reliability, groups whose views may differ from the majority must be included, and the extent of those differences understood. (This might mean a follow-up meeting or focus group, for example.)

Figure 6.1
Suggested survey process
Piloting
The piloting phase is perhaps the most critical part of the survey process. Don’t even think about launching a questionnaire without testing it first on colleagues, friends, community contacts and anyone with a few minutes to spare.
Piloting has three purposes:
- Identifying technical issues in completing the questionnaire.
- Checking whether the questions and answers are clear, and follow a logical structure.
- Noting the time needed for completion (normally longer than expected!)
Keep fine-tuning the questions and re-testing until no further improvements can be made. If there are questions with an ‘Other, please specify’ option, check for frequently occurring responses there that could be added to the multiple-choice options; also check whether free-text responses will be analysable (a word limit or different question wording might be necessary, for instance). Before going live, double-check that printed questionnaires are identical to the final online version, to ensure consistency when these responses are input manually.
Test analysis
Run some test reports on the pilot responses and/or some dummy data, and make sure that data appears in the correct format and fields, that it can be sorted, filtered and analysed to the required level of detail, and does everything else needed. Finally, ask the pilot respondents for honest feedback on the experience of completing the survey. Was it repetitive? Was it engaging? Were the answer options adequate? Did they feel there were any leading questions?
And on the subject of bias, the pilot phase is the last chance to decide whether the questions are actually going to generate the information required. Is anything missing? Are the issues relevant to the people who will be responding? Does the survey reflect their concerns and interests, or that of the design team’s? (Hint: it should be theirs, as far as possible.)
Bias Issues in Surveys
Planning
Exclusion bias | Non-response bias | Self-selection bias | Selection bias Whether a survey sample is self-selecting or invited, consider whether it will yield enough responses and give a sufficiently representative range of views.
Data Collection
Attrition bias | Procedural bias | Question-order bias
Might the data be affected by any logistical or practical factors, such as the user-friendliness of an online platform, the time period allowed for completion, or the time when it’s being run? Pay close attention to question wording and order, as these can significantly affect responses.
Analysis
Clustering illusion | Confirmation bias | Focusing effect | Illusory correlation | Observer-expectancy effect
Quantitative data allows less scope for subjective interpretation, but can still be misinterpreted. Has undue weight been given to some data? Can connections and correlations be substantiated? Does qualitative data show new insights or is the analysis only finding what was expected? Are any groups over- or under-represented?
Communication
Reporting bias
Does reporting on the data show the full range of views or just the majority view and main trends? Is the reporting objective, covering all aspects of the findings, or does it emphasise certain results more than others?
Participants
Acquiescence bias | Habituation bias | Recall bias | Serial position effect | Social desirability effect | Sponsorship bias
Survey responses can only be taken at face value and their true validity can’t be known. Participants’ answers can be influenced by whether they are bored or engaged, whether the questions are easy to understand and answer or not, and who is conducting the survey, amongst other factors.
See the Appendix for explanations of these types of bias.
6.4 Questionnaire Design
It’s easy to design a questionnaire. And it’s easy to get it wrong, so much so that this whole section is devoted to avoiding this. Wording and layout influence response rates more than any other factors, so these have to be right. Furthermore, the phrasing of questions and the answer options offered can bias the data without ever becoming apparent. So surveys offer a great way to end up with unreliable findings. To yield good information, a questionnaire needs three things: a good structure, good questions, and good answer options.
People quickly lose interest if they have to complete a lot of personal details, don’t get enough chance to express their opinions, are asked boring or irrelevant questions, or if the questionnaire takes too long to complete (anything more than about 15 minutes, for most people). Make sure they’re fully engaged all the way to the ‘Submit’ button.
Good structure
A logical questionnaire flow helps respondents comprehend questions more readily and answer more easily. Start with a short introduction explaining the survey’s purpose, who it’s for, approximate completion time (noted at the pilot stage) and guidance on completion (if questions can be skipped, or if it can be saved to finish later, for instance). The opening questions should be quick and easy for respondents to answer and put them at ease, and usually ask for factual details like age, gender, location or other necessary personal information.
Use the research strategy questions to develop the body of the questionnaire. Identify the main areas to cover, resisting the temptation to include as many subjects as possible, and refine these into no more than five topics. Then adopt the ‘funnelling’ technique to arrange the topics, putting the more straightforward ones at the start and proceeding to the more challenging. Briefly introduce the topic at the start of each section, as though changing the subject in conversation. Some questions may need routing (for example ‘If “No”, please go to Question 4’), but do this only when really necessary, to avoid potential confusion. Close the questionnaire with an ‘Any other comments’ field, some final thanks, information about next steps and further opportunities for participation, and contact details in case of any queries. Figure 6.2 illustrates the suggested structure.

Figure 6.2 Suggested questionnaire structure
Good questions
Having set the topic structure, decide the issues to cover within each topic, and translate these into good questions that will yield the information required, as shown in Figure 6.3. Questions should be closed whenever possible. Funnelling again, start with general questions within each topic section before moving on to specifics. It’s also best to ask about behaviour before moving on to attitudes.
Good questions:
- are asked in neutral terms that don’t influence the respondent or imply a preferred answer; for example, ‘What’s your view of X?’ rather than ‘Are you in favour of X?’
- are short, simple, jargon-free and phrased in a natural conversational tone
- are unambiguously worded, so respondents are unlikely to misinterpret them
- use specific measures, rather than relative terms like ‘several’ or ‘sometimes’
- ask about one thing at a time
- use concepts and language that will be familiar to respondents, explaining anything that may be unfamiliar
- cover subjects that respondents are likely to know about or have an opinion on
- seek views on a range of alternatives where they exist, rather than asking only about a single/preferred option. (‘Which of these features would you prefer?…’ rather than ‘Would you like X?’).
On some issues, some answers can be considered more socially desirable or acceptable than others. These areas may be best approached indirectly; rather than asking for a view straight out, start a question with, for example, ‘Some people think X …’ or ‘People sometimes believe that Y … To what extent does that reflect your view?’ Likewise, it can be better to gently broach sensitive topics, with questions like ‘Have you seen or heard anything lately about X?’
With the main body of questions drafted, then – and only then – decide what demographic information to ask for. This should be details with direct relevance to the research objectives, which are specifically required. If age or household income information is needed, provide age groups or income bands to select from. Anonymised questionnaires yield more honest answers, so ask for names and contact details only if necessary, or make this optional. Either way, exclude them from the dataset used for analysis, so that responses can’t be traced to individuals.
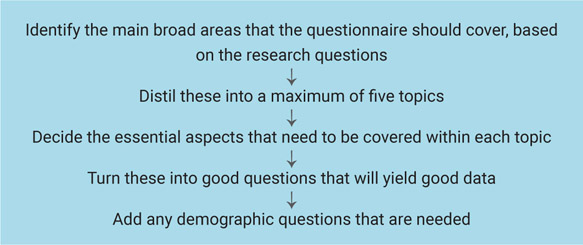
Figure 6.3
Deciding questions
Good answers
Good answer options give respondents a meaningful and comprehensive but concise selection of response options. Always offer an equal number of positive and negative response options; an unbalanced spread biases the results. Questions generally require a neutral option (‘Don’t know’, ‘Undecided’ or ‘Neither’, for example). These and no answer are valid responses, and are still informative. Deploy open questions and ‘Further comments’ free-text boxes sparingly (three’s considered the maximum) as they take more time to complete and analyse. If there are more than three, look at reconfiguring them as closed questions or incorporating them into another stage of the research where qualitative data is gathered, such a focus group or workshop.
There are many different ways to offer answers to questions about opinions or behaviour. Participants find questionnaires more engaging if answer formats vary, and they may then consider the questions more carefully. So include a variety if possible. See p. 93 for a selection of common answer formats to choose from.
Multiple choice: respondents select one answer from a list of options. Include an ‘Other, please specify’ option if an exhaustive list of possible responses isn’t feasible.
Example: Which of these features would you most like to see on the estate?
- ☐ Community garden
- ☐ More lighting
- ☐ Other, please specify......................................................
- ☐ Bike storage
- ☐ More trees
- ☐ Play area
- ☐ More seating
Checklist: respondents select all the answers that apply, or a specific number of items (for example, top three) from a list. People won’t read to the end of a long list, so about 10–12 items is the maximum. Example: Which are the three features you would most like to see on the estate?
Ranking: respondents list items in a specified order, for example, order of importance, priority or preference. Example: Please rate these possible new features in order of preference, with 1 as the one you’d like most:
Attitude measurement scales: these gather information where answers range across a spectrum, such as strength of feeling about a subject or frequency of activity. Some common scales are: Likert scale: probably the most familiar format, widely used for measuring attitudes. Respondents select from a scale ranging from, for example, ‘Strongly agree’ to ‘Strongly disagree’. Symbols like smiley or sad faces can replace text, if this suits the audience better. Always offer an equal number of options on both sides and a neutral midpoint option. Example: It would be good to have a community garden on the estate:
Numerical scale: another very common attitude scale, for example, ‘What is your level of concern about X, on a scale of 0–10?’ This scale also needs an odd number of answer options to allow a neutral choice. Example: What’s your perception of levels of antisocial behaviour on the estate, on a scale of 0–10, where 0 is ‘None’ and 10 is ‘Very high’? Behavioural scale: respondents report their past and/or likely future behaviour, for instance ‘How often do you visit X?’ Select from
Example: If there was a community garden on the estate, would you consider getting involved in looking after it?
Semantic differentiation scale: paired opposites of adjectives are presented at ends of a spectrum, and respondents mark where their view or response lies. Example:
The estate feels: Safe . . . . . . . . . . . . . . . Unsafe The estate feels: Friendly . . . . . . . . . Unfriendly
Constant sum scale: respondents distribute 100 points (or pounds, or any other unit of measurement) across a number of categories according to their preferences; they can allocate their points to as few or as many categories as they wish, and decide the number of points to allocate (the calculations need to be made automatically for accuracy). Useful for a more in-depth understanding of priorities. Example: You have 100 points to divide between the features you’d most like to see on the estate. You can give all the points to one feature, or share them out. Give the most points to features that are most important to you. You have to use all 100 points.
6.5 Running Surveys
So the questionnaire is honed and tested to perfection. Now it needs to be launched, via as many communication channels as possible. If households in the immediate vicinity of the proposed development could be especially affected, consider door knocking; approach local businesses in person too. A presence at local events and out on the streets, close to the site and/or at busy places, with fliers to give out, can also be good ways to publicise the survey, discuss the issues with people and boost response rates.
Make sure participants have easy access to relevant background information, such as plans, explanatory documents, images, visualisations, maps and videos; surveys have much more value when they reflect informed opinions. Participants will often want to see the results, so add a sign-up for the mailing list. Include a reassurance that data will be held securely and won’t be passed to any third party, particularly if personal details are included or if the development’s contentious for any reason. In the interests of building trust, be transparent about who’s collecting the information for whom, and for what purpose; this can affect how people respond to questions (see ‘Sponsorship bias’ in the Appendix, on p. 179).
6.6 Alternative Survey Methods
Who says surveys have to mean questionnaires? There are lots of ways to get people to share their views without ticking boxes. With some imagination, creativity and enthusiasm for interacting with people in their everyday locations, alternative survey approaches can be more engaging for participants and may yield insights that a standard questionnaire format won’t. These aren’t suitable methods for in-depth investigation or more sensitive topics, but can be a good way to raise the profile of the engagement programme, taking it to where people are and starting a dialogue. This is essential in areas with communities who are less likely or able to participate in standard consultation processes. These methods could be:
- Site-specific events referencing the locality. For example, at a seaside location putting out deckchairs and inviting people to sit and write a postcard about the area.
- Pop-ups and mobile street stalls. These could offer survey cards and suggestion boxes, and/or graffiti boards and post-it notes. Alternatively, offer small chalkboards or whiteboards for participants to answer a question on and then photograph them (which also provides demographic context).
- Food carts. Offering a free drink or an edible treat in exchange for answers to some questions gets good response rates from all groups, and also communicates a sense of valuing the community.
- Walks. Arrange group walkabouts, or a short self-guided walking route with a set of questions or topics to respond to.
- Photos. Give picture frames to participants and ask them to photograph (or take selfies of) local features that they like or would like to improve: a good way to engage young people and people for whom language or literacy might be a barrier to giving written responses.
There are now increasing numbers of sophisticated online platforms offering suites of participation methods suitable (although not designed exclusively for) spatial design projects, with features like polls, forums, presentations, live chat, live video, interactive maps and virtual site visits. The rapid take-up by local authorities, practices and clients undoubtedly shows a desire to explore new forms of participation. Nonetheless, asking lots of people the same questions, then aggregating, analysing and reporting the results is essentially a survey process whether the interface is a pop-up street stall, a basic questionnaire or high-tech participation software.
6.7 Working with Survey Data
The first thing to do once the survey period has ended is to log the batch of survey responses in the data library. The second thing is to clean the data, removing duplicate or unusable responses, correcting any obvious typing mistakes that could affect the analysis, deleting responses to questions that should have been skipped, and any other preparation to ensure the data is error-free and analysable. If paper-based questionnaires were completed, remember to add these responses manually to the rest of the data.


Figures 6.7–10:
Surveys don’t have to mean questionnaires
Checking the data
There are some checks that are worth performing before beginning any analytical work.
Firstly, look at the response rate. How does the number of potential respondents (if known) compare with the number of completed questionnaires? The number of completed responses compared to total number of survey website visitors can be also interesting. There’s no standard definition of a ‘good’ response rate; it depends partly on the nature of the community surveyed. A low rate might still be representative in a more homogenous neighbourhood, whereas a higher rate will be preferable somewhere that a diverse range of views is likely.
Secondly, in a larger scale survey, check how far responses reflect local demographics, if possible. Are any groups especially over- or under-represented? If so, this needs to be borne in mind at the reporting stage, and it might be necessary to invite some groups directly to submit their views for more representative findings. The demographic breakdown of respondents will never precisely mirror the local population, but try and identify any major imbalances before drawing conclusions from the data.
Finally, check to see how many respondents dropped out of the questionnaire, and where; it reflects on the questionnaire design. A high drop-out rate can indicate that a questionnaire was too long, boring, difficult to understand or didn’t ask relevant questions. If participation isn’t pitched at the right level or capturing people’s interest, this should be addressed before the process goes much further.
Analysing the data
Queries and reports can be run now. Any survey software will offer some analytical functionality, but it may be preferable to import the data into a spreadsheet to work on. There will be a mass of numerical data, and if open-ended questions were included, there will be text-based answers to analyse as well. Starting with the number crunching, keep this aspect of the analysis simple, unless a stats expert is available. Identify the obvious headline figures, such as strong majority views or trends, for instance, and also issues where opinion is clearly divided. Where there are no strong signals from the responses, it’s enough to note that the data is inconclusive.
If a good cross-section of the community has responded in sufficient numbers, the data may allow comparison between groups: looking at responses according to postcode or demographics, for instance. Small samples don’t allow valid comparisons, and neither do responses from groups of fewer than ten within the dataset. But if the data permits, check whether responses from specific groups differ much from the whole and report any significant variations; it’s important that the majority view isn’t perceived as representative of the whole community. Remember that comparisons between percentage figures need careful wording to avoid misunderstandings. For example, if 30% of respondents want Option A and 60% want Option B, this is often mistakenly expressed as ‘30% more people preferred Option B to Option A’, when in fact 100% more – twice as many – preferred Option B. Also remember to be clear that figures refer to the percentage of those who responded to that question, which may or may not be many of the total respondents, or a representative sample overall; see ‘How to lie (unintentionally) with statistics’ at section 9.2 for a real-world example.
Analysing free-text responses requires a different approach. If answers to the ‘Other’ option in multiple-choice questions are short and simple, it might be possible to treat them as quantitative data that can be roughly grouped and counted (an exception to my general advice not to render qualitative data as statistics). Longer and more detailed responses to open-ended questions require the most work. It may be that the research objectives can provide a structure for categorising these initially. It’s likely more detailed work will be needed, however, depending on the volume and length of responses. Methodical approaches are set out in the ‘Quick guide to analysing qualitative data’ on p. 60, which looks for themes and connections in the responses, grouping and regrouping the data in different ways to make sense of it as a whole. In analysing free-text responses, be open to any unexpected issues that seem significant and note them in the analysis even if they weren’t in the initial strategy.
The design team, respondents and the client will often find a one-page summary of the headline figures helpful, covering findings on key issues and other significant results. Graphs, charts and infographics make research results more intelligible to many people, so include plenty of illustrations. Be transparent in reporting the results and represent the whole range of views, not just the majority or those who support the proposal. The purpose is to inform the design and work with the public response, so be open about the feedback received. Check the ‘Quick guide to reporting research’ on p. 136 for more guidance on presenting findings and messages.
6.8 Key Points Summary
> Surveys are a reliable method of collecting data on a mass scale and straightforward for most people to engage with.
Questionnaire design needs careful handling and constant alertness to the possibility of bias.
Clear wording and layout, neutrality and asking only essential questions are key to a good questionnaire.
Include a variety of answer formats to make the questionnaire more engaging for respondents.
Ensure that as many people as possible get the opportunity to respond and make direct contact with those who might not participate to ensure their views are included.
Thorough piloting, review and fine-tuning are essential before a survey goes live; there’s only one chance to get it right.
Clean and prepare the data before starting analysis, and check for representativeness and balance. It may be necessary to obtain more responses from some groups before a meaningful analysis can be undertaken.
Look for any significant differences in opinion or experience between specific groups and the overall majority.