Droplet-Assisted Laser Cleaning of Contaminated Surfaces
José Manuel López López1, Sundar Marimuthu1 and Alhaji M. Kamara2, 1Loughborough University, Loughborough, United Kingdom, 2University of Sierra Leone, Freetown, Sierra Leone
Abstract
Surface cleaning is becoming increasingly important in modern manufacturing. Traditional cleaning processes are predominantly thermal processes and may not be applicable for the next generation of devices that include parts manufactured at the micro/nanoscale that are sensitive to heat and abrasion. This problem with such parts can be overcome by a new surface-cleaning technique called droplet-assisted laser cleaning (DALC). The DALC uses a Q-switched Nd:YAG laser to vaporize a stream of water droplets to produce a succession of impacting shock waves at the surface of the component of interest. The generated shock waves can be used for various material processing applications, including removal of contaminants. The process exploits the combined potential of laser shock cleaning (LSC) and optohydrodynamic processing through explosive vaporization of water droplets. In this chapter, we discuss traditional laser cleaning processes from direct beam/contaminant interaction to LSC. The DALC process discussed in this chapter was specifically designed to induce explosive vaporization of a 300-μm water droplet above the contaminated substrate surface. The shock pressure magnitude was analyzed using high-precision force and acceleration sensors. The effect of laser energy, number of pulses per position, gap distance and scanning speed on the cleaning performance was investigated in detail. A contaminated substrate with micropolystyrene particles was used to evaluate the performance of the DALC system, and the results, in comparison to those obtained from the traditional LSC process, show that DALC can be an excellent alternative to the existing laser-based cleaning process (ablation and shock).
Keywords
Cleaning; droplet; liquid; Nd-YAG; laser; shock; vaporization; ablation
1 Introduction
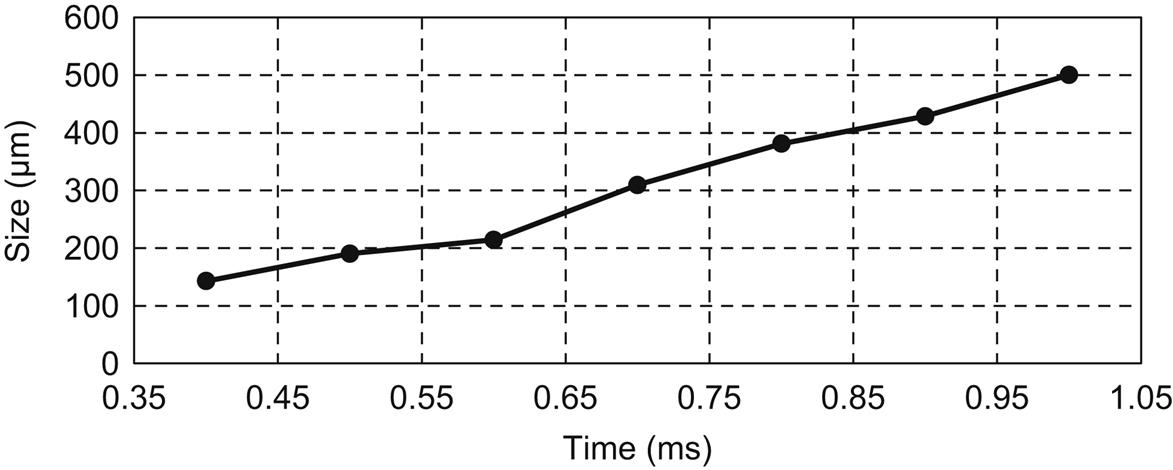
There is an increasing demand for high-performance materials, many of which are incompatible with conventional manufacturing processes due to their heat and abrasion sensitivity, e.g., carbon fiber–reinforced polymer, polymers, thin films, semiconductor wafers, etc. Surface preparation of these advanced materials is usually essential to exploit enhancement of their properties in engineering applications. The most common surface preparation technique involves the cleaning of the materials. Nowadays with component size on the order of the micrometers or nanometers, a few dust particles may cover the whole component, and the effect of these contaminants becomes more and more critical [1,2] since particles below the micrometer size adhere to a surface with a force greater than 106 times their own weight [3]. Of particular importance is the Joule effect, because of which a slight fluctuation in temperature of few degrees can damage devices too tiny to dissipate heat (microscale components); and when the particle diameter exceeds one-fourth of the minimum feature size, the contaminant could cause total device failure [4]. Fig. 5.1 presents the change in average transistor size over the years. Currently (2016) the size of a transistor is around 10 nm, which is smaller than the size of most contaminants.

The conventional industrial practice for surface cleaning is to use mechanical [6,7] or chemical [8] treatments that are widely used in many industrial manufacturing processes because of their high efficiency and fast results. These conventional cleaning methods are currently carried out as manual processes using multiple stages (up to four steps) and are labor intensive. The processes require skilled operators and careful inspection to ensure uniform removal of material, especially for sensitive surfaces and soft materials. Furthermore, the operator is exposed to hazardous materials, giving rise to significant environmental, safety, and health concerns. All these negative characteristics prompted the search for alternative techniques that improve or solve if not all, at least some of the concerns [9].
2 Laser-Based Cleaning Techniques
2.1 Ablative Laser Cleaning
Laser cleaning has been considered as a more controllable and environmentally friendly alternative to mechanical/chemical cleaning and is capable of removing particles around 100 µm diameter. In ablative laser cleaning the particles are removed predominantly due to the thermal effect that occurs during laser–material interaction.
The interaction between the laser beam, the surface, and the particle depends on many parameters including laser intensity, pulse duration, number of pulses per position (NOP), and the properties of the materials. In particular, the beam properties play a central role in the ablative laser-cleaning process. Fig. 5.2 shows the effect of laser intensity (I) and pulse duration (τ) on the cleaning of stainless steel. As can be seen from the figure, cleaning can be achieved for suitable laser pulse widths, typically between 1 and 100 ns. In addition, a too-short pulse duration can result in surface damage, while no cleaning is observed at long pulse duration.

Short and ultrashort pulsed laser-cleaning technologies have been successfully used for cleaning of metals and alloys [10,11]. Although ultrashort laser pulses interact with a thin layer of material, the substantial risk of thermal damage associated with the traditional laser cleaning process in heat-sensitive materials has been probed [12]. Small volumes cannot dissipate sufficient heat and thus lead to device breakdown. Furthermore, short and ultrashort pulsed laser cleaning is not effective in removing small particles (in the range of micrometers). This is attributed to the fact that the inertial force (mass (m) times acceleration (a)), according to Eq. (5.1), depends on particle radius (R) in the form of R3 after expressing the mass in terms of volume (V) and density (ρ), whereas the adhesion force (Fadh) depends linearly on the particle radius (Eq. 5.2). Combining Eqs. (5.1) and (5.2) implies the acceleration is directly proportional to R−2 (Eq. 5.3) [13].
(5.1)
(5.2)
(5.3)
Typically, the acceleration needed for removing the contaminant is about 107 times higher than gravity for 1-µm diameter particle [13,14]. As the particle size is reduced to this size or smaller and the beam size cannot match the particle size, other problems are encountered. For example, a large part of the beam energy interacts directly with the sample instead of the particle. Also, some contaminant particles are smaller than 10 nm, which is much smaller than the diffraction limit. Even lasers with the shortest wavelength, such as excimer lasers, which are between 200 and 300 nm, will experience diffractive effects [15]. These problems result in a drop in the efficiency of the direct laser-cleaning techniques.
2.2 Laser Shock Cleaning
Laser shock cleaning (LSC) has been proposed as a solution to thermal damage-free cleaning as it works without direct contact with the workpiece. In LSC, a laser beam travels parallel to the workpiece substrate and is focused close to the region of interest. The laser beam ionizes the air at the focal point if the energy density is high enough, creating a shockwave that removes surface contaminants. The shockwave produced in LSC by the breakdown of air is, however, relatively weak and can only be used to remove light particle contamination [15–17]. Fig. 5.3 shows a typical shock laser-cleaning process, in which a shock propagates spherically and interacts with contaminant particles. The magnitude of the shock varies with distance and cleaning occurs when the shear component of the shock is higher than the adhesion force of the contaminants [16].

The performance of LSC depends on the laser fluence, laser wavelength, distance from the particle (not just from the sample), particle size, and the adhesion force between the sample and the contaminant particle. Fig. 5.4 shows the effect of LSC on a Si wafer contaminated with silica particles. LSC is efficient for cleaning particles, as only 5–6 pulses are needed to clean a 20-cm radius wafer with sub-micrometer silica particles with no physical, thermal, or electrical damage [18]. However, the gap distance between the laser focal point and the substrate is critical in LSC. The shock generated during LSC attenuates exponentially with distance, and hence, the removal efficiency decreases exponentially with increase in gap distance [16]. Perhaps the principal drawback [15,17] of LSC is the need for high fluence or an extremely short pulse to ionize the air.

2.3 Wet Laser Cleaning
Wet laser cleaning (WLC), which involves laser interaction with a liquid film close to the surface, was proposed as a means to remove hard contaminants from metals and ceramics [13]. A thin liquid film deposited onto the contaminated surface is irradiated with a nanosecond pulsed laser. The resulting sudden evaporation of the liquid film leads to high transient explosive forces, large enough to remove particles from the surface. Typically infrared (IR) lasers, like CO2 transversely excited atmospheric lasers (10.6 µm), are used due to their high absorption in water [19]. WLC is a cumbersome process that is difficult to control and often results in undesirable surface chemistry (including oxide layer formation).
To overcome the issue of insufficient shock pressure in LSC, Kim and coworkers [20] proposed a combined LSC and WLC process. In this process, the WLC weakens the contaminant–substrate adhesion [20,21] and the subsequent LSC removes the contaminants. The potential of combined LSC and WLC to clean thick contaminants from metals and ceramics was also investigated. Although this process showed improved cleaning performance, there were issues of uncontrollable process parameters and complex dual-laser setups [16].
2.4 Laser-Assisted Optohydrodynamic Cleaning Process
In 2012, Kim and coworkers [22] developed a laser-based spray material-processing technique. In this process, a high-speed (~1600 m/s) sub-micrometer liquid jet produced with the aid of laser-induced plasma is used for material-processing applications, including cleaning and micromachining of metals. Fig. 5.5 shows the mechanism of a typical optohydrodynamic cleaning process. In the process, laser-induced breakdown of a micrometer-sized water droplet produces a high-speed jet (with speeds up to 1600 m/s), which removes particle contaminants from the substrate. Again, this method has the disadvantage of being a semi-dry process.
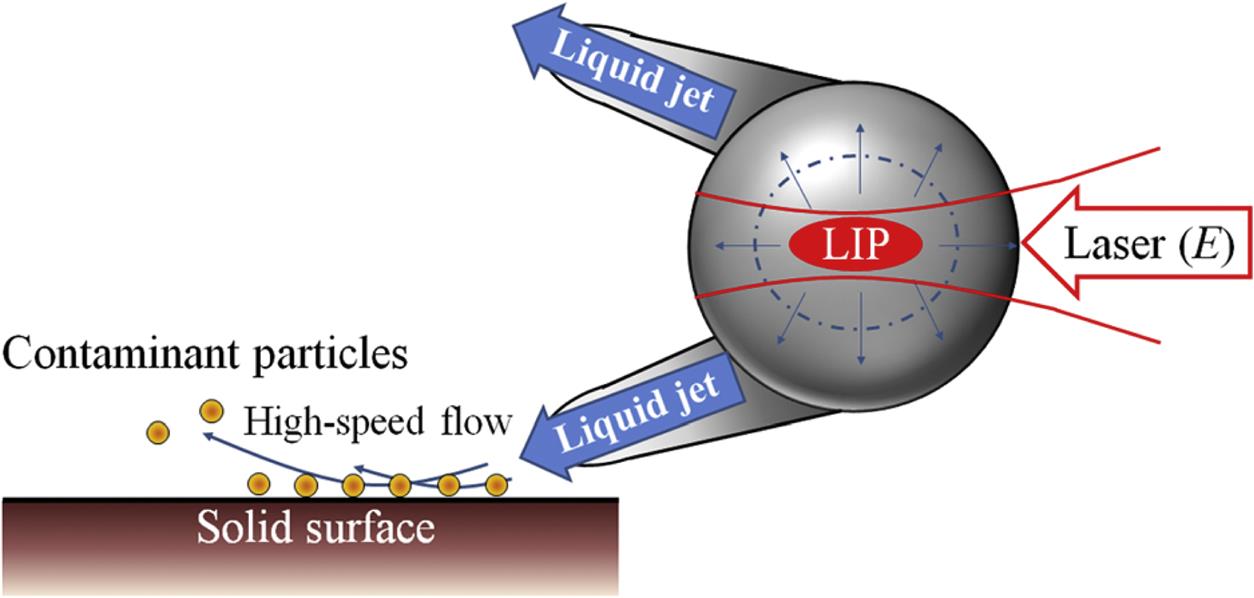
The performance of the optohydrodynamic cleaning process depends on various factors, including laser energy, the relative position of the droplet, the gap distance between the droplet and the surface, and NOP. Fig. 5.6 shows the performance of the optohydrodynamic cleaning process in removing 300-nm polystyrene latex particles from a Si wafer.
3 Droplet Assisted Laser Cleaning
Droplet assisted laser cleaning (DALC) is a new manufacturing technique that exploits the combined potential of laser shock processing and optohydrodynamic processing through explosive vaporization of liquid droplets. Apart from the fact that the substrate surface remains undamaged, the DALC process can work effectively for any materials including metals, polymers, dielectrics, and particulates, irrespective of the operating wavelength, which only affects the liquid.
The developed DALC system was evaluated for cleaning micropolystyrene particles. In comparison with LSC, the magnitude of DALC shock is substantially higher because the DALC shock is generated in a relatively dense medium. The results show that the DALC process is more attractive for surface treatment applications of a new generation of materials, since it is efficient, is carried out as a dry operation, and operates at low temperature. To develop a scientific base, it is necessary to investigate the possible mechanism responsible for the contaminant-removal process, which is also discussed in this section.
3.1 DALC Experimental Setup
A schematic of the experimental setup used to perform DALC is shown in Fig. 5.7. The laser source used is a Litron Nd:YAG lamp-pumped laser, which operates at a wavelength of 355 nm, pulse duration of 8 ns, and maximum pulse frequency of 10 Hz. The laser beam was focused using a 300-mm spherical focal length lens onto a 300-µm diameter spot. Precise control of the lens-to-mask distance and lens-to-workpiece distance was ensured to achieve a laser beam size of 300 µm over the laser–droplet interaction zone.

Synchronization of the system uses the laser as a master signal. Its phase is shifted using an arbitrary function generator (AFG). The new signal is amplified and feeds the droplet pulse generator. The phase delay can be varied manually until the light and the droplet meet. As control system, an oscilloscope registers the master and the shifted signals. The laser signal also feeds a strobe light working at the laser frequency, which allows recording of the laser–drop interaction.
The microdroplet was generated using a Nordson PICO valve (LV-20) and Nordson controller (DCON). The droplet generator is capable of generating water droplets at sizes ranging from 100 to 500 µm. The droplet quality depends on nozzle size (droplets cannot be outside the range), air pressure, and nozzle pulse time. The air pressure affects both size and speed of the droplets, and influences the repeatability of the droplet. High gas pressure can result in droplet breaking and low pressure can cause nozzle clogging.
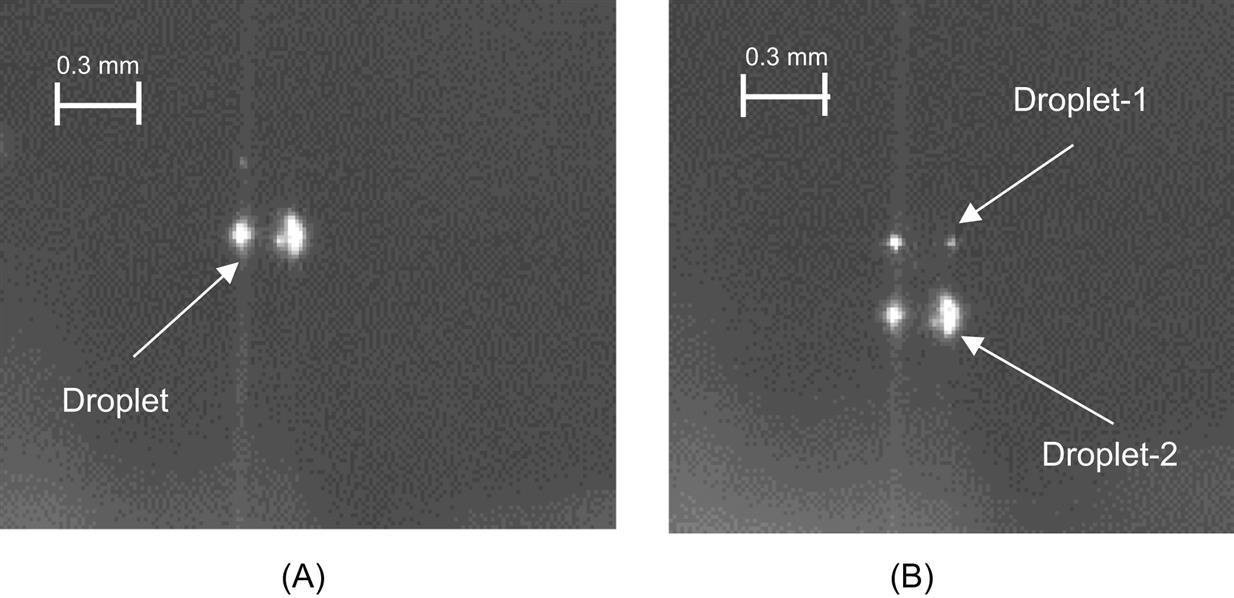
Fig. 5.8A shows the photographic image of a good single droplet, while that of a multidroplet scenario is shown in Fig. 5.8B. Nozzle pulse time refers to the length of time the nozzle is open. The size of the droplet is directly proportional to the nozzle pulse time. As can be seen in Fig. 5.9, the droplet size grows linearly with the nozzle pulse time for a constant pressure. The measurement of the droplet size was carried out using a green diode laser and a fast photodiode.
The laser and the droplet generator were synchronized such that each laser pulse from a Q-switched laser hits a liquid microdroplet at a specified height and location from the substrate sample. A three-axis linear stage was used to move the sample relative to the droplet/laser focus. The laser lamp signal was used as the main clock signal, which fed a strobe light and an AFG (used to control the delay) connected to the water dispenser. The laser interaction with the droplet was recorded using a CCD camera.
The cleaning performance of the DALC system was evaluated by removing micropolystyrene particles of size 10–50 µm from a 50 mm ×50 mm ×1 mm thick mild steel substrate. Preparation of the samples involves cleaning of the steel substrate with isopropanol (to remove undesired contaminants), application of micropolymer particles by spray coating and finally, removal of loose polymer particles by compressed air jet at 2 kPa (2 bar). The cleaning experiment was initially performed at a single spot to find the cleaning thresholds for removing the polystyrene microparticles. This was followed by cleaning tests over a line by moving the substrate to find the cleaning characteristics that resulted from different parameters. Optical microscopy, scanning electron microscopy (SEM), and energy-dispersive X-ray spectroscopy (EDX) were used to examine the samples.
3.2 DALC Results
The DALC experiments were performed in two stages, first with stationary spot cleaning, then with linear cleaning. Experiments were performed with various energies, gap distances, and NOPs.
Fig. 5.10 shows the effect of laser pulse energy and NOP on cleaning width (or diameter) for a constant gap distance of 1 mm. As can be seen from the figure, the cleaning width shows a linear relation with pulse energy and NOP. For a low energy of 25 mJ, the maximum cleaning width was reached with four pulses and no further improvements were observed with increased NOP. With conventional laser cleaning, the cleaning width is almost similar to the beam size at the workpiece surface. However, it can be deduced from the figure that the shock generated in DALC can be effectively used to clean a much bigger area.
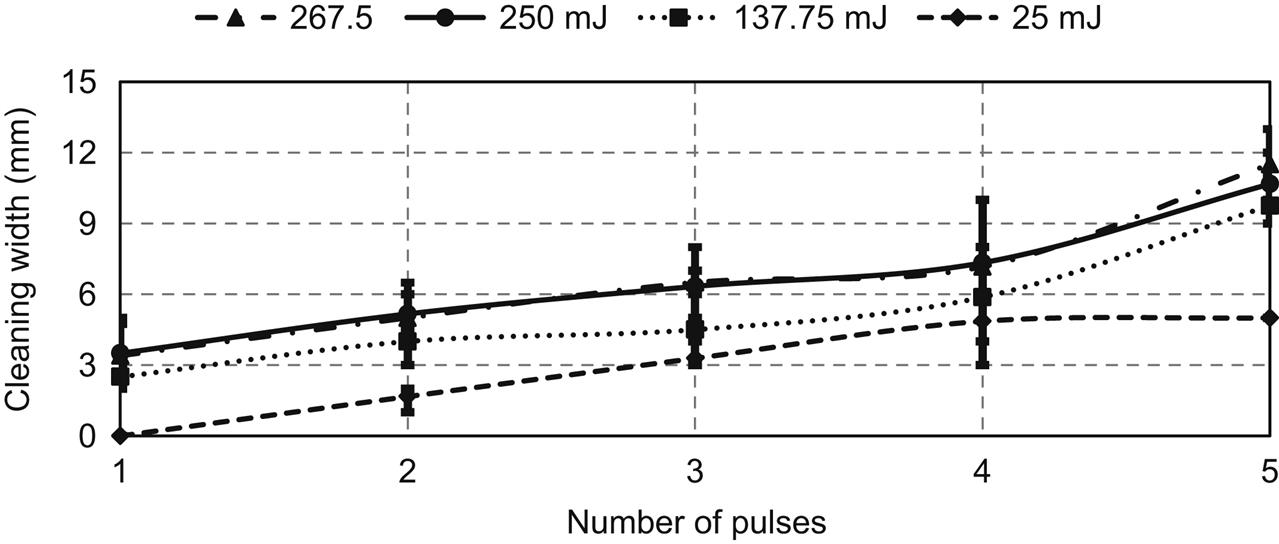
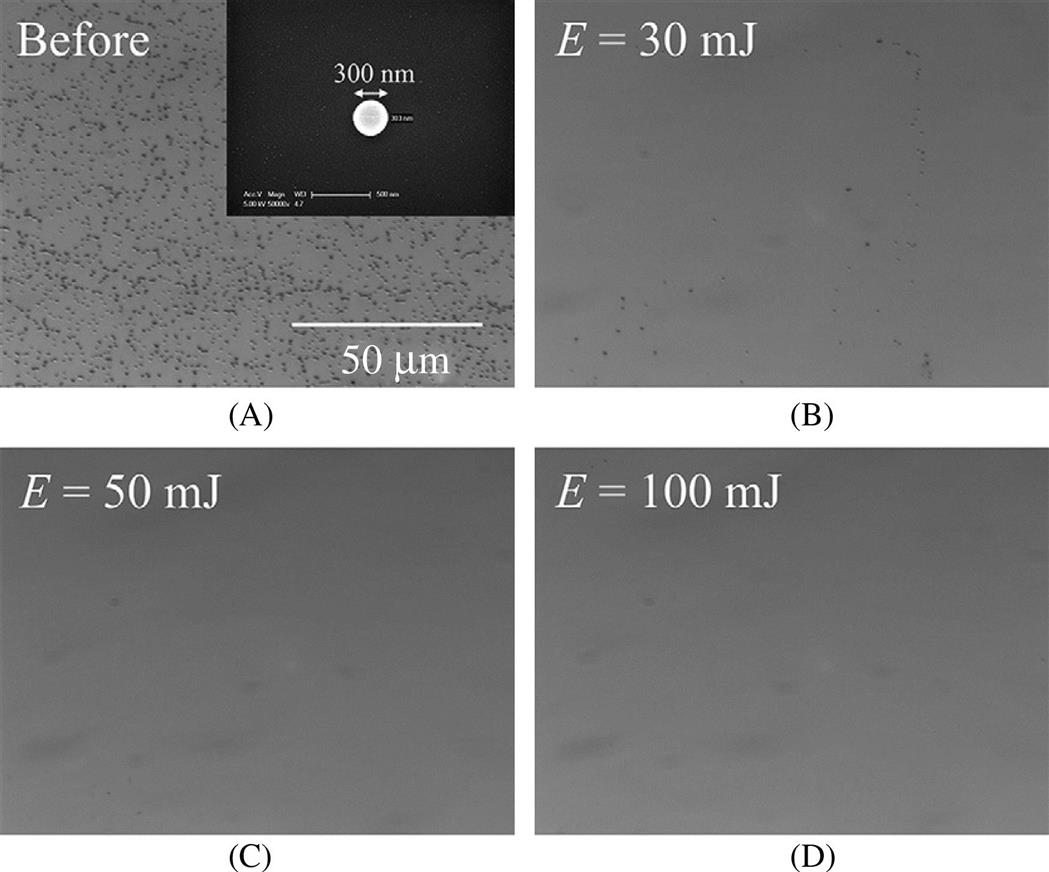
Fig. 5.11 shows SEM images of the DALC sample at a constant gap distance of 1 mm, and 3 pulses per position, and for various laser pulse energies. The SEM images were taken at a distance of 3 mm from the explosion center. As can be noticed from the figure, increase in pulse energy results in greater particle removal. This should be related to the magnitude of the shock. It is expected that the increase in energy will result in increased shock magnitude, and hence higher cleaning.

Fig. 5.12 shows the effect of the gap distance on the cleaning width for various laser pulse energies. High laser energy (250 mJ and above) shows good cleaning performance for a range of gap distance compared to low laser energy (25–137.75 mJ). Also apparent from the figure is that the cleaning performance drops sharply after a certain threshold gap distance. This is possibly due to the fact that the shockwave pressure decreases faster with distance.

Once the threshold for stationary DALC was established, the experiments were extended to linear line processing with moving laser beam. The parameter selection for DALC of a line using continuous scanning was based on the input parameters and response of the stationary DALC. With linear line cleaning, the vital parameter for complete and effective cleaning of the contaminants is the scanning speed, S, with which the substrate has to move during the process; this can be initially approximated using Eq. (5.4) as:
(5.4)
where Ns is the number of pulses required to remove contaminants as estimated from the stationary laser beam cleaning process, νm is the frequency of the apparent moving laser beam, and Lm is the size of the laser beam in the scan direction.
Fig. 5.13 shows the effect of the scan speed for a linear DALC. As can be seen from the figure, the cleaning width is directly proportional to the laser pulse energy and inversely proportional to NOP. The linear line cleaning follows the same trend observed with spot cleaning.
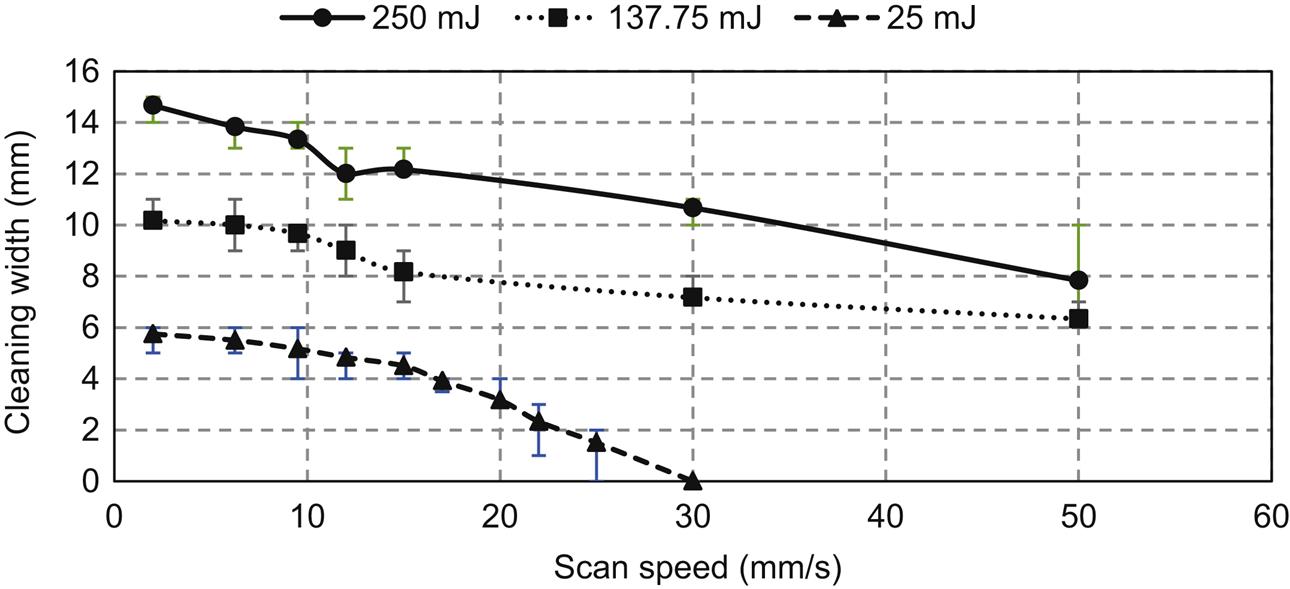
Fig. 5.14 shows optical and SEM images of the DALC sample, cleaned at a scan speed of 15 mm/s and laser energy of 250 mJ. The SEM image shows the cleaning performance at the center of the track, along the cleaned–uncleaned interface and uncleaned region. As can be seen from the figure, the DALC system exhibits the capability to remove microparticles from metal substrate.

To further analyze the performance of the DALC process, EDX measurements were performed on the sample before and after the DALC process and the results are given in Table 5.1. As seen from the table, the original substrate shows high carbon, low iron, and high oxygen, which indicates a contaminated substrate. The DALC process samples show surface composition in line with the composition of the steel substrate.

3.3 Discussions of DALC Process
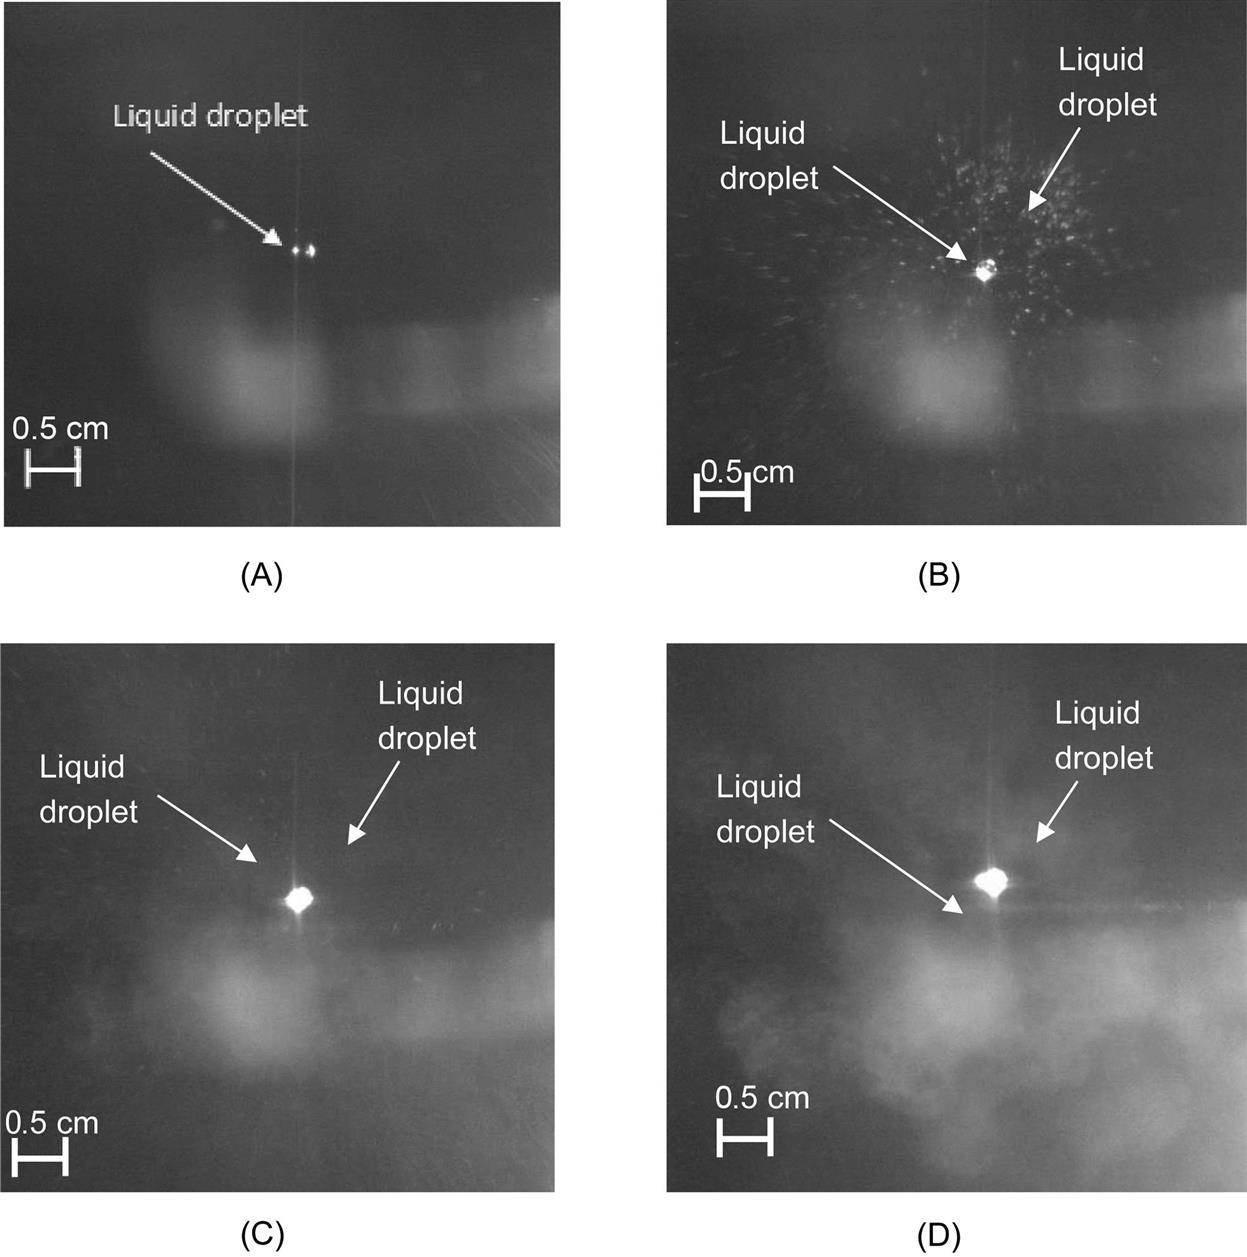
Fig. 5.15 shows images obtained during laser–droplet interaction at various laser energies. At low energies (25 mJ), it can be seen that the liquid explodes into several microdroplets, similar to earlier observations with the optohydrodynamic process. A mixture of optohydrodynamic and partial vaporization of the droplet was observed at relatively high laser energy (137.75 mJ). At higher energies (250 mJ), a foglike feature was observed; this indicates complete droplet vaporization and aerosol formation. Laser energy below 137.5 mJ results in optohydrodynamic material processing [23] and laser energy more than 250 mJ follows shock-based material processing [10,16,17].
It is often the case that the emissions during laser–material interaction contain information regarding the molecular species and atoms in the plasma plume [24] that can be measured with a spectrometer. Fig. 5.16 shows emission spectra without any droplet. The figure further shows that the only emission present is that which corresponds to the laser wavelength, meaning that the laser on its own does not ionize the air at any point, otherwise the spectrometer would have recorded other peaks. The different energies show different intensities for the peak laser wavelength.

Fig. 5.17 shows emission spectra observed during the laser–droplet interaction. As can be seen, laser energy less than 25 mJ produces negligible emission, which could lead to droplet breakup without significant vaporization. It is further seen that increase in laser energy results in increased emission, leading to droplet breaking and partial vaporization. It is expected that shock pressure will be generated only during the vaporization of the droplet and that the DALC with laser energy of 25 mJ operates like an optohydrodynamic process. Depending on the surface condition, both the optohydrodynamic and shock processes can be used for cleaning.

Fig. 5.11 shows that shock processes produce better cleaning performance for removing microparticles of size ranging from 10 to 50 µm. The increase in the magnitude of the emission is saturated at 250 mJ, and further increase in laser energy fails to increase the strength of the emission. This confirms the fact that the 300-µm droplet undergoes complete vaporization at 250 mJ, and further increase in energy does not change the laser–droplet interaction mechanism. This is in line with the observations in both Figs. 5.10 and 5.12, in which the DALC performance gets saturated at 250 mJ.
Force and acceleration sensors were used to assess the magnitude of the shockwave generated during the droplet vaporization. It is expected that complete vaporization of the droplet by a nanosecond laser should result in an impulse shockwave around the interaction zone. Fig. 5.18 shows the schematic of the experimental setup used to estimate the magnitude of the shockwave using force and acceleration sensors. The force sensor was kept over a rigid body, whereas the acceleration sensor was kept hanging from a string close to the laser–droplet interaction zone.

Experiments were performed for various values of laser energy and gap distance (i.e., distance between the sensor and laser–droplet interaction zone). Figs. 5.19–5.21 show the measured force, acceleration, and shockwave pressure, respectively, for various values of gap distance and laser energy. As can be seen from the figures, laser interaction with the droplet generated significant force, which can be used for various material-processing applications. Another important observation was that the force and acceleration increase with laser energy up to 250 mJ, and no further increase was observed beyond 250 mJ of laser energy. In addition, reduction in the gap distance was found to result in higher shock magnitude.


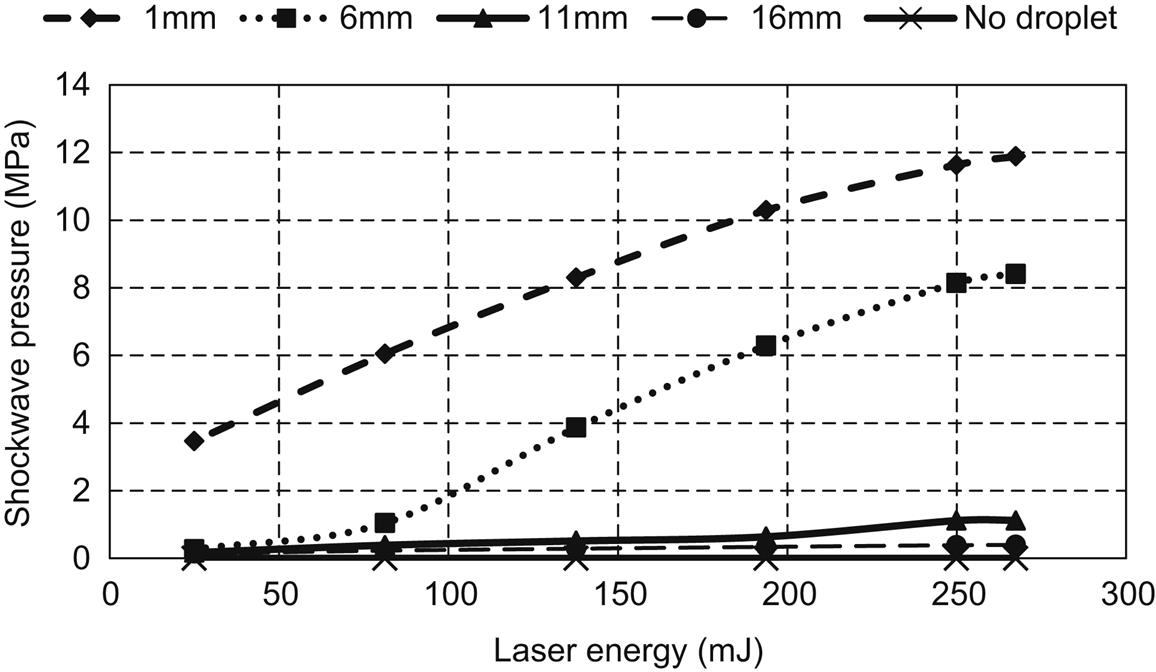
The magnitude of the shockwave pressure generated for various values of laser energy and gap distance is shown in Fig. 5.21. An accelerometer was used to measure the velocity (m/s) and was converted to shock pressure (Pa) in terms of volume of the droplet (m3), mass of the droplet (kg), shock duration (s), and shock area (m2). The figure shows a linear increase in pressure up to a laser energy of 250 mJ; thereafter the pressure is stabilized.
4 Conclusions
Experimental investigations were carried out to demonstrate and to understand the mechanism of the DALC process. The following important conclusions can be drawn from the study.
1. The shockwave generated during vaporization of liquid droplets by pulse nanosecond laser can be effectively used for various material-processing applications, including removal of microparticles.
2. Depending on the magnitude of the UV laser energy, laser–droplet interaction can result in droplet breakup (for energies as low as 25 mJ) and droplet vaporization (for high-energy values greater than 250 mJ).
3. Beyond a certain energy level, further increase in energy does not increase the magnitude of the shockwave or the cleaning performance.
4. Droplet vaporization can result in impulse shock pressure generated of 12 MPa.
5. Droplet breakdown that occurs at low energy can be used as an optohydrodynamic-based process and complete droplet vaporization can be used for a shock-based process.
6. The DALC process shows a strong dependence on distance from the explosion point.
Acknowledgments
The authors acknowledge the support offered by the UK Engineering and Physical Sciences Research Council (EPRSC) under the grant EP/L01968X/1 and British Council under the grant DST-2014-15-037. The technical support provided by the MTC, Coventry and ALT, Manchester is acknowledged.