
Particle Resuspension From Surfaces
Overview of Theoretical Models and Experimental Data
Babak Nasr, Suresh Dhaniyala and Goodarz Ahmadi, Clarkson University, Potsdam, NY, United States
Abstract
An overview of theoretical models for particle resuspension and the available experimental data on particle removal is presented. The different particle removal models are described in detail and the important effects of surface roughness on particle detachment are described. A series of experimental data for particle resuspension in wind tunnel studies available in the literature was compiled, presented in terms of critical shear velocities, and compared against each other. Differences in the measured critical velocities for particle resuspension were observed which were attributed to different factors such as particle size, surface roughness, relative humidity, and the duration that the surface was exposed to airflow. The theoretically predicted critical shear velocities for detachment of particles were compared with the available experimental data. The smooth surface contact models are seen to overestimate the critical shear velocity for particle removal. However, with the inclusion of effects of surface roughness, the model predictions were found to be in reasonable agreement with the experimental data.
Keywords
Particle resuspension; particle removal; detachment; particle adhesion; surface roughness; relative humidity
1 Introduction
Particle resuspension from surfaces has a wide range of applications in environmental, health, and industrial processes. Particle resuspension is the phenomenon of removing particles from surfaces and getting them airborne through external actions such as surface excitation, mechanical means, and fluid flow. From an environmental perspective, particle resuspension is important for both outdoor and indoor air quality (IAQ) [1–3]. Resuspended particles from the ground can influence local temperature and hence are important in climate change studies as well [4]. Effect of resuspension on IAQ has important health implications over immediate or long-term durations [5]. In HVAC (heating, ventilation, and air conditioning) systems, particle resuspension is one of the major concerns in terms of IAQ. Resuspension of particulates such as metal oxide, pollen, dust, and fibers or other types of pollutants and hazardous particles and their subsequent inhalation may result in significant adverse health impacts, including cancer, allergies, etc. [6].
In semiconductor and microelectronics industries, removing contaminants from silicon wafer surfaces and reducing surface contamination are critical to maintaining high yield in multilevel integrated circuit fabrication. Likewise, effective removal of charged toner particles from the photoconductor drums in printers and their transfer to paper surfaces is the key to the xerographic industry [7]. In terms of surface cleaning, there are many applications that illustrate the importance of particle resuspension from surfaces. For example, in photovoltaic energy farms, dust-contaminated solar panels reduce electricity production significantly [8], making it critical to regularly clean panels. In addition, the particle resuspension/reaerosolization process is of interest from a security perspective. Chemical and biological particles as well as radiological and explosive particles that are already deposited on surfaces may have immediate or delayed hazards for the population due to the risk of resuspension.
The detection and cleaning of particles from substrates is of great importance in a wide range of fields. Often, nonintrusive cleanup in the absence of chemicals is the preferred cleaning option. One nonintrusive approach that can be used to remove submicrometer particles from a surface is using impinging jets that impart high velocity turbulent airflow onto the particle that resides on a substrate.
There is a wide range of parameters that affect flow-driven particle resuspension from surfaces. These include particle and surface characteristics such as particle size, shape, and roughness; adhesion bond between the particle and the substrate; particle and surface charges; airflow velocity near the particle; turbulence intensity and structure; and environmental conditions such as relative humidity (RH). Among the adhesion forces, the van der Waals force, which originates from the intermolecular attractions between molecules of the particle and the substrate, is always attractive and plays an important role in preventing small particle resuspension. In addition, when present, the electrostatic and capillary forces strongly affect particle adhesion and resuspension. When particles on a surface are exposed to high humidity environment, a water meniscus forms around the particle and generates strong capillary force, which could be much larger than the van der Waals force. The electrostatic force becomes important when particles are charged and when a strong electric field is present. The magnitude of the Coulomb force depends on the amount of charge on the particle and the strength of the applied electric field. The electrostatic image force, which is generated by a charged particle near a conductive surface, is always attractive and adds to the van der Waals force. In Section 2.1 a brief review of the existing models for particle adhesion is provided.
2 Particle Detachment: Theoretical Models
Theoretical description of particle removal requires consideration of particle–surface interactions. Particle–surface interaction was first studied by Hertz [9] in his pioneering work on contact mechanics where the elastic interactions between two spheres were analyzed. In that work, however, the effect of adhesion forces was neglected. A theoretical model for adhesion and removal of a particle attached to a surface was presented by Johnson et al. [10]. They included the effect of surface energy and elastic surface deformation at the particle–surface contact. An additional early modeling effort was reported by Derjaguin et al. [11], who used the Hertz elastic deformation and accounted for the adhesion forces. Later, Maugis and Pollock [12] extended these efforts to the situations in which the particle and/or the surface underwent plastic deformations.
These initial models considered perfectly spherical particles residing on smooth surfaces. Real substrates and particles, however, have rough surfaces and even small surface roughness is known to significantly affect particle adhesion. Theoretical modeling of contact of rough surfaces was considered by Greenwood and Williamson [13] based on the Hertz elastic contact model. Using the concept of contact of rough surfaces, Fuller and Tabor [14] studied the effect of surface roughness on particle adhesion force. Soltani and Ahmadi [15–18] extended the particle removal model from the smooth surface and developed an expression for the adhesion of rough particles to rough surfaces. In these models the magnitude of the adhesion force is seen to exponentially decrease with increasing magnitude of surface roughness because the presence of surface asperities results in reduced contact area between particles and substrates. The aforementioned studies only considered the case of surface roughness that is much smaller than the particle size. When the scale of surface irregularities approaches the range of particle diameter, these models are not applicable. To handle these kinds of surface irregularities, a bumpy particle model was introduced by Soltani and Ahmadi [18] and Ahmadi and Guo [19] and the effects of surface bumps on particle adhesion and detachment were studied.
More recently, the effect of roughness on adhesion force was studied numerically by Rabinovich et al. [20,21] and experimentally by Jiang et al. [22], Farshchi-Tabrizi et al. [23], and Götzinger and Peukert [24]. They observed that surface roughness plays a significant role in particle adhesion and removal from a surface. Goldasteh et al. [25] studied the effect of compact particle nonsphericity (surface bumps) together with fine surface roughness on adhesion and removal of particles.
The removal of particles from substrates requires an external excitation to overcome the adhesion force. The external force is often provided by the airflow field. Here, the particle–substrate interaction is coupled with the complex nature of turbulent flow near the wall. Cleaver and Yates [26] and Wang [27] studied the mechanism of particle detachment in turbulent flows. Near wall coherent turbulent flow eddies are known to significantly affect particle deposition and removal as was shown by the numerical simulations of Fan and Ahmadi [28], and the direct numerical simulations (DNSs) of Soltani and Ahmadi [29] and Zhang et al. [30]. By taking into account the near-wall flow structure, theoretical models for particle removal in turbulent flows were reported by Soltani and Ahmadi [15–18], Reeks et al. [31], and Reeks and Hall [32]. Extensive reviews of particle resuspension in turbulent flows were presented by Nicholson [33], Sehmel [34], Visser [35], and Ziskind et al. [36].
Since submicrometer particles are extremely difficult to remove, most experimental studies on particle resuspension were conducted using particles larger than 10 μm. Similarly, most numerical models were also validated for larger particles. From the inhalation and human health perspective, however, airborne particles of concern are those that are smaller than 10 μm, as these particles are most likely to penetrate deep into the human respiratory system. Also, existing theoretical models cannot predict the resuspension characteristics of particles from surfaces when the length scales of the surface irregularities are equal or larger than the particle size. In addition, while the effect of RH on particle resuspension has been observed experimentally, the corresponding modeling efforts have been rather limited [19,37]. In Sections 2.1–2.3 the available models for adhesion force and flow-induced excitation forces and moments that are involved in particle removal mechanisms are briefly described.
2.1 Adhesion Forces
There are several adhesion forces that prevent particle removal from substrates. These are van der Waals adhesion force, capillary force, electrostatic Coulomb and image forces, and the gravitational force. Among these forces, the van der Waals force is always present and plays a major role in adhesion and detachment of submicrometer and micrometer-sized particles. In this section the models for predicting adhesion force for a particle in contact with a surface are briefly outlined.
2.1.1 Adhesion Force
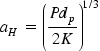
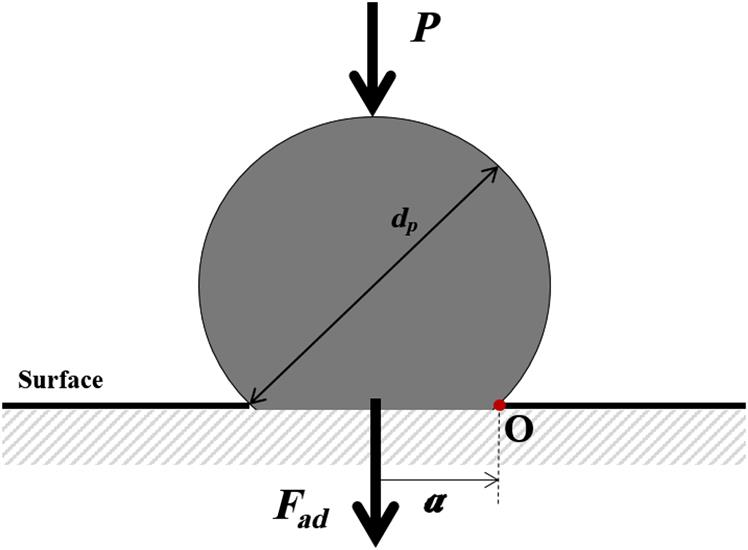
As noted earlier, the first theoretical model for contact of elastic bodies was reported by Hertz [9]. When a downward normal force P is exerted on an elastic sphere residing on a surface, as shown in Fig. 2.1, a circular contact area is formed. According to the Hertz model, the contact radius of the circle, ![]() is given as
is given as
(2.1)
 (2.1)
(2.1)
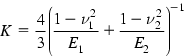
where ![]() is the diameter of a spherical particle and K is the composite Young’s modulus defined as
is the diameter of a spherical particle and K is the composite Young’s modulus defined as
(2.2)
 (2.2)
(2.2)
where Ei and vi are the Young’s modulus and Poisson’s ratio, respectively, for the particle (i = 1) or the substrate (i = 2). Hertz was concerned with large elastic balls for which the adhesion force is negligible compared to the gravitational and elastic forces.
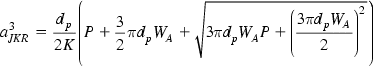
For small micrometer-sized particles, however, adhesion generates the dominant force. Johnson et al. [10] developed the so-called JKR model that accounted for the adhesion between particle and surface. According to the JKR model, the contact radius of a particle with a surface is given as
(2.3)
 (2.3)
(2.3)
where P is the exerted external force and WA is the thermodynamic work of adhesion (Dupré adhesion energy), which represents the amount of work required to separate a unit area of the particle from the substrate. The thermodynamic work of adhesion, WA, is related to surface energies of the particle ![]() and the substrate
and the substrate ![]() and the interfacial energy
and the interfacial energy ![]() . That is,
. That is,
(2.4)
Also, the work of adhesion could be given as
(2.5)
where A is the Hamaker constant, and ![]() is the minimum equilibrium separation distance between the particle and the substrate (
is the minimum equilibrium separation distance between the particle and the substrate (![]() ).
).
In the absence of adhesion, WA = 0, Eq. (2.3) reduces to the Hertz contact radius expression (Eq. 2.1). For the JKR model, the force required to overcome adhesion and remove a particle from the surface, i.e., its pull-off force, is given as
(2.6)
In the JKR model, the contact area at the moment of separation is not zero. When the pull-off force is applied, the contact radius at the moment of separation is given as
(2.7)
where ![]() is the contact radius in the absence of an external force (P = 0) given as
is the contact radius in the absence of an external force (P = 0) given as
(2.8)
 (2.8)
(2.8)
Derjaguin et al. [11] proposed an alternative adhesion theory that is commonly referred to as the DMT model. They assumed that the deformation contact area was the same as the Hertz model, but accounted for the adhesion force and found an expression for the contact radius, which is given as
(2.9)
The corresponding pull-off force then becomes
(2.10)
The DMT model predicts that the contact area at the moment of separation is zero (aDMT=0), and the contact area at zero load is given as
(2.11)
 (2.11)
The differences in the assumptions made in deriving the JKR and DMT models result in their somewhat different predictions. In the JKR model the surface force is assumed to act only in the contact region of particle and substrate. The DMT model, however, included the effect of the surface force outside the contact area, but assumed that the deformation was the same as that in the Hertz model. As a result, the pull-off force estimated by the DMT model is 4/3rd of that predicted by the JKR model. The other important difference is that the predicted particle–substrate contact area at the moment of separation is zero in the DMT model, while the JKR model predicts a finite contact radius.
According to Muller et al. [38], the DMT model is appropriate for small size and hard particles, with high Young’s modulus and low surface energy. The JKR model, however, is more applicable for larger particles, with low Young’s modulus (soft material) and high surface energy. The transition between the JKR and the DMT models is based on the Tabor parameter [39]
(2.12)
 (2.12)
The JKR model is assumed to be valid for ![]() (large and soft particles), while the DMT model is applicable for
(large and soft particles), while the DMT model is applicable for ![]() (small and stiff particles). For
(small and stiff particles). For ![]() the validity of both models is questionable. Additional discussion of the Tabor parameter may be found in the work of Greenwood [40].
the validity of both models is questionable. Additional discussion of the Tabor parameter may be found in the work of Greenwood [40].
Extending the JKR and DMT models for elastic particle–substrate contact, Maugis and Pollock [12] proposed a model (the MP model) for adhesion of particles to surfaces by considering plastic deformation. The corresponding contact radius is given as
(2.13)
where H is the hardness of the material, which may be expressed as
(2.14)
where Y is yield strength of the material. In the MP model, the expressions for pull-off forces in the limits of ductile and brittle separations were provided by Maugis and Pollock [12]. It should be emphasized that the JKR and DMT adhesion models predict the pull-off force and the corresponding contact radius between particle and surface for elastic contacts, while the MP model takes into account the effects of plastic deformation on the pull-off force and contact radius.
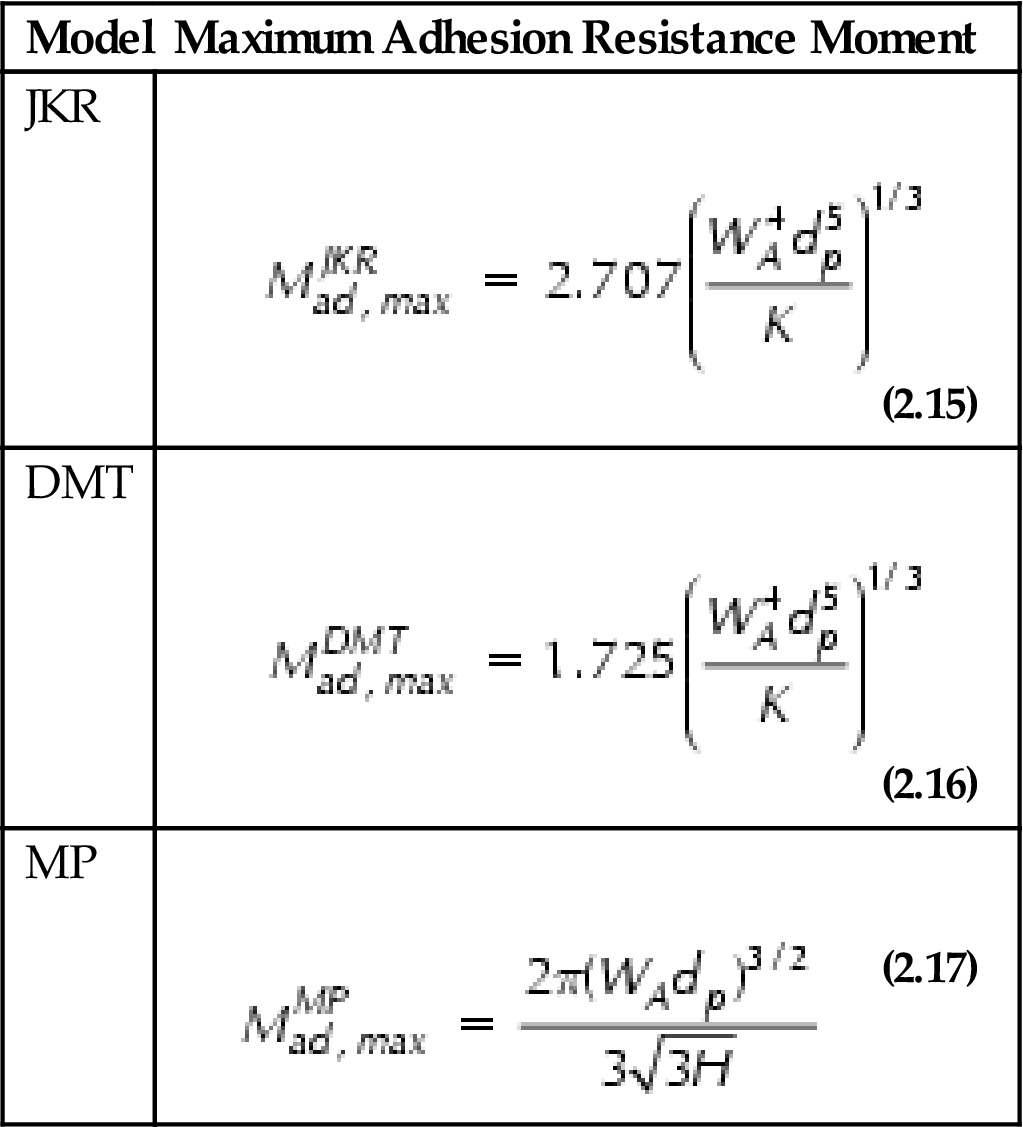
2.1.2 Maximum Adhesion Resistance Moment
Particle detachment from a substrate requires overcoming the adhesion forces that bind the particle to the substrate. A particle can be detached from a surface by three mechanisms, namely, rolling, sliding, and lifting. Soltani and Ahmadi [15,16] showed that spherical particles were more easily detached from a substrate by the rolling mechanism. In a number of earlier works, the onset of rolling was assumed when the external loading moment became equal to the adhesion resistance moment at the point of separation, i.e., the adhesion resistance moment is evaluated as the pull-off force times the contact radius at the point of detachment. In reality, however, the external moment needs to overcome the maximum resistance moment that is produced by the adhesion force. The maximum adhesion resistance moment was studied by Ziskind et al. [41] and Zhang and Ahmadi [42]. The corresponding maximum adhesion resistance moment is evaluated by finding the maximum of M=Pa, where P is the upward (away from the surface) external force and a is the contact radius, as illustrated in Fig. 2.1. The corresponding contact radii are related to external force according to Eqs. (2.3), (2.9), and (2.13), respectively, for the JKR, DMT, and MP models.
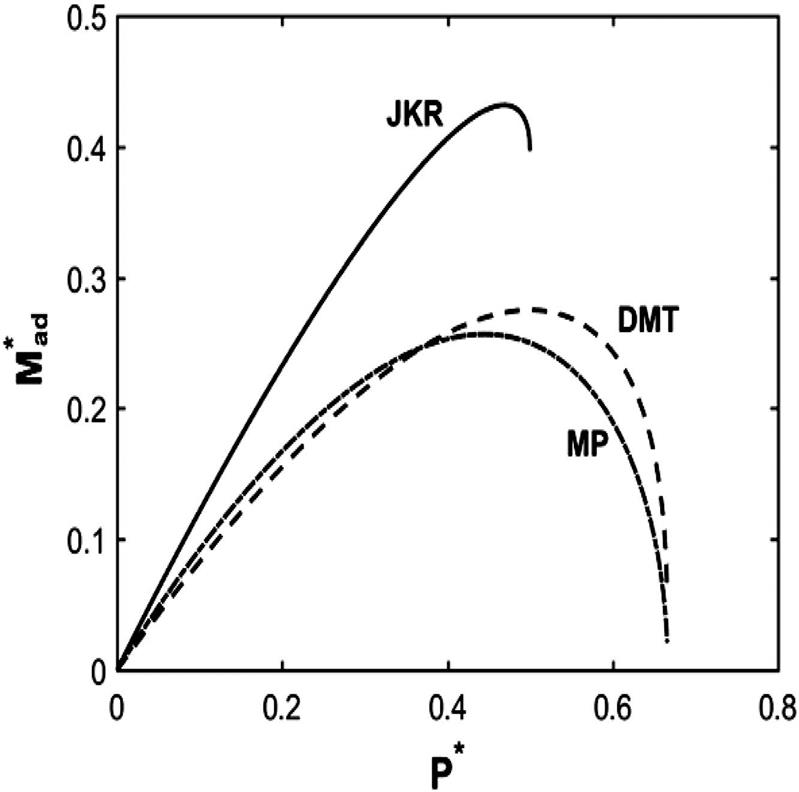
Variation of the nondimensional adhesion resistance moment, ![]() , versus the nondimensional upward external force, P*, for the JKR, DMT, and MP models is shown in Fig. 2.2. Here,
, versus the nondimensional upward external force, P*, for the JKR, DMT, and MP models is shown in Fig. 2.2. Here, ![]() and
and ![]() and the nondimensional contact radius is defined as
and the nondimensional contact radius is defined as ![]() for the JKR and DMT models [41,42] and
for the JKR and DMT models [41,42] and ![]() for the MP model. It is seen that the resistance moment increases and reaches a peak value before it decreases at the point of separation. The maximum resistance moment for the JKR model occurs just before the point of separation at P*=15/32. For the DMT and MP models, however, the maximum adhesion resistance moment occurs much before the point of separation, respectively, at P*=1/2 and P*=4/9. In fact, the DMT and MP models lead to zero resistance moment at the point of separation, since the contact radius goes to zero. Additional discussions concerning rolling particle removal are presented in Section 2.3. The maximum adhesion moment predicted by the JKR, DMT, and MP models is listed in Table 2.1.
for the MP model. It is seen that the resistance moment increases and reaches a peak value before it decreases at the point of separation. The maximum resistance moment for the JKR model occurs just before the point of separation at P*=15/32. For the DMT and MP models, however, the maximum adhesion resistance moment occurs much before the point of separation, respectively, at P*=1/2 and P*=4/9. In fact, the DMT and MP models lead to zero resistance moment at the point of separation, since the contact radius goes to zero. Additional discussions concerning rolling particle removal are presented in Section 2.3. The maximum adhesion moment predicted by the JKR, DMT, and MP models is listed in Table 2.1.
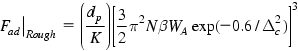
2.1.3 Particle Adhesion Models on Rough Surfaces
The classical JKR, DMT, and MP models assume that perfectly spherical particles reside on a smooth surface. Real surfaces are, however, rough, and surface roughness can significantly affect the adhesion force between a particle and a substrate. When the fine roughness length scale of the substrate is small compared to the size of a particle residing on it, the contact area, and thus, the adhesion force, between the particle and the substrate is significantly reduced. Soltani et al. [43] developed an expression for the adhesion force in the presence of surface roughness based on the roughness model of Fuller and Tabor [14]. In their model, the surface roughness was characterized by three parameters, namely, number of asperities per unit area (asperity density N), radius of the tips of the asperities β, and the distribution of asperity heights (standard deviation of asperity heights σ). For a bead-blasted aluminum surface, Greenwood and Williamson [13] found that the roughness asperities have a Gaussian distribution and the three roughness parameters were constrained by the relationship
(2.18)
Considering the above relationship and using the JKR model to describe the adhesion of asperities, the net pull-off force for removal of a particle residing on a rough substrate can be expressed as
(2.19)
 (2.19)
and the corresponding contact radius at the moment of separation is given as
(2.20)
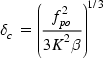
where ![]() is a nondimensional variable that is defined as
is a nondimensional variable that is defined as
(2.21)
where σ is the standard deviation of the height of asperities and ![]() is the maximum elastic extension of the tip of an asperity before the contact adhesion breaks and is given as
is the maximum elastic extension of the tip of an asperity before the contact adhesion breaks and is given as
(2.22)
 (2.22)
where ![]() is the pull-off force for detaching a single asperity according to the JKR model given as
is the pull-off force for detaching a single asperity according to the JKR model given as
(2.23)
The quantity, ![]() , can be considered to represent the nondimensional magnitude of the surface roughness.
, can be considered to represent the nondimensional magnitude of the surface roughness.
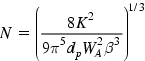
Recently, Goldasteh et al. [44] modified the model of Soltani et al. [43] with respect to the relationship of the radius of the asperity to the standard deviation of the heights of the asperities. They used the results of Rabinovich et al. [20] who studied the adhesion force of particles on a surface with nanoscale roughness using an atomic force microscope (AFM) and found
(2.24)
Goldasteh et al. [44] also hypothesized that the value of pull-off force of particles from a rough surface (given by Eq. 2.19) must match the pull-off force of smooth surfaces (given by Eq. 2.6) when the inverse of the roughness parameter, ![]() , approaches zero. Accordingly, they suggested an expression for the number of asperities that is given as
, approaches zero. Accordingly, they suggested an expression for the number of asperities that is given as
(2.25)
 (2.25)
While the adhesion force is the main force that resists particle removal from a surface, other forces such as the capillary force and electromagnetic forces can also act to bind particles to surfaces. The influence of capillary force was studied by Podczeck et al. [45], Rabinovich et al. [46], and Ahmadi et al. [37]. Also, the effect of electrostatic forces was studied by Ranade [47], Soltani and Ahmadi [18], and Zhang and Ahmadi [48].
2.2 External Forces
There are different external forces that can result in particle removal from surfaces. The main mechanisms for generating these external forces are fluid flows around the particle and substrate vibrations. Vibrating surface as a mechanism to remove particles has been widely used to clean surfaces in the semiconductor industry. Several studies have explored the use of ultrasonic excitation for particle removal from surfaces [16,49–51]. Here, the removal of particles from a surface in turbulent airflows is reviewed because of its wide relevance to particle resuspension in the fields of indoor and outdoor air quality, human exposure, and health and industrial air pollution.
2.2.1 Hydrodynamic Forces
Fluid flow over a particle results in drag and lift forces, as well as in hydrodynamic moments acting on the particle. To accurately determine these forces and torques, the knowledge of near-wall flow in the turbulent regime is required. Cleaver and Yates [26] suggested that the burst/inrush events could be a mechanism for particle removal in turbulent flow. They assumed that the flow near the wall during the inrush after the burst behaves as an axisymmetric viscous stagnation point flow. Fan and Ahmadi [28] used a plane stagnation point flow as a model for the coherent near-wall vortices. It was shown that the secondary flow generated by near-wall eddies increases the hydrodynamic forces acting on the particle in the viscous sublayer. Near-wall eddies were studied by Soltani and Ahmadi [29] and Zhang and Ahmadi [52] using the DNS approach, where it was demonstrated that the wall coherent structure plays a key role in the particle entrainment process. In general, the effective velocity at the center of the particle attached to a wall in a turbulent boundary layer can be expressed as
(2.26)
 (2.26)
where γ is intensity factor, V is resultant velocity magnitude at the center of particle, and v is the gas kinematic viscosity. Here, ![]() is the shear velocity (friction velocity), defined as
is the shear velocity (friction velocity), defined as
(2.27)
where ![]() is the wall shear stress and ρ is the gas density. Table 2.2 shows the evaluated values for the intensity factor γ in a sublayer due to coherent eddies and the burst/inrush process.
is the wall shear stress and ρ is the gas density. Table 2.2 shows the evaluated values for the intensity factor γ in a sublayer due to coherent eddies and the burst/inrush process.
Table 2.2
The Intensity Factors for the Sublayer and Burst/Inrush Process
| Model | γ | References |
| Sublayer | ~1.14 | 28 |
| Burst/inrush event | 1.72–1.84 | 29 |
Hydrodynamic forces and torques acting on a spherical particle are illustrated in Fig. 2.3. The hydrodynamic drag force for a particle in contact with a surface is given in general form as [53]
(2.28)
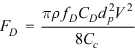 (2.28)
where fD is the correction factor due to the wall effect (fD=1.7009 [54]), and Cc is the Cunningham slip correction factor given as
(2.29)
where Kn is the Knudsen number defined as
(2.30)
where λ is the mean free path of the gas (λ≅66 nm, for air at NTP). In Eq. (2.28), CD is the particle drag coefficient that depends on the particle Reynolds number, Rep, defined as
(2.31)
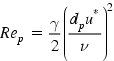 (2.31)
For very low Reynolds number (![]() ), Stokes drag can be assumed and the corresponding drag coefficient is given by
), Stokes drag can be assumed and the corresponding drag coefficient is given by
(2.32)
For larger particle Reynolds numbers, however, a nonlinear correction to the Stokes drag is needed [55].
(2.33)
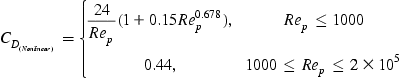 (2.33)
The hydrodynamic torque acting on a particle is given as
(2.34)
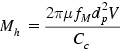 (2.34)
where μ is gas dynamic viscosity and fM is the wall effect correction factor (fM=0.943993 [54]).
In addition to drag force and hydrodynamic torque, a lift force also acts on the particle. The shear lift force is given as [56]
(2.35)
where y =dp/2 (for the particle center), and the velocity gradient, ![]() is obtained from Eq. (2.26). Soltani and Ahmadi [15] showed that the effect of lift force on particle detachment was typically negligible.
is obtained from Eq. (2.26). Soltani and Ahmadi [15] showed that the effect of lift force on particle detachment was typically negligible.
2.3 Removal Mechanisms
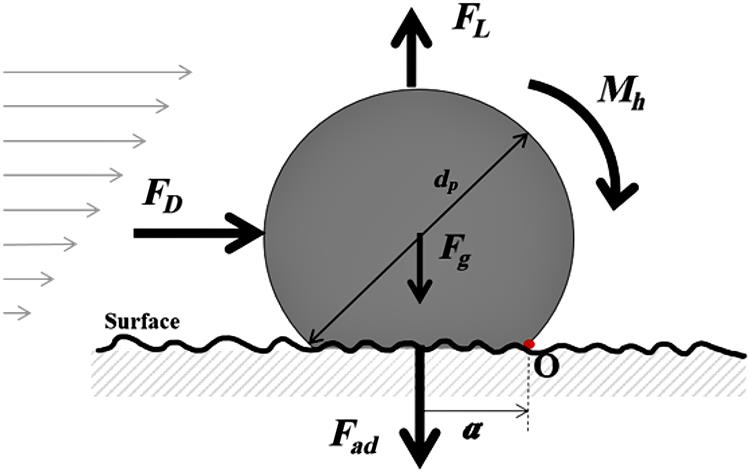
A particle is removed from a surface when the exerted flow forces overcome the adhesion forces. The schematic diagram of force balance on a spherical particle is shown in Fig. 2.3. As noted earlier, there are three main mechanisms for removing a particle from the surface: (1) rolling, (2) sliding, and (3) lifting. Table 2.3 lists the force and moment balance for each mechanism. Here, Fg=mg is the gravitational force, Mhyd and Mad are, respectively, the total hydrodynamic and resistance moments, and ks is static coefficient of friction between particle and substrate. A particle is considered to roll when it tips over with respect to point O, as indicated in Fig. 2.3, i.e., a particle is detached by rolling when the moment of external forces overcomes the moment of adhesion resistance forces with respect to point O. After the particle is dislodged and starts to roll, it is assumed that it will be removed from the surface due to the lift force and/or turbulence fluctuations.
Table 2.3
| Mechanism | Force/Moment Balance Relationship |
| Rolling |
(2.36) |
| Sliding |
(2.37) |
| Lifting |
(2.38) |
Soltani and Ahmadi [15] showed that spherical particles are more easily removed by the rolling mechanism compared to lifting or sliding mechanisms, i.e., the flow velocity required to roll a spherical particle is much lower than that required to lift/slide the particle from/on the surface.
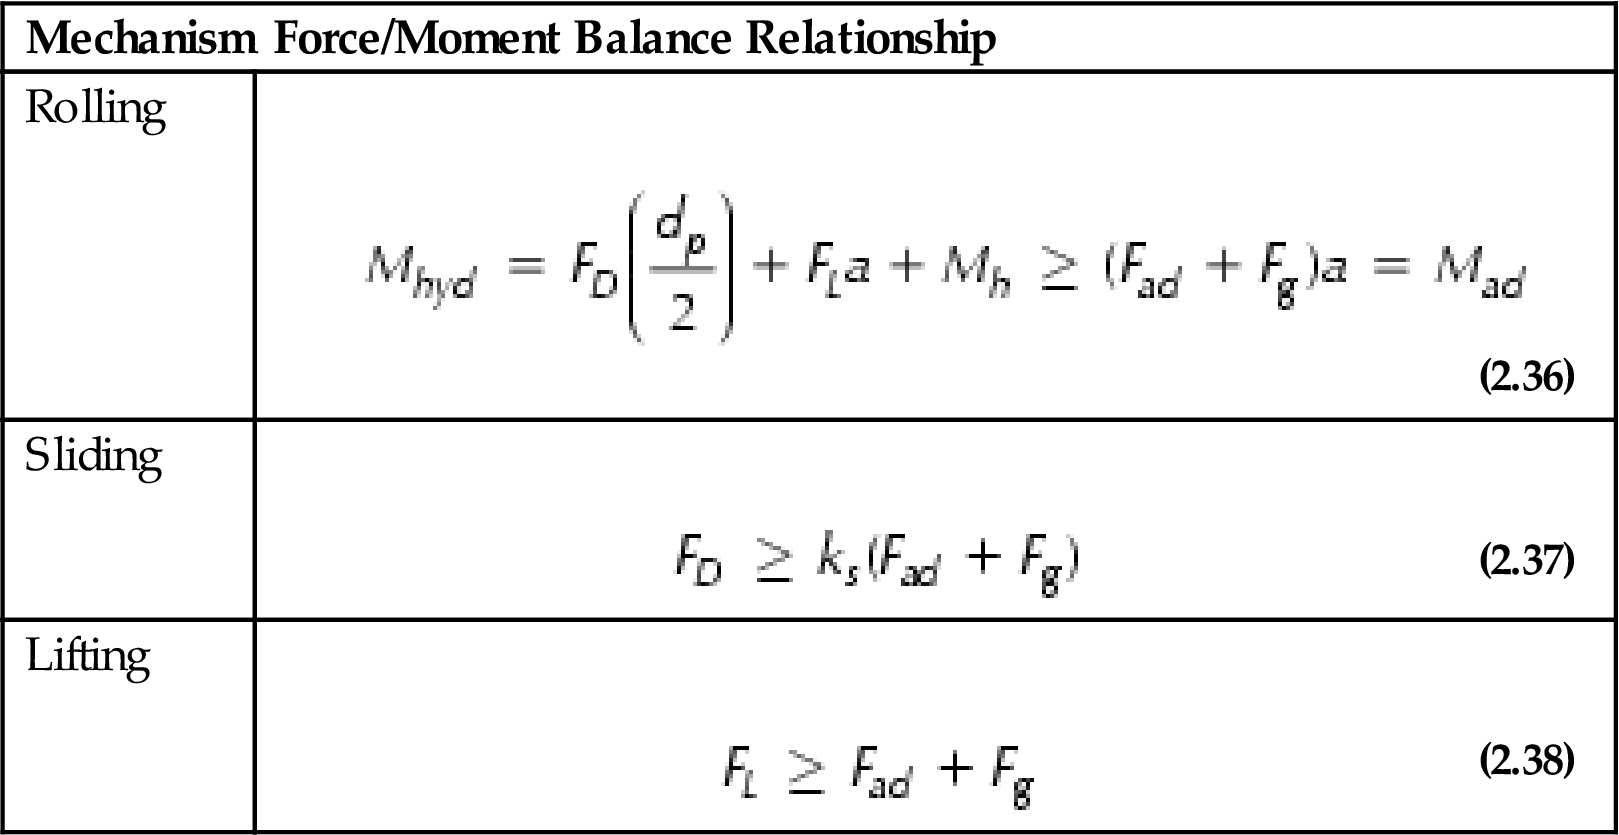
Based on the force moment balance for onset of rolling, as given by Eq. (2.36), a critical shear velocity ![]() for the removal of particles from a surface can be calculated. Several different closed-form expressions for critical shear velocity for resuspension under the assumption of negligible lift and gravitational force have been derived, and the important ones are listed in Table 2.4. Note that some of the listed equations are implicit and iterative calculations are required to obtain the critical shear velocity values.
for the removal of particles from a surface can be calculated. Several different closed-form expressions for critical shear velocity for resuspension under the assumption of negligible lift and gravitational force have been derived, and the important ones are listed in Table 2.4. Note that some of the listed equations are implicit and iterative calculations are required to obtain the critical shear velocity values.
Table 2.4
Expressions for the Critical Shear Velocity for Particle Removal From Surfaces
| Condition | Expression for |
References | |
| Surface | Flow | ||
| Smooth | Sublayer |
(2.39) |
[15] |
| Burst |
(2.40) |
||
|
(2.41) 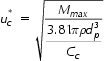 (2.41) (2.41) |
[42] | ||
| Rough | Sublayer |
(2.42) 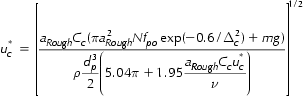 (2.42) (2.42) |
[17] |
| Burst |
(2.43) 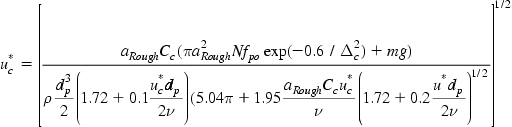 (2.43) (2.43) |
||
| Sublayer/Burst |
(2.44) |
[44] | |
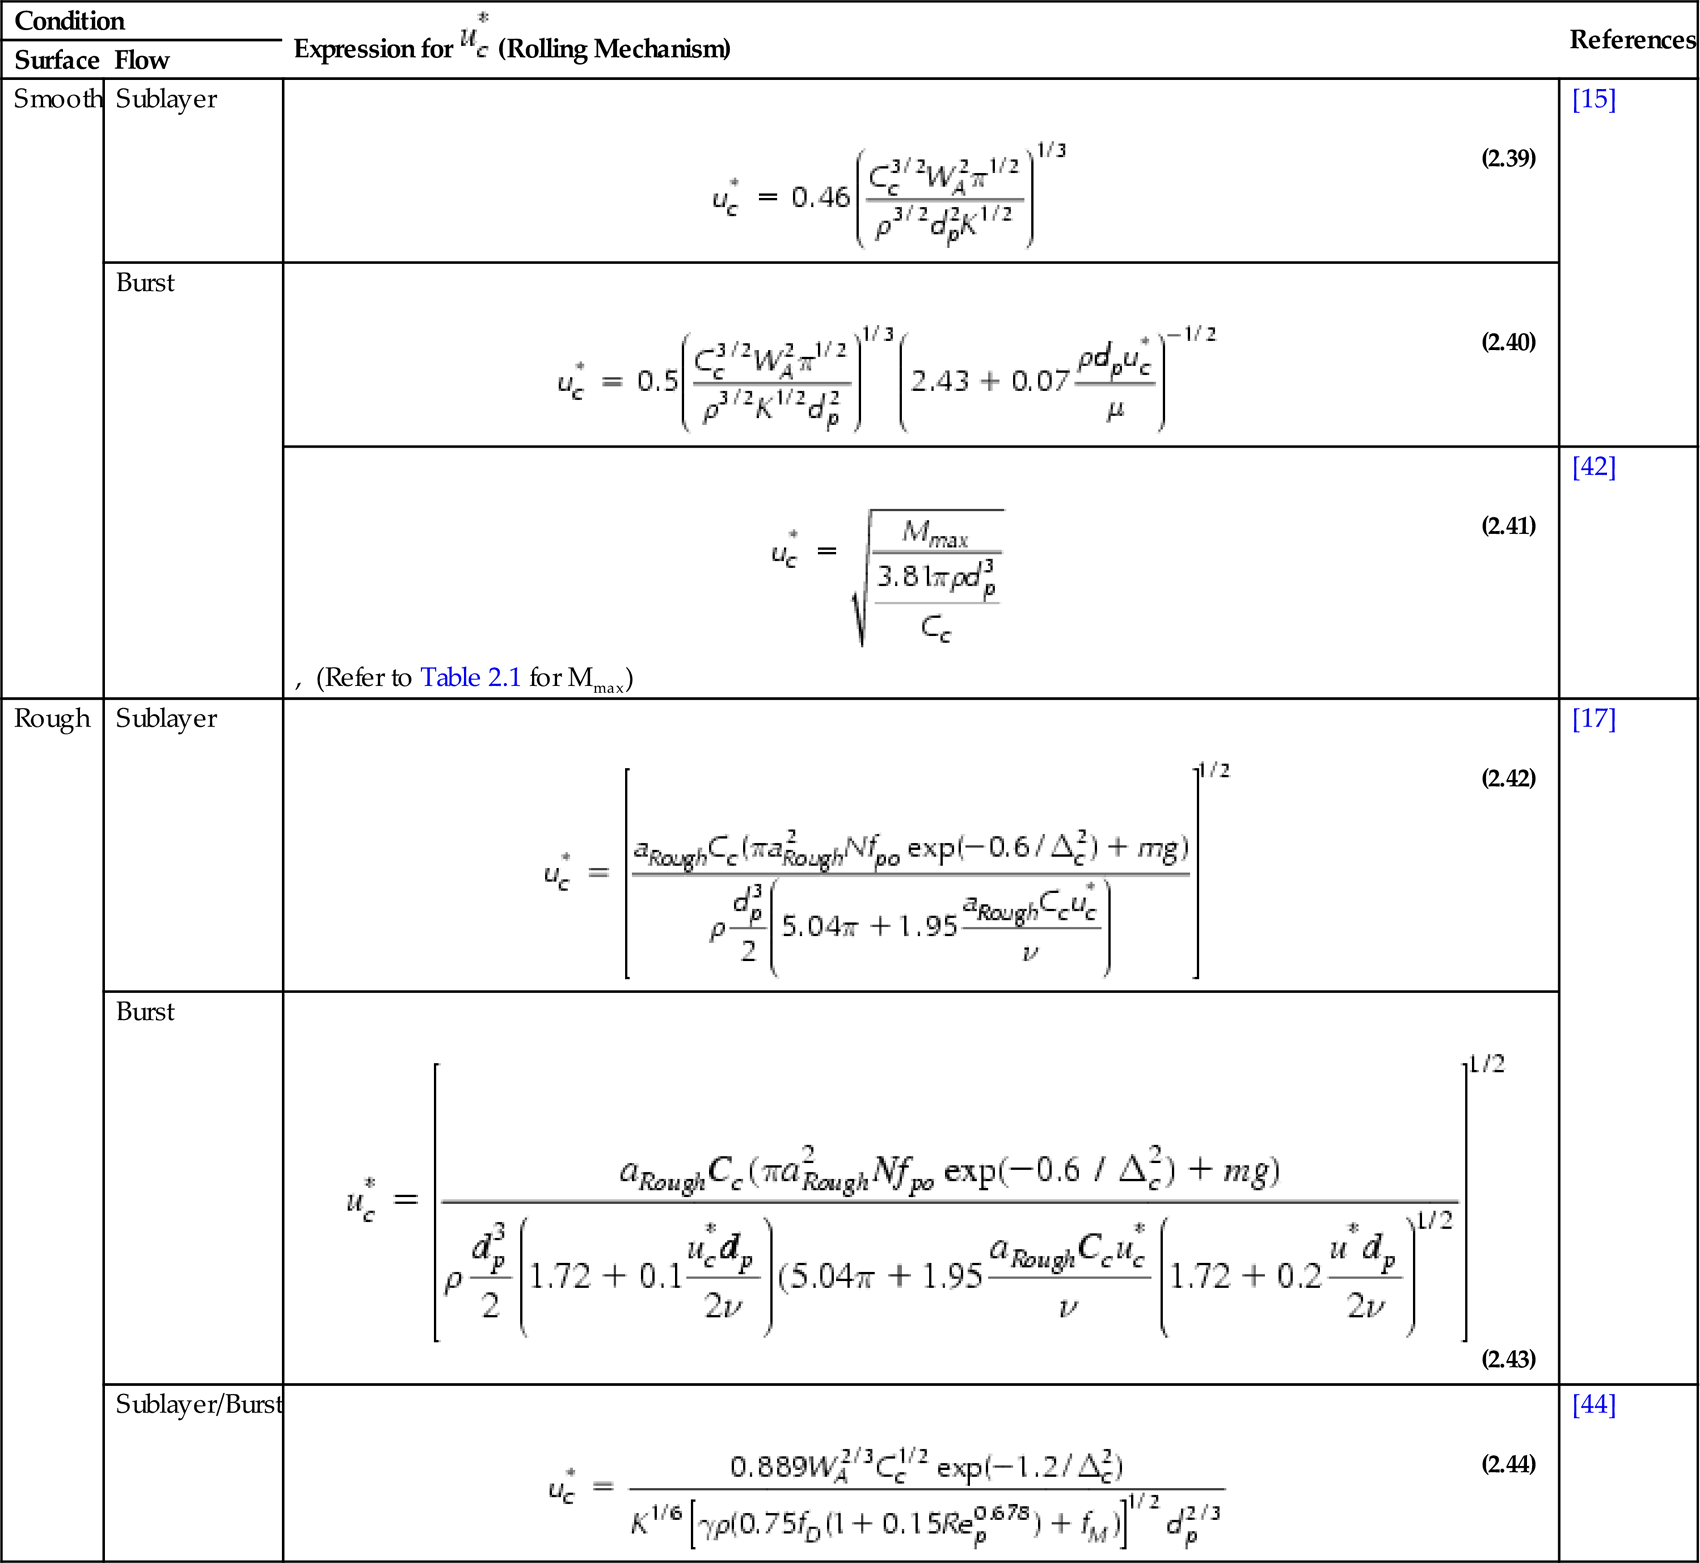
For particle removal from smooth surfaces, Eqs. (2.39)–(2.41) suggest that the critical shear velocity increases with decreasing particle diameter and/or increasing work of adhesion between particle and substrate. These trends were also reported by Soltani and Ahmadi [15] and Zhang and Ahmadi [42]. The critical shear velocity for particle removal from rough surfaces, as given by Eqs. (2.42)–(2.44), show strong dependence on the nondimensional roughness parameter, ![]() Increasing roughness results in decreasing critical shear velocity [17]. A quantitative understanding of the critical shear velocities as a function of particle diameter requires specific consideration of particle/substrate materials and surface finish, and is given in Sections 3 and 4.
Increasing roughness results in decreasing critical shear velocity [17]. A quantitative understanding of the critical shear velocities as a function of particle diameter requires specific consideration of particle/substrate materials and surface finish, and is given in Sections 3 and 4.
3 Resuspension Experiments
There have been numerous experimental studies of particle resuspension in the literature over the last three decades. In this section a review of some of the data available in the literature is presented. The experimental data for particle resuspension in different studies are compared against each other, and the effects of different factors on particle resuspension are studied. For this purpose, the collected experimental data for particle detachment fractions obtained with wind tunnel studies are described. The experimental studies that are used for this comparison are shown in Table 2.5.
Table 2.5
Listing of the References Used in the Experimental Database
| Authors | Title |
| Braaten et al. [57] | Particle resuspension in a turbulent boundary layer—Observed and modeled |
| Wu et al. [58] | Controlled wind tunnel experiments for particle bounce-off and resuspension |
| Nicholson [59] | Wind tunnel experiments on the resuspension of particulate material |
| Giess et al. [60] | Factors affecting particle resuspension from grass swards |
| Reeks and Hall [32] | Kinetic models for particle resuspension in turbulent flows: Theory and measurement |
| Ibrahim et al. [61] | Microparticle detachment from surfaces exposed to turbulent airflow: Controlled experiments and modeling |
| Ibrahim et al. [62] | Microparticle detachment from surfaces exposed to turbulent airflow: Effects of flow and particle deposition characteristics |
| Ibrahim et al. [63] | Experiments and validation of a model for microparticle detachment from a surface by turbulent airflow |
| Jiang et al. [22] | Characterizing the effect of substrate surface roughness on particle–wall interaction with the airflow method |
| Goldasteh et al. [64] | Wind tunnel study and numerical simulation of dust particle resuspension from indoor surfaces in turbulent flows |
| Boor et al. [65] | Wind tunnel study on aerodynamic particle resuspension from monolayer and multilayer deposits on linoleum flooring and galvanized sheet metal |
| Kassab et al. [66] | High resolution study of micrometer particle detachment on different surfaces |
| Barth et al. [67] | Single particle resuspension experiments in turbulent channel flows |
Some details of these studies such as dimensions of the wind tunnel and other flow characteristics are listed in Table 2.6.
Table 2.6
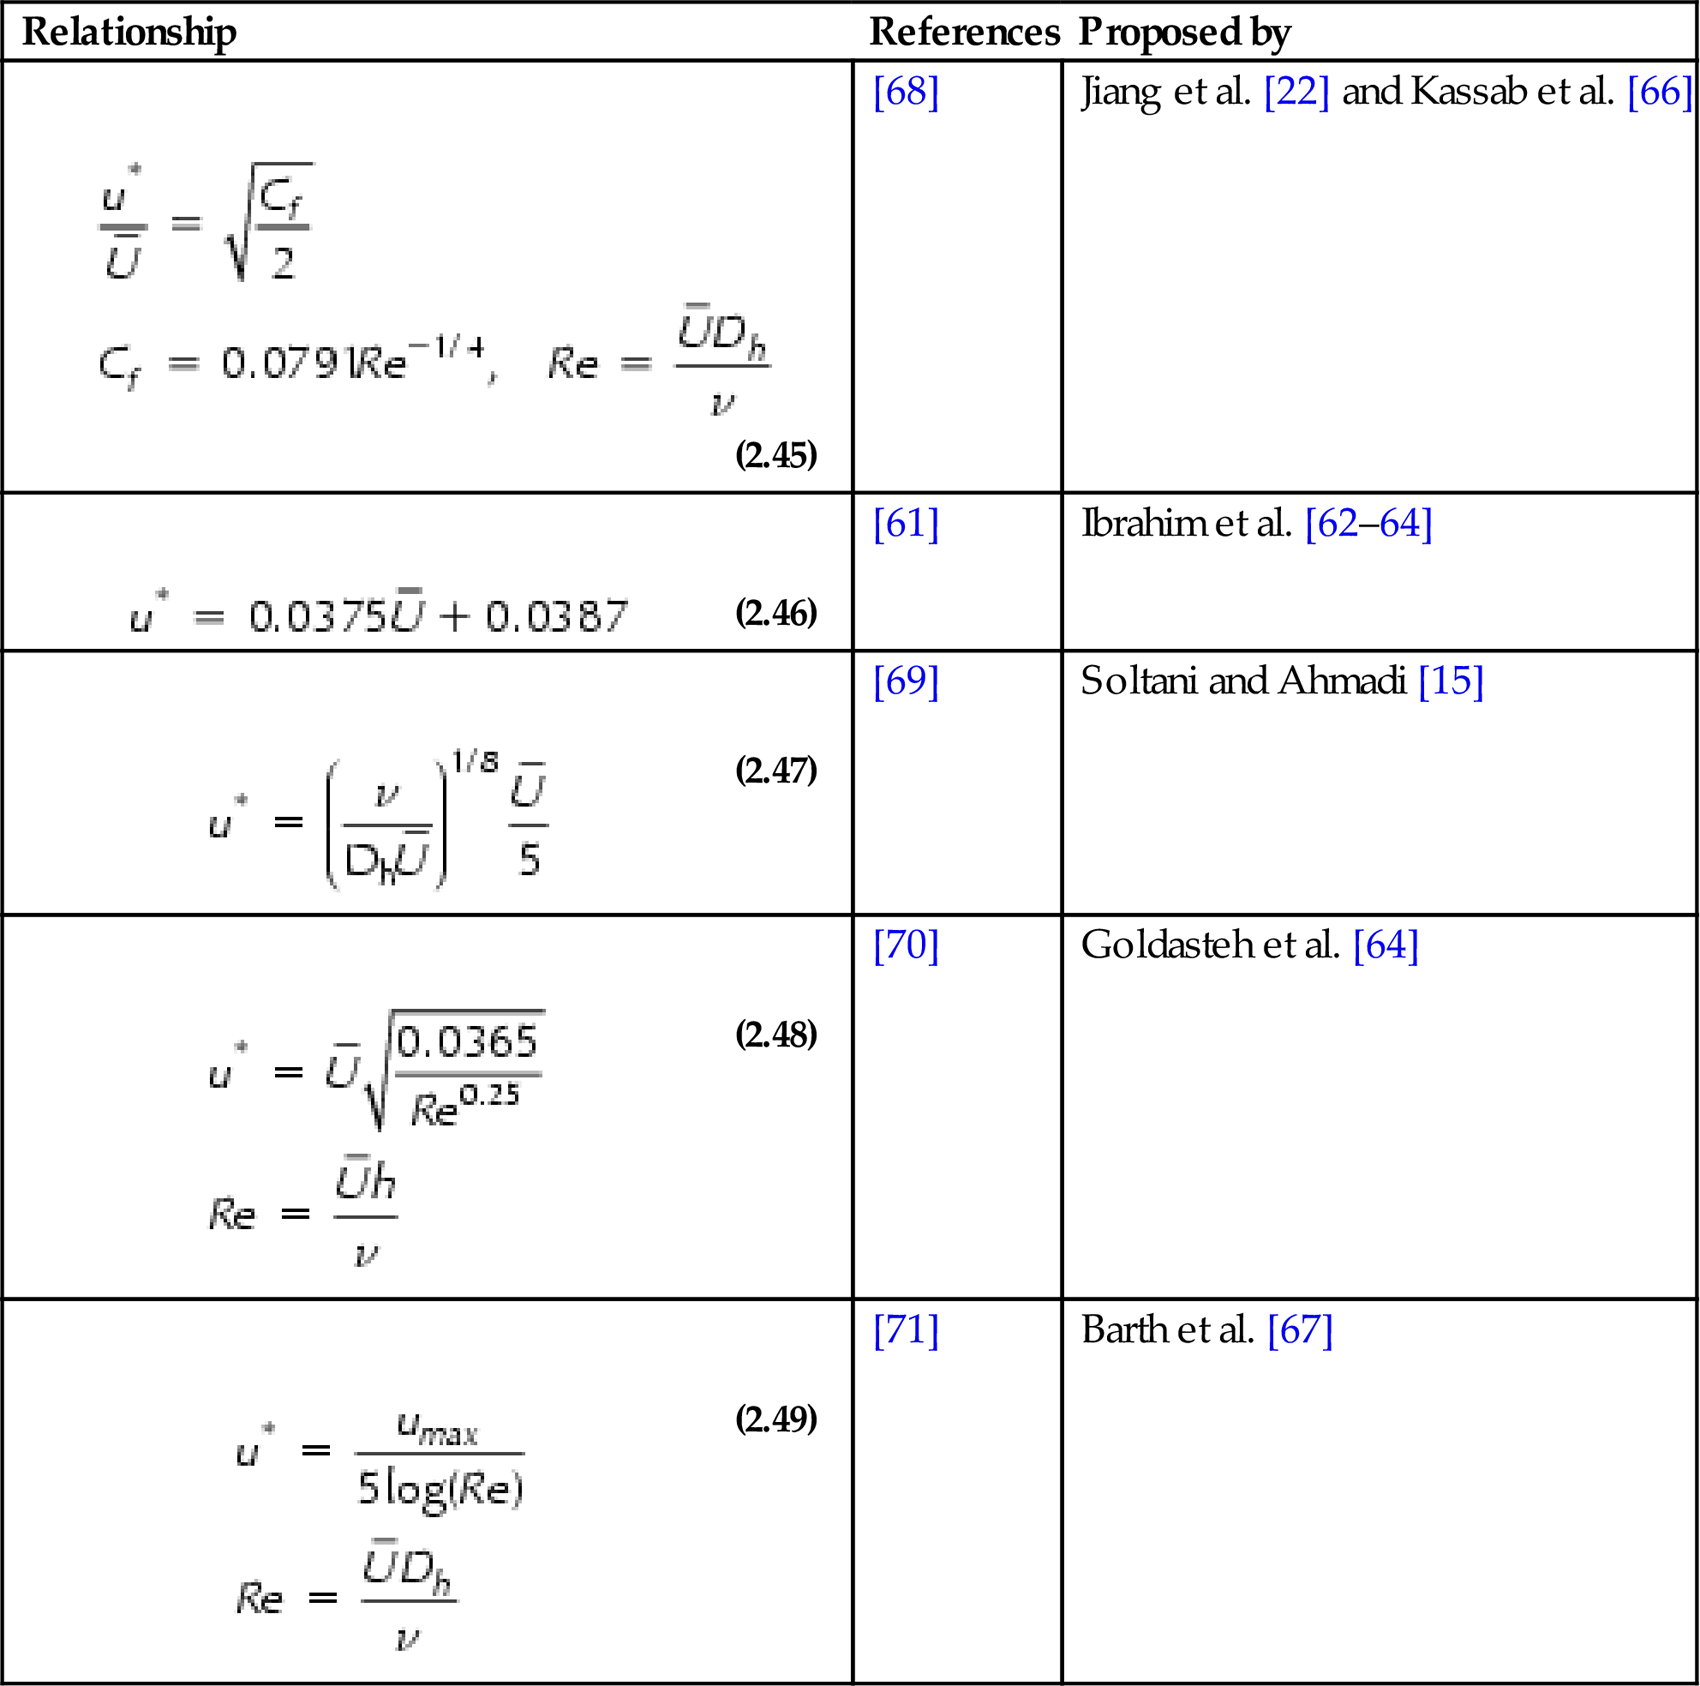
Relationship of Shear Velocity, u*, to the Free-Stream/Mean Velocity, U![]() , Proposed in Different Studies. (Dh is the equivalent hydraulic diameter of the duct, and h is the duct height at the test section)
, Proposed in Different Studies. (Dh is the equivalent hydraulic diameter of the duct, and h is the duct height at the test section)
| Relationship | References | Proposed by |
|
(2.45) 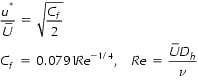 (2.45) (2.45) |
[68] | Jiang et al. [22] and Kassab et al. [66] |
|
(2.46) |
[61] | Ibrahim et al. [62–64] |
|
(2.47) |
[69] | Soltani and Ahmadi [15] |
|
(2.48) 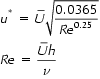 (2.48) (2.48) |
[70] | Goldasteh et al. [64] |
|
(2.49)  (2.49) (2.49) |
[71] | Barth et al. [67] |
3.1 Wind Tunnel and Duct Flow Characteristics
The use of a wind tunnel or a duct for particle resuspension studies has been popular because these flow setups allow for the generation of a well-known flow field with calculable shear velocities over the substrate. Evaluation of shear velocity requires knowledge of wall shear stress. For fully developed flows in ducts or for boundary layer flows, wall shear stress can be directly measured or estimated from the free-stream or mean velocity using several well-established analytical and semiempirical expressions. The shear velocity can then be calculated from Eq. (2.27). Several commonly used expressions for evaluating shear velocity in duct flows are listed in Table 2.6.
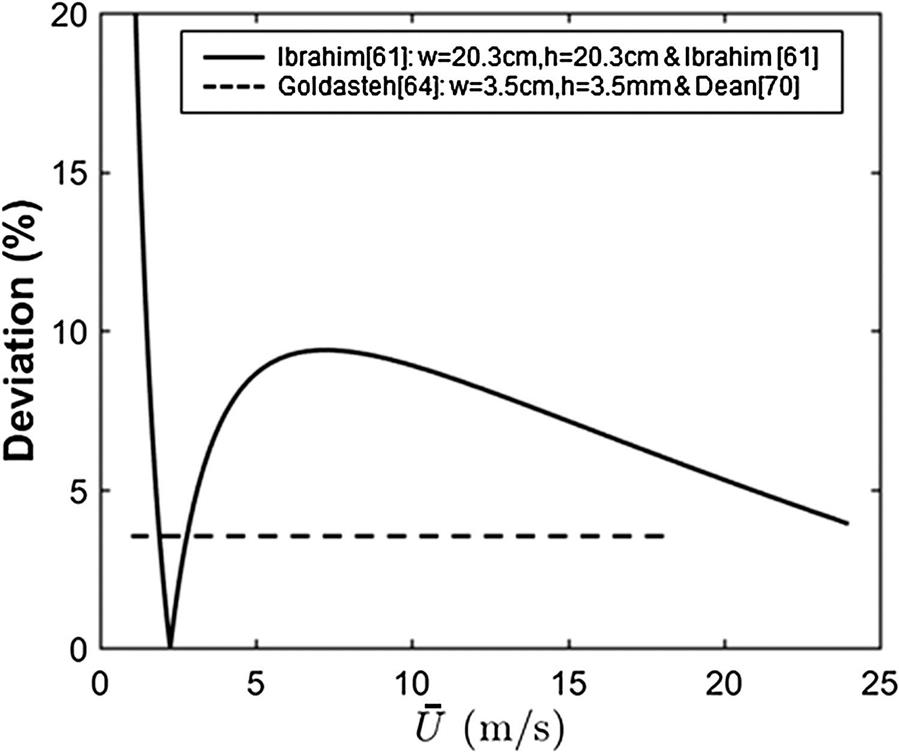
The estimated shear velocities evaluated from the different expressions listed in Table 2.6 are comparable. For example, the discrepancies of the relationships that were used by Ibrahim et al. [61] (Eq. 2.46), and Goldasteh et al. [64] (Eq. 2.48) from the Blasius relationship (Eq. 2.45) are shown in Fig. 2.4. It is observed that the resulting shear velocities obtained from Eq. (2.46) are within 10% of the Blasius relationship for the case of the Ibrahim et al. [61] wind tunnel experiment condition. For the narrow cross-section duct of Goldasteh et al. [64], the experimental shear velocity evaluated from Eq. (2.48) is within 4% of that obtained from the Blasius equation. Thus, in this chapter, for simplicity and consistency, the Blasius relationship given by Eq. (2.45) is used for evaluating the shear velocity from the free-stream/mean velocity for all cases that did not report the value of shear velocity directly in their study.
3.2 Experimental Resuspension Data
All experimental data from the studies listed in Table 2.5 were digitized and incorporated in a database. The resuspension data from the combined data set were compiled and analyzed, and the resuspension fraction as a function of various particle and flow properties—flow velocity, particle size, particle surface materials, surface roughness, RH, as well as time dependency—was studied. The results are presented and discussed in Sections 3.2.1–3.2.3.
3.2.1 Particle Size
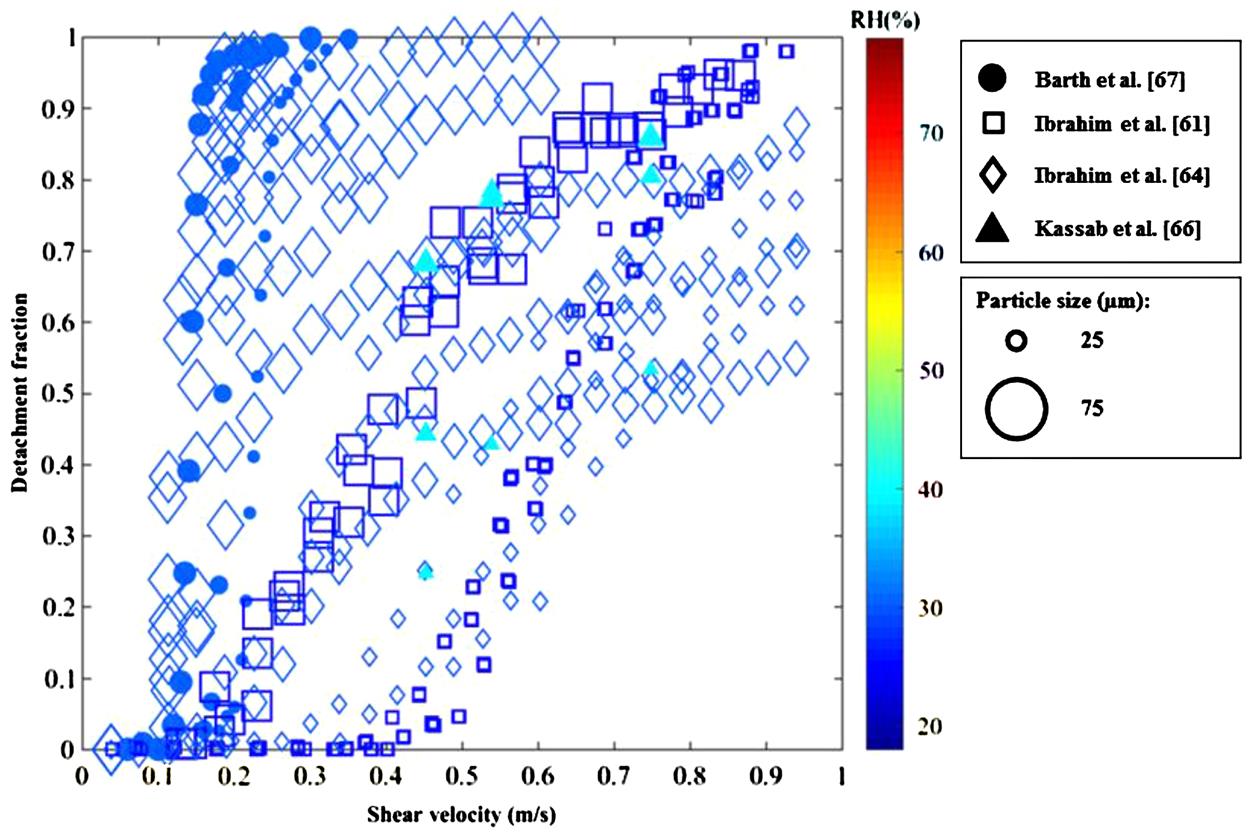
The particle size is a critical factor that significantly affects its resuspension efficiency. The experimental data for the detachment fraction of glass particles from glass substrates as a function of shear velocity and particle size, as reported by a few studies listed in Table 2.5, are shown in Fig. 2.5. These experimental results are for particle sizes in the range of 25–75 μm. Fig. 2.5 shows the expected S-shape variation of the detachment fraction as a function of shear velocity. It is also seen that larger particles have higher detachment fractions at lower shear velocities, consistent with the theoretical predictions of easier removal of larger particles [15,72].
Focusing on glass particles in the size range of ~30–35 μm, Fig. 2.6 shows the variation of detachment fractions from a glass substrate as reported by Ibrahim et al. [61,63] and Barth et al. [67]. While all the data show an increasing trend of detachment fraction with shear velocity, it is seen that the rates of increase are not consistent among these studies; that is, for almost identical particle sizes and particle–surface materials (glass–glass), significant differences in the measured detachment fractions for the same shear velocity are observed. One possible reason for this discrepancy could be due to the differences in the properties of the glass used in these two studies. Ibrahim et al. [61] used soda lime glass particles (Duke Scientific, Palo Alto, CA), while Barth et al. [67] used barium titanate glass particles (APPIE, The Association of Powder Process Industry and Engineering, Kyoto, Japan). Ibrahim et al. [61] reported a surface energy of 0.4 J/m2 for glass particles. However the surface energy of the glass used by Barth et al. [67] was not reported. Another possible reason could be the difference in the surface preparations for the two cases. Barth et al. [67] coated the glass substrate with a transparent indium tin oxide (ITO) layer to avoid electrostatic effects. However, Ibrahim et al. [61,62] prepared the substrate by cleaning it with phosphate-free detergent, and then immersing it in dilute nitric acid, and heating it at 200°C after rinsing in distilled water. Surface coating can significantly alter surface–particle interactions, and hence the relevant adhesion properties for the samples in the Barth et al. [67] case would be for the coating material (ITO) rather than the underlying glass substrate. Furthermore, it is also possible that the electrostatic effect influenced the measurements of Ibrahim et al. [61,63].
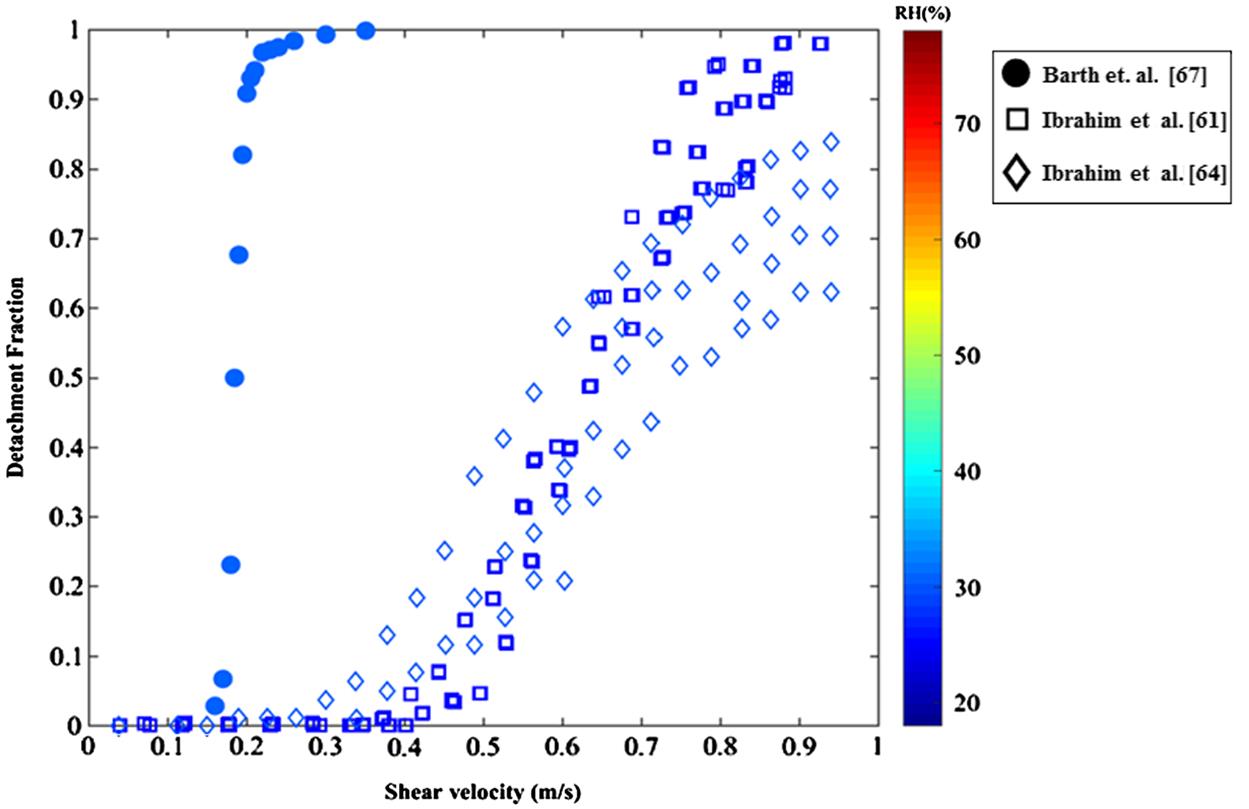
Surface roughness could also be another important factor for the differences seen in Fig. 2.6. The two studies reported different measures of surface roughness. Ibrahim et al. [61] measured the surface roughness by AFM, and reported a standard deviation of about 1.7 nm. Barth et al. [67] measured surface roughness, R values (Ra, Rz, Rmax) using a Perthometer. For the glass substrates they used, these values are Ra = 25 nm, Rz = 220 nm, and Rmax = 477 nm. The glass substrate of Barth et al. [67] was much rougher than the one used by Ibrahim et al. [61]. The increase in fine surface roughness leads to lower critical shear velocity for particle removal.
A final reason that could have contributed to the dissimilar results in the two studies is the difference in their near-wall velocities. Barth et al. [67] hypothesized that the flow boundary layer formation in the Ibrahim et al. [61] experiment was different from their experimental setup, and that may explain some of the differences in the experimental detachment fraction data. The results presented in Fig. 2.6 suggest that the particle size, substrate roughness, and flow properties must all be carefully measured and evaluated for full characterization of the resuspension process.
3.2.2 Relative Humidity
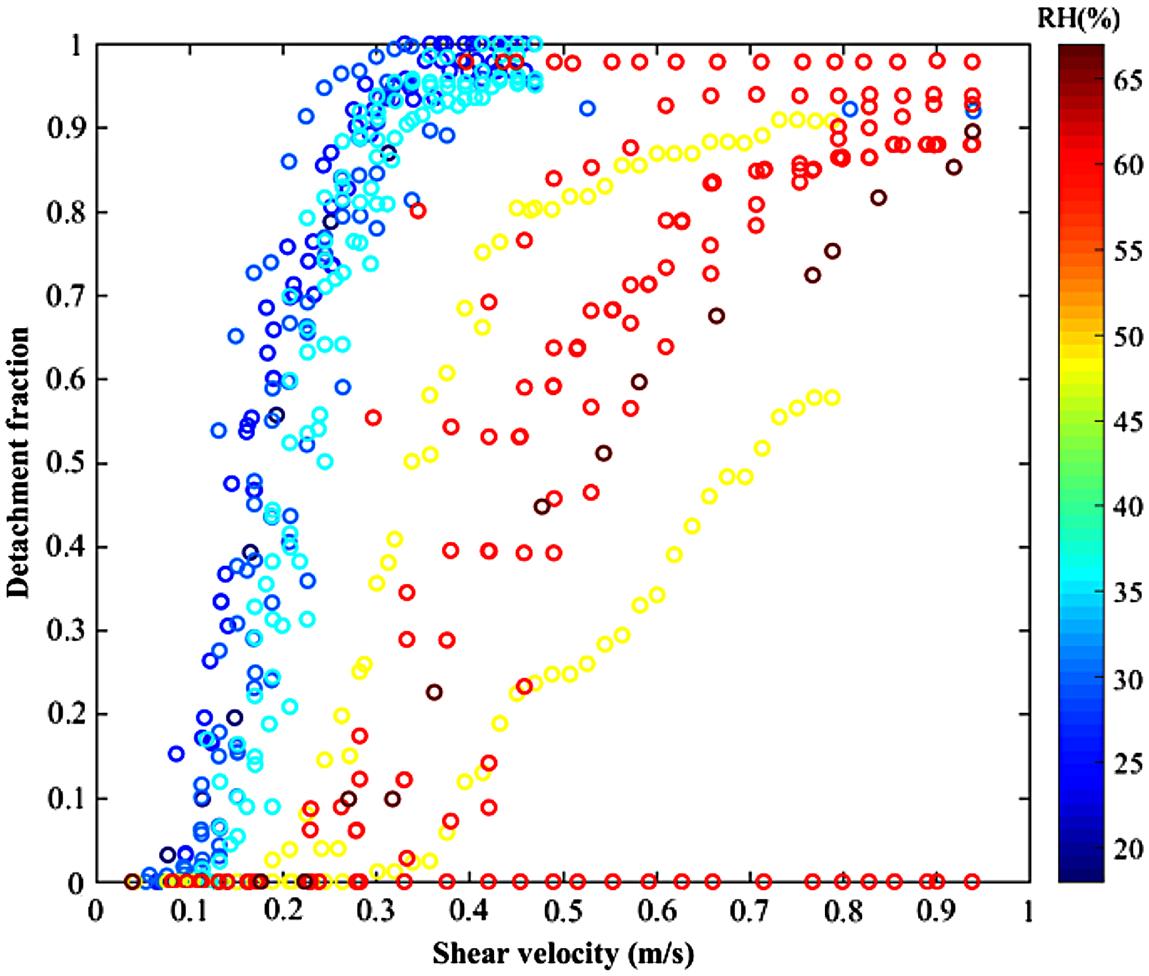
RH also has significant effect on particle removal because of the capillary force due to formation of a liquid meniscus at the particle–substrate contact that significantly increases the adhesion force. Study of the RH effect on particle resuspension, however, is quite challenging due to the need for simultaneously controlling RH and the flow field in the wind tunnel. Podczeck et al. [45] studied the influence of RH on the adhesion force of micrometer-sized particles. Ibrahim et al. [62] investigated the humidity effect for a range of 18–67% for resuspension of steel particles (~70 µm) from a glass substrate. Fig. 2.7 shows the data of Ibrahim et al. [62] for particle removal versus shear velocity, with the colors representing RH. The effect of increasing humidity on particle removal is clearly observed from this figure; that is, with increasing humidity, a higher free-stream velocity is needed for particle removal. The effect of RH on removal rate can be complicated by the effects of other factors. For instance, Ibrahim et al. [62] found that the removal of particles deposited at a RH of 61% was much easier if the experiment was conducted soon after deposition than if it was conducted 24 hours later. Thus, the RH maintained during deposition and the residence time of particles on a substrate are also important factors that show the historical dependence effect on the resuspension.
3.2.3 Time Dependency
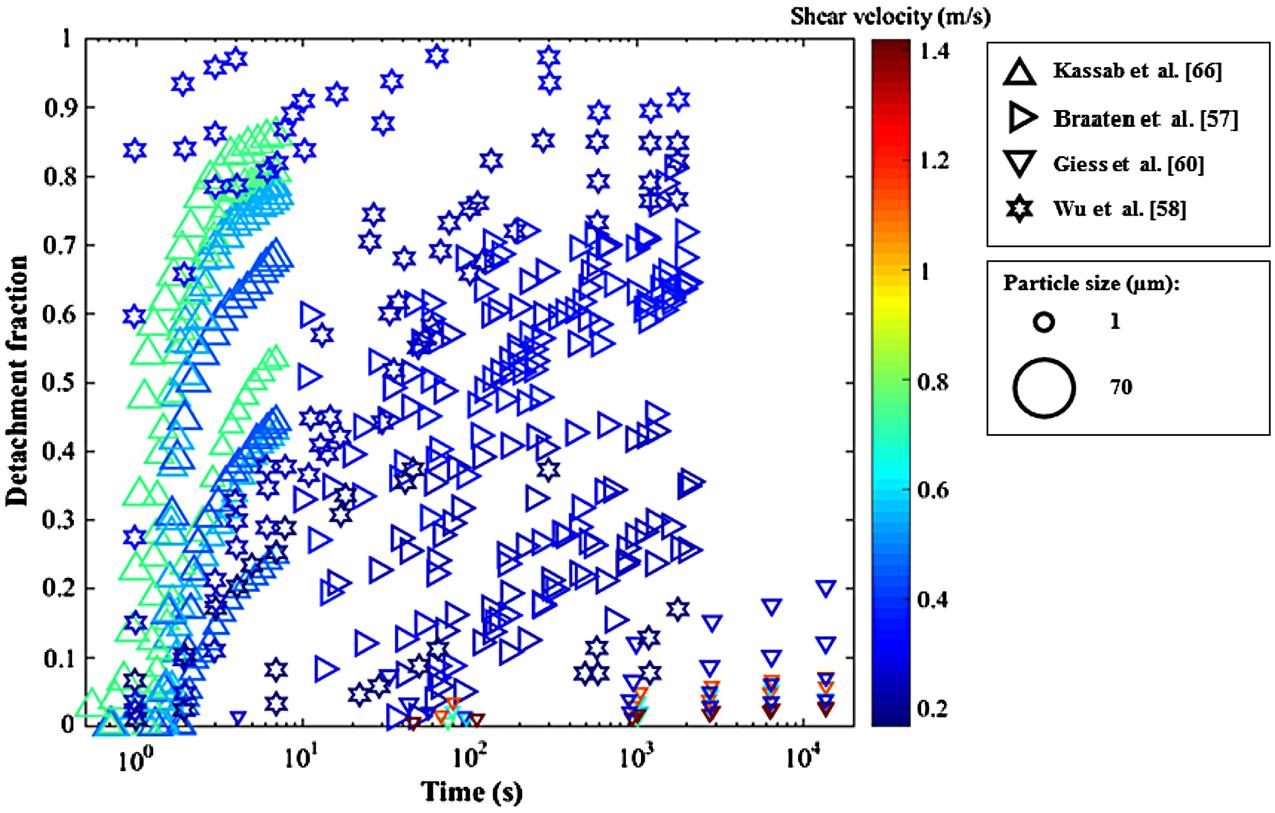
Time dependency of particle removal from surfaces was reported by Braaten et al. [57], Wu et al. [58], Giess et al. [60], and Kassab et al. [66], among others. They showed that the detachment fraction varies with time for a given flow velocity, with the resuspension rate rapidly decreasing with increasing time [60]. To examine the time dependency of particle removal, the variation of detachment fraction as a function of time for a constant velocity (flow rate) for Lycopodium spores on glass substrate as reported by Braaten et al. [57] and Wu et al. [58] is shown in Fig. 2.8. Also included in Fig. 2.8 are the removal efficiencies of 1 μm silica particles on grass [60] and 26–45 µm glass particles on glass substrate [66]. These wind tunnel experiments show that the detachment fraction increases with time for a constant flow rate, but the slope of the removal fraction curves levels off after several minutes. This trend is more clearly seen for the data of Wu et al. [58]. Note that the detachment fraction data of Braaten et al. [57] and Wu et al. [58] are different for repeated experiments for the same flow velocity. This results in significant scatter in the data presented in Fig. 2.8. The time dependence of the resuspension process and its variability during experiments repeated under seemingly identical conditions are not fully understood, but it has been suggested that these effects originate from the interactions of particles with turbulent flows [26,31,32]. Kline et al. [73] and Corino and Brodkey [74] observed that there were sudden random eruptions of fluid in a turbulent boundary layer that are naturally three-dimensional, and are referred to as burst/inrush processes. It is also conjectured that inhomogeneity in the surface roughness could be another reason for the time dependence of adhesion forces and their variability. In summary, particle removal from surfaces is related to the unsteady turbulent boundary layer and random contact of surface asperities.
4 Comparison of Theory Against Experimental Data for Particle Resuspension
The particle resuspension data obtained from wind tunnel studies can be compared against the physics-based theoretical models of particle removal for model validation and testing of accuracy. The predictions of particle removal from theoretical models discussed in Section 2 are investigated here as a function of particle size. The predicted critical shear velocity versus particle size for steel particles on glass substrate using the JKR and DMT models assuming smooth surfaces is shown in Fig. 2.9. The critical shear velocity is calculated from the force moment balance relationship for rolling detachment mechanism, introduced in Section 2.3. In rolling removal, the hydrodynamic moment acting on a particle is evaluated from the relationships for drag force (Eqs. 2.28 and 2.33, for nonlinear drag) and hydrodynamic torque (Eq. 2.34). The maximum adhesion resistance moment is evaluated from Eqs. (2.15) and (2.16), respectively, for the JKR and DMT models. Then the rolling moment balance given by Eq. (2.36) was solved using an iterative method for evaluating the critical shear velocity, ![]() Note that the lift force and the gravitational force are negligibly small and are neglected. The values of work of adhesion, WA, and composite Young’s modulus, K, used in these analyses are listed in Table 2.7.
Note that the lift force and the gravitational force are negligibly small and are neglected. The values of work of adhesion, WA, and composite Young’s modulus, K, used in these analyses are listed in Table 2.7.
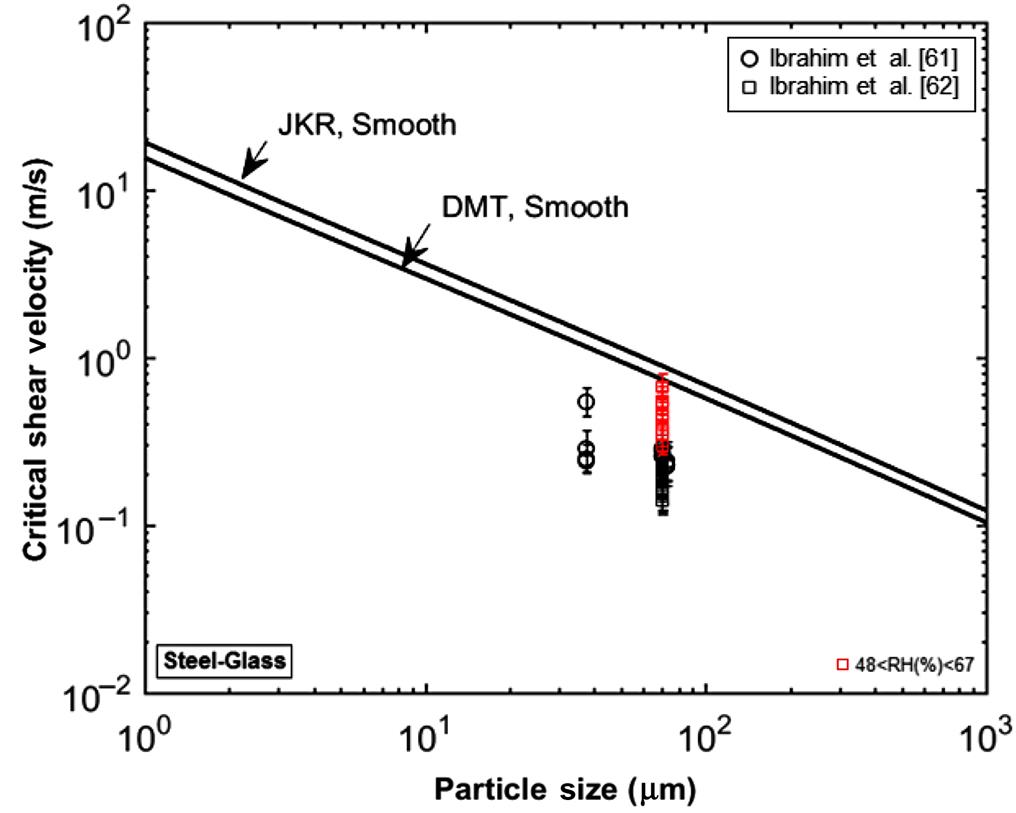
Table 2.7
| Particle | E1 (GPa) | ν1 | Substrate | E2 (GPa) | ν2 | K (GPa) | WA (J/m2) | References |
| Glass | 69 | 0.2 | Glass | 69 | 0.2 | 47.92 | 0.4 | [63] |
| Glass | 69 | 0.2 | Steel | 210 | 0.29 | 72.96 | 0.15 | [15,32] |
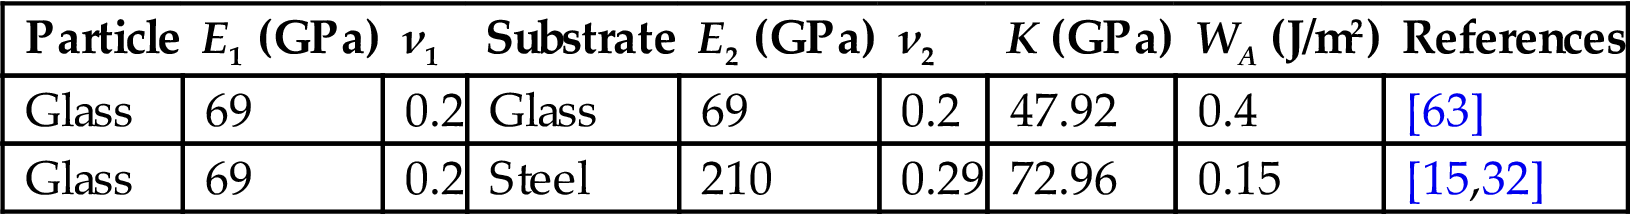
Fig. 2.9 shows that the critical shear velocity increases as particle size decreases. Thus, significant hydrodynamic forces are required to remove nanometer-scale particles from the surface. It is also seen that the DMT adhesion model predicts somewhat lower critical shear velocity for particle removal compared to the JKR model.
For comparison, the experimental data of Ibrahim et al. [62,63] for detachment fractions versus shear velocity for the same particle–substrate combination are also shown in Fig. 2.9. The experimental data for resuspension of steel particles from a glass substrate (Fig. 2.7) shows an S-shape curve with u*. The data points shown in Fig. 2.9 are for the threshold shear velocity corresponding to a detachment fraction of 0.5 with the shear velocity uncertainty corresponding to 0.25 and 0.75 detachment fractions. It is seen that the experimentally observed critical velocities are significantly lower than those predicted by the JKR or DMT adhesion models for contact of smooth surfaces.
The experimental data for the detachment of steel particles from glass substrate under moderate-to-high RH (45%<RH<67%) condition are shown by red squares in Fig. 2.9 for comparison. It is observed that for the same particle size, the RH has a significant effect on the critical shear velocity, increasing it by nearly an order of magnitude in this case. The effect of capillary force due to the formation of water meniscus around the particle under high-humidity conditions on particle removal model was studied by Ahmadi et al. [37], where significant increase of the critical shear velocity was predicted. However, a completely satisfactory theoretical model for predicting the effect of different levels of RH on particle removal is not yet available.
4.1 Roughness Effect
In the real world, all surfaces have some fine roughness, and it is found that even a small amount of roughness significantly affects particle adhesion and removal [17,20,21]. According to the currently available theoretical models, nondimensional roughness, Δc, is the key parameter for including the effect of surface roughness [44]. Fig. 2.10 compares the theoretical model predictions for rolling removal of steel particles from a glass surface with the effect of fine roughness included. Here values of 0.8 and 1 for surface roughness parameter, Δc, are used. It is seen that for this range of values of the surface roughness parameter, the model predicts the experimental data for removal of the steel particle from the glass substrate with reasonable accuracy.
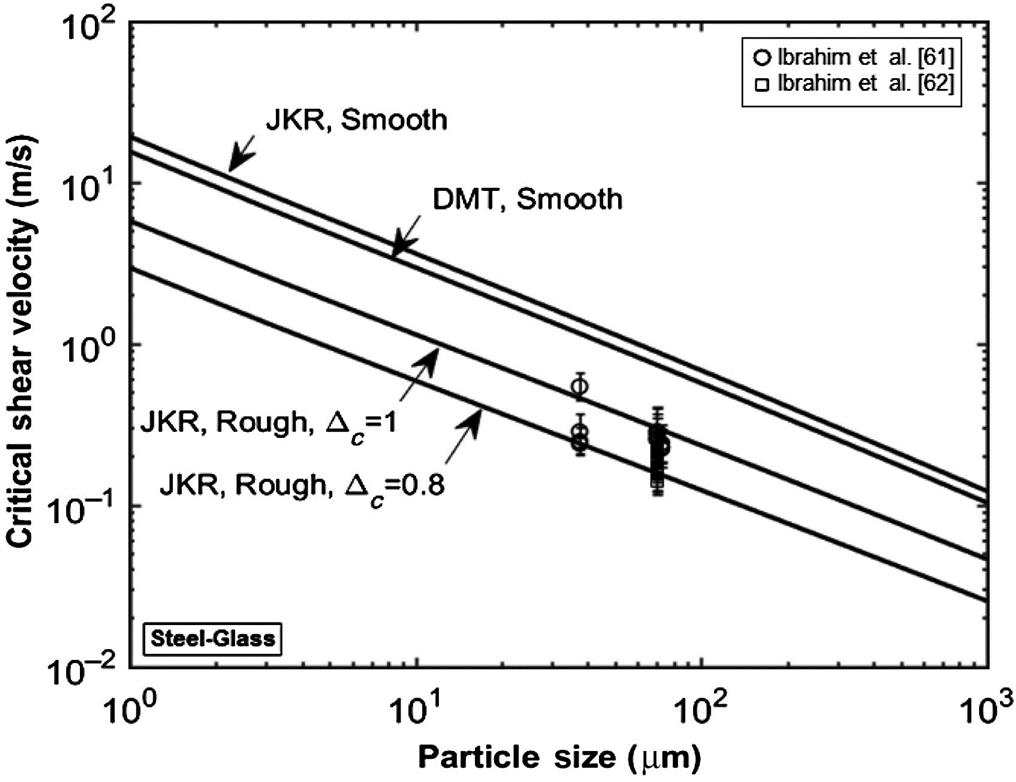
The method for evaluating the critical shear velocity in the presence of surface roughness is similar to that for the smooth surface model that was described previously by solving the force balance of adhesion moment along with the hydrodynamic moment. Goldasteh et al. [44] solved the moment balance equation and proposed an implicit relationship for the critical shear velocity that is given by Eq. (2.44) and is used in this section. The presented results show that the adhesion model for rough surfaces, with an appropriate value of roughness parameter, can predict the experimentally observed critical shear velocities for particle detachment. Fig. 2.10 also shows that the nondimensional roughness parameter significantly affects the predicted critical shear velocity for removal of particles from rough surfaces.
The details of the electrostatic forces acting on a particle in contact with a surface are not discussed in this chapter. However, Ranade [47], Soltani and Ahmadi [18], and Zhang and Ahmadi [48], among others, have studied the effect of electrostatic forces on particle adhesion and detachment.
5 Summary and Conclusions
In this chapter, the mechanics of particle removal from surfaces were reviewed, and the available adhesion models were described. Particular attention was given to the effects of particle size, RH and fine surface roughness on particle removal. The hydrodynamic forces and moment acting on a particle in contact with a surface were described. Turbulence burst model for near-wall flow was discussed, and the burst intensity factor for evaluation of the peak near-wall velocity was introduced. Based on the force balance analysis, the critical shear velocities for particle removal from substrates for different adhesion models were evaluated.
The experimental data for particle resuspension in the wind tunnel studies available in the literature were collected, compiled, and analyzed. The critical shear velocities for particle removal in different wind tunnel experiments were evaluated and compared with each other. Sample predicted critical shear velocities for smooth and rough surfaces from the recent theoretical model were also presented, and compared against the available experimental data. Based on the results presented, the following conclusions are drawn:
![]() The critical shear velocity decreases as particle size increases. This trend was observed in the experimental data and also predicted by the theoretical models.
The critical shear velocity decreases as particle size increases. This trend was observed in the experimental data and also predicted by the theoretical models.
![]() The fine surface roughness significantly decreases the adhesion force between the particle and the surface; thus, particles can be more easily resuspended from surfaces with fine roughness.
The fine surface roughness significantly decreases the adhesion force between the particle and the surface; thus, particles can be more easily resuspended from surfaces with fine roughness.
![]() Under the assumption of smooth surfaces, the theoretical model predictions markedly overestimate the experimental data for the critical shear velocity.
Under the assumption of smooth surfaces, the theoretical model predictions markedly overestimate the experimental data for the critical shear velocity.
![]() Inclusion of the surface roughness effects in the removal model improves the agreement between the predictions and the experimental data. However, the model prediction is sensitive to the value of the roughness parameter.
Inclusion of the surface roughness effects in the removal model improves the agreement between the predictions and the experimental data. However, the model prediction is sensitive to the value of the roughness parameter.
![]() Surface coating significantly affects particle resuspension due to alteration of the van der Waals forces and/or reduction of the electrostatic interaction between the particle and the substrate.
Surface coating significantly affects particle resuspension due to alteration of the van der Waals forces and/or reduction of the electrostatic interaction between the particle and the substrate.
![]() The available experimental data show that the RH significantly affects particle removal. The critical shear velocity markedly increases at high RH.
The available experimental data show that the RH significantly affects particle removal. The critical shear velocity markedly increases at high RH.
![]() When particles reside on a surface in a high-RH atmosphere, the data show that longer residence time reduces the particle resuspension rate.
When particles reside on a surface in a high-RH atmosphere, the data show that longer residence time reduces the particle resuspension rate.
![]() The effect of time on particle removal efficiency has been observed in several experimental studies. A completely satisfactory theoretical model, however, is not yet available.
The effect of time on particle removal efficiency has been observed in several experimental studies. A completely satisfactory theoretical model, however, is not yet available.