
Chapter 7: Memory Forensics with Volatility
In the previous chapters, we looked at the various types of memory. This included RAM and the swap (or paging) file, which is an area of the hard disk drive which, although slower, functions as RAM. We also discussed the issue of RAM being volatile, meaning the data in RAM is easily lost when there is no longer an electrical charge or current to RAM. With the data on RAM being the most volatile, it ranks high in the order of volatility and must be forensically acquired and preserved as a matter of high priority.
Many types of data and forensic artifacts reside in RAM and the paging file. As discussed earlier, login passwords, user information, running and hidden processes, and even encrypted passwords are just some of the many types of interesting data that can be found when performing RAM analysis, further compounding the need for memory forensics.
In this chapter, we will look at the very powerful Volatility Framework and its many uses in memory forensics.
In this chapter, we'll cover the following topics:
- Downloading sample test files for analysis within Volatility
- Installing the Volatility Framework in Kali Linux
- Using various plugins to analyze memory dumps
- Installing and using Evolve (a Volatility GUI)
Introducing the Volatility Framework
The Volatility Framework is an open source, cross-platform, incident response framework that comes with many useful plugins that provide the investigator with a wealth of information from a snapshot of memory, also known as a memory dump. The concept of volatility has been around for a decade, and apart from analyzing running and hidden processes, it is also a very popular choice for malware analysis.
To create a memory dump, several tools, such as Belkasoft Ram Capturer, FTK Imager, DD, DC3DD, Computer Aided INvestigative Environment (CAINE), Helix, and Linux Memory Extractor (LiME), can be used to acquire the memory image or memory dump, and then be investigated and analyzed by the tools within the Volatility Framework.
The Volatility Framework can be run on any operating system (32- and 64-bit) that supports Python, including the following:
- Windows XP, 7, 8, 8.1, and Windows 10 (14393.447)
- Windows Server 2003, 2008, 2012/R2, and 2016
- Linux 2.6.11–4.2.3 (including Kali, Debian, Ubuntu, CentOS, and more)
- macOS Leopard (10.5.x) and Sierra (10.12.x)
Volatility supports several memory dump formats (both 32- and 64-bit), including the following:
- Windows crash and hibernation dumps (Windows 7 and earlier)
- VirtualBox core dumps
- VMware .vmem dumps
- VMware saved state and snapshots: .vmss/.vmsn
- Raw physical memory: .dd
- Direct physical memory dump over IEEE 1394 FireWire
- Expert Witness Format (EWF): .E01
- QEMU (Quick Emulator)
- Firewire
- HPAK
Volatility even allows for conversion between these formats and boasts of being able to accomplish everything similar tools can.
Downloading test images for use with Volatility
For this chapter, we'll be using a Windows XP image named 0zapftis.vmem, which can be downloaded directly from https://github.com/volatilityfoundation/volatility/wiki/Memory-Samples.
The reason for using this specific Windows XP sample memory dump is that it is one of the very few dumps publicly available that contains isolated malware that will not affect the user's machines.
Select the link within the Description column, Malware – R2D2 (pw: infected), to download the 0zapftis.vmem image. When prompted to extract, the password is infected:

Figure 7.1 – Volatility sample file download list
It can also be downloaded directly from http://www.mediafire.com/file/yxqodp1p2aca91x/0zapftis.rar.
Important note
There are many other images on this page that are also publicly available for analysis. To practice working with the Volatility Framework and further enhance your analytical skills, you may wish to download as many as you like and use the various plugins available in Volatility.
Image location
As we'll soon see, all the plugins in the Volatility Framework are used through the terminal. To make access to the image file easier by not having to specify a lengthy path to the image, I've saved the 0zapftis.rar file to my desktop and I'll need to extract the file using unrar. UnRAR is already installed in Kali Linux, but you can install it by typing apt install unrar into the terminal.
You can also list the contents of the 0zapftis.rar file by first changing directories to the folder in which you downloaded the file and then typing in unrar l 0zapftis.rar. Remember that the password to view or extract the contents is infected:
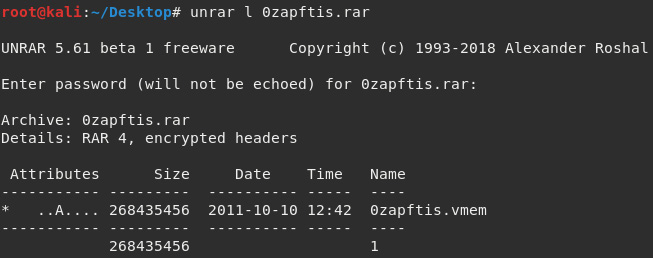
Figure 7.2 – Using the unrar command to extract the sample file
Now, we can extract the 0zaoftis.vmem file by typing in unrar e -r 0zapftis.rar:

Figure 7.3 – Extraction of the compressed sample file
Once the memory file (0zapftis.vmem) has been extracted to the desktop (or the location of your preference), we can now use the Volatility Framework to analyze the dump.
Using Volatility in Kali Linux
While still within the desktop directory, we can now install a stable version of Volatility and begin our forensic investigation and analysis of the memory dump (the vmem file) and search for various artifacts.
To view the options within Volatility, type in volatility –h. If Volatility does not start, or a command not found error is returned, install the Volatility Framework by typing apt-get install volatility. During the installation, you will be prompted to press Y (yes) to download the files required for the installation:

Figure 7.4 – Installing Volatility in Kali Linux
Once the installation is complete, type volatility –h to view the options within the Volatility Framework:

Figure 7.5 – Using the help command in Volatility
Important note
For easy reference and a complete list of all the plugins at your fingertips, open a separate terminal and run the volatility -h command. This is far easier than having to scroll to the top of the terminal to Volatility plugin commands.
The following screenshot shows a snippet of some of the many plugins within the Volatility Framework:
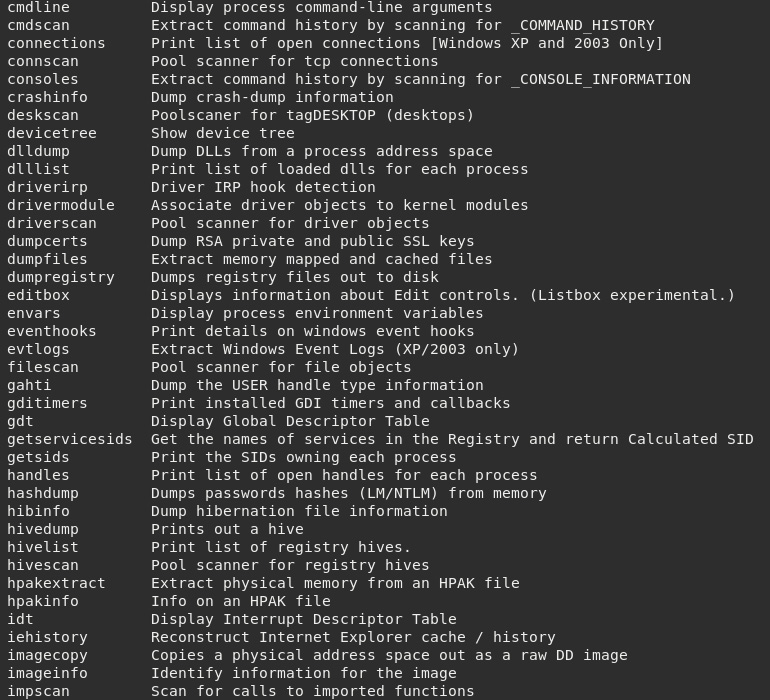
Figure 7.6 – Plugins available in Volatility
This list comes in handy when performing analysis as each plugin comes with its own short description. The following screenshot shows a snippet of the help command, which gives a description of the imageinfo plugin:
Figure 7.7 – The imageinfo plugin
The format for using plugins in Volatility is as follows:
volatility -f [filename] [plugin] [options]
For example, to use the imageinfo plugin against the .vmem file we downloaded, we would type the following:
volatility -f 0zapftis.vmem imageinfo
It's good practice to have the Volatility help commands open in a second terminal for easy access to the commands without having to constantly scroll up and down. We now need to choose a profile (operating system version) to work with in Volatility.
Choosing a profile in Volatility
All operating systems store information in RAM. However, they may be situated in different locations within the memory according to the operating system used. In Volatility, we must choose a profile that best identifies the type of operating system and service pack that helps Volatility in identifying locations that store artifacts and useful information.
Choosing a profile is relatively simple as Volatility does all the work for us using the imageinfo plugin.
The imageinfo plugin
This plugin gives information about the images used, including the suggested operating system and Image Type (Service Pack, the Number of Processors used, and the date and time of the image).
The following command is used to provide the image information:
volatility -f 0zapftis.vmem imageinfo
The output from this command displays the suggested profiles we should consider using when analyzing the memory file using various plugins:
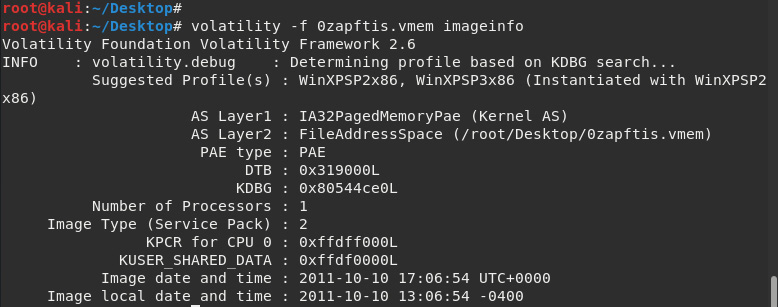
Figure 7.8 – Using the imageinfo plugin
The imageinfo output shows the suggested profiles as WinXPSP2x86:
- WinXP: Windows XP
- SP2/SP3: Service Pack 2/Service Pack 3
- x86: 32-bit architecture
The image type, or service pack, is displayed as 2, suggesting that this is a Windows XP Service Pack 2 32-bit (x86) operating system, which will be used as the profile for the case along with the plugins:

Figure 7.9 – Results of the imageinfo plugin
Once the profile has been chosen, we can proceed with using Volatility plugins for the analysis of the 0zapftis.vmem image.
Process identification and analysis
To identify and link connected processes, their IDs, times started, and offset locations within the memory image, we will be using the following four plugins to get us started:
The pslist plugin
This tool not only displays a list of all running processes, but also gives useful information, such as the Process ID (PID) and the Parent Process ID (PPID), and also shows the time the processes were started.
The command to run the pslist plugin is as follows:
volatility --profile=WinXPSP2x86 -f 0zapftis.vmem pslist
The output of the pslist plugin is as follows:

Figure 7.10 – Results of the pslist plugin
In the preceding screenshot, we can see the that System, winlogon.exe, services.exe, svchost.exe, and explorer.exe services were all started first, followed by reader_sl.exe, alg.exe, and finally VMWareUser.exe.
The PID identifies the process and the PPID identifies the parent of the process. Looking at the pslist output, we can see that the winlogon.exe process has a PID of 632 and a PPID of 536. The PPIDs of the services.exe and lsass.exe processes (directly after the winlogon.exe process) are both 632, indicating that winlogon.exe is, in fact, the PPID for both services.exe and lsass.exe.
For those new to PIDs and processes themselves, a quick Google search can assist with identification and description information. It is also useful to become familiar with many of the start up processes in order to readily point out processes that may be unusual or suspect.
The timing and order of the processes should also be noted as these may assist in investigations. Although not seen in the previous output due to limited screen space on our monitors, if we scroll down a bit, we can also see that explorer.exe, with a PID of 1956, is the PPID of reader_sl.exe.
Adding to this analysis, we can see that there are two instances of wuauclt.exe with svchost.exe as the PPID.
The pstree plugin
Another process identification command that can be used to list processes is the pstree command. This command shows the same list of processes as the pslist plugin, but indentation is also used to identify child and parent processes.
Run the pstree plugin by typing the following command:
volatility --profile=WinXPSP2x86 -f 0zapftis.vmem pstree
The output of the pstree plugin is as follows:
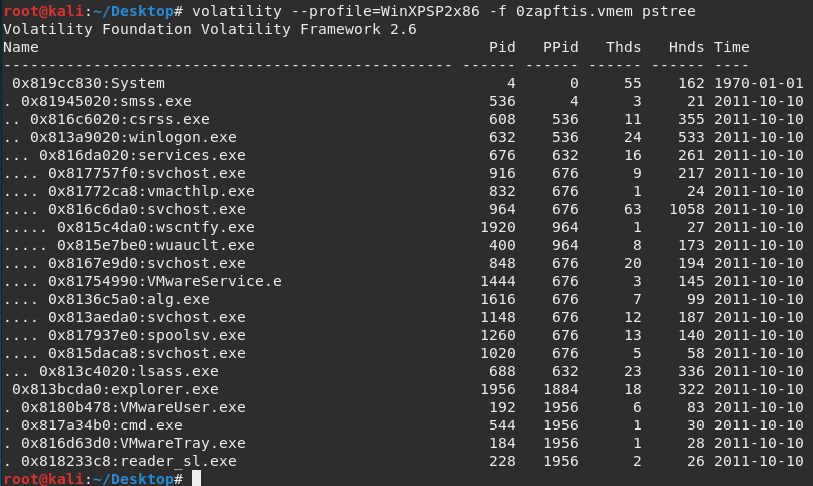
Figure 7.11 – Results of the pstree plugin
In the preceding screenshot, the last five processes listed are explorer.exe, VMWareUser.exe, cmd.exe, VMWareTray.exe, and reader_sl.exe. explorer.exe is not indented, while all the others are, indicating that they are all child processes of explorer.exe (which is the parent process).
The psscan plugin
The psscan command displays inactive and even hidden processes that can be used by malware, such as rootkits, and are well known for doing just that to evade discovery by users and antivirus programs.
Let's run the psscan plugin by typing the following:
volatility --profile=WinXPSP2x86 -f 0zapftis.vmem psscan
The output of the psscan plugin is as follows:
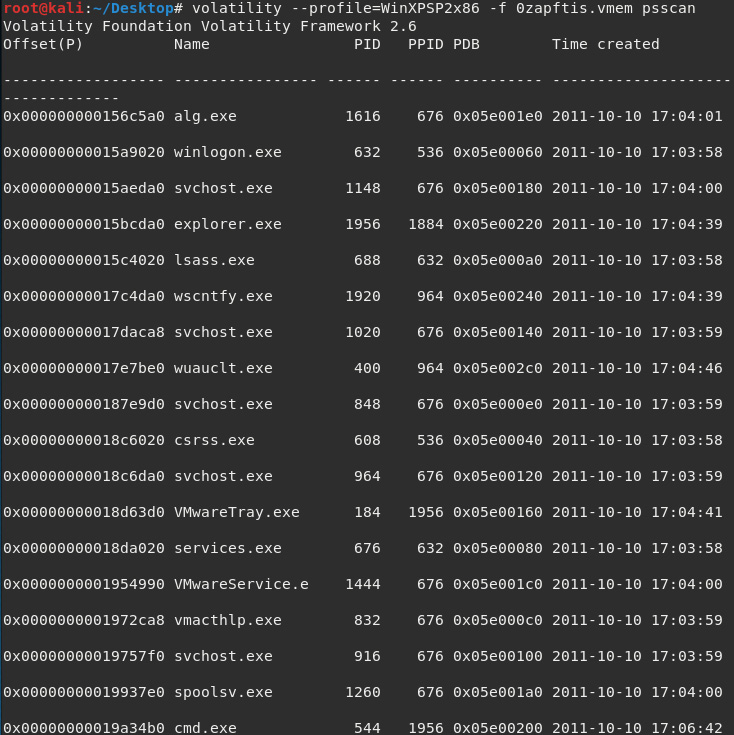
Figure 7.12 – Results of the psscan plugin
The output of both the pslist and psscan commands should be compared to observe any anomalies.
The psxview plugin
As with the psscan plugin, the psxview plugin is used to find and list hidden processes. With psxview, however, a variety of scans are run, including pslist and psscan.
The command to run the psxview plugin is as follows:
volatility --profile=WinXPSP2x86 -f 0zapftis.vmem psxview
The output of the psxview plugin is as follows:
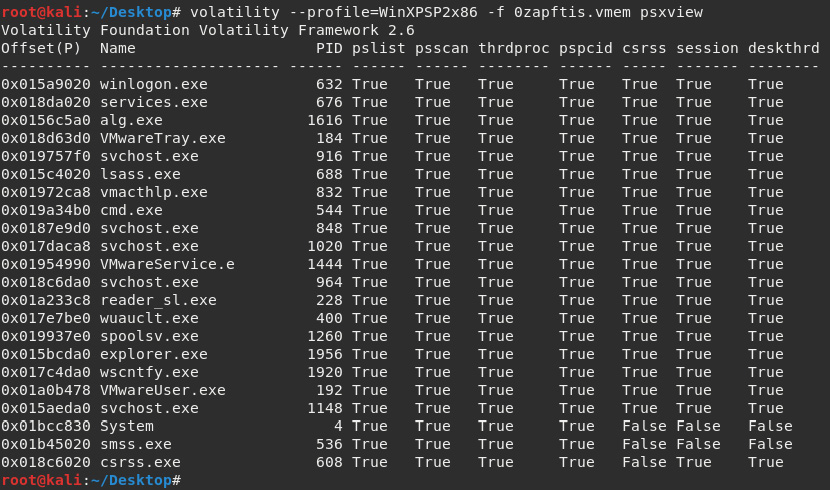
Figure 7.13 – Results of the psxview plugin
The psxview plugin lists the processes and compares the outputs listed as True or False. A False output means that the process is hidden, as in the csrss, session, and deskthrd columns, with False outputs for System, sms.exe, and csrss.exe, which tells us that the processes are not found in these areas and should be inspected further.
Now that we have viewed and documented the services that were running at the time the memory dump was taken, let's try to find network services and connections that may also have been established at that time.
Analyzing network services and connections
Volatility can be used to identify and analyze active, terminated, and hidden connections, along with ports and processes. All protocols are supported and Volatility also reveals details of ports used by processes, including the times they were started.
For these purposes, we use the following two commands:
- connscan
- sockets
The connscan plugin
To display a list of connections that have been terminated, the connscan command is used. The connscan command is also only used for Windows XP and 2003 servers (both 32- and 64-bit) systems:
volatility --profile=WinXPSP2x86 -f 0zapftis.vmem connscan
The output of the connscan plugin is as follows:
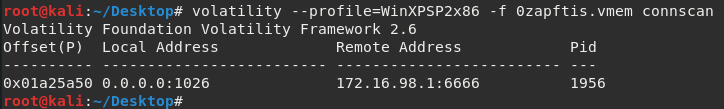
Figure 7.14 – Results of the connscan plugin
Looking at the preceding screenshot, we see that a connection was made to 172.16.98.1 on port 6666.
For those knowledgeable about port numbers, port 6666 is usually an indication of malware. According to https://www.speedguide.net/port.php?port=6666, port 6666 is usually used by Trojans to maintain backdoor connections to hosts and possibly steal information.
We will also look into finding and analyzing traces of malware using the Volatility Framework in Chapter 8, Artifact Analysis, where we'll revisit Volatility and have a look at ransomware analysis.
If using the connections plugin on other examples and cases, you can obtain more information on remote IP addresses using IP lookup tools, such as whois, and websites, such as http://whatismyipaddress.com/ip-lookup.
The sockets plugin
The sockets plugin can be used to give additional information on listening sockets. Although User Datagram Protocol (UDP) and Transmission Control Protocol (TCP) are the only protocols listed in the output in the following screenshot, the sockets command supports all protocols.
To use the sockets plugin, type the following command:
volatility --profile=WinXPSP2x86 -f 0zapftis.vmem sockets
The output of the sockets plugin is as follows:

Figure 7.15 – Results of the sockets plugin
We were able to view network and socket information in this section. Let's now delve a bit deeper into memory analysis using other plugins to reveal programs and users that may have been running and active at the time of the memory acquisition.
DLL analysis
Dynamic Link Libraries (DLLs) are specific to Microsoft and contain code that can be used by multiple programs simultaneously. Inspection of a process's running DLLs and the version information of files and products may assist in correlating processes. Processes and DLL information should also be analyzed as they relate to user accounts.
For these tasks, we can use the following plugins:
- verinfo
- dlllist
- getsids
The verinfo plugin
This command lists version information (verinfo) about portable executable (PE) files. The output of this file is usually quite lengthy and so can be run in a separate terminal, should the investigator not wish to continuously scroll through the current terminal to review past plugin command lists and output.
The verinfo command is used as follows:
volatility --profile=WinXPSP2x86 -f 0zapftis.vmem verinfo
The output of the verinfo plugin is as follows:

Figure 7.16 – Results of the verinfo plugin
Let's now have a look at any DLL information that may be relevant.
The dlllist plugin
The dlllist plugin lists all the running DLLs at that time in memory. DLLs are composed of code that can be used by multiple programs simultaneously.
The dlllist plugin is used as follows:
volatility --profile=WinXPSP2x86 -f 0zapftis.vmem dlllist
The output of the dllist plugin is as follows:

Figure 7.17 – Results of the dlllist plugin
The getsids plugin
All users can also be uniquely identified by a Security Identifier (SID). The getsids command has four very useful items in the order in which the processes were started (refer to the pslist and pstree command screenshots in Figure 7.10 and Figure 7.11).
The format for the getsids command output is as follows:
[Process] (PID) [SID] (User)
The first result in the list, for example, lists the following:
System (4) : S – 1 – 5- 18 (User)
- System: Process
- (4): PID
- S - 1 – 5- 18: SID
- User: Local system
Important note
If the last number in the SID is in the range of 500, this indicates a user with administrator privileges. For example, S – 1 – 5 – 32 – 544 (administrators).
The getsids plugin is used as follows:
volatility --profile=WinXPSP2x86 -f 0zapftis.vmem getsids
The output of the getsids plugin is as follows:
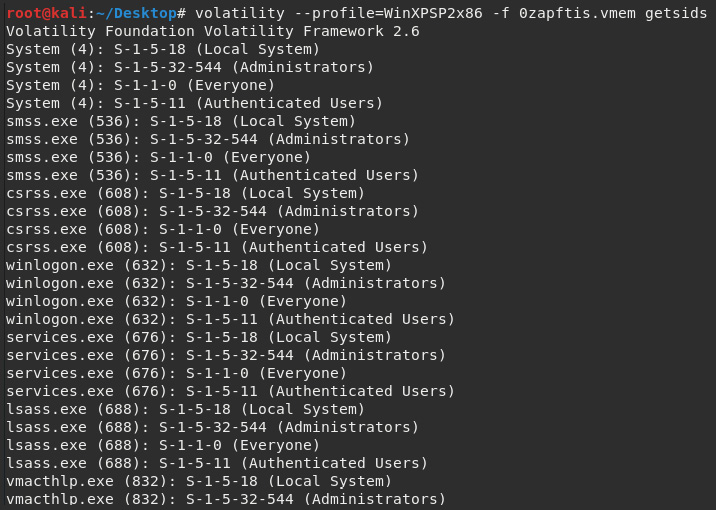
Figure 7.18 – Results of the getsids plugin
So far, we've found some very interesting artifacts, including programs that were running and users who were logged on to the machine. Let's perform registry analysis now.
Registry analysis
Information about every user, setting, program, and the Windows operating system itself can be found within the registry. Even hashed passwords can be found in the registry. In the Windows registry analysis, we will be using the following two plugins:
- hivescan
- hivelist
The hivescan plugin
The hivescan plugin displays the physical locations of available registry hives. The command to run hivescan is as follows:
volatility --profile=WinXPSP2x86 -f 0zapftis.vmem hivescan
The output of the hivescan plugin is as follows:

Figure 7.19 – Results of the hivescan plugin
In the preceding output, the numbers represent the physical location of the hives on the hard disk. More on the registry can be found at https://en.wikipedia.org/wiki/Windows_Registry.
The hivelist plugin
For more detailed (and helpful) information on registry hives and locations within RAM, the hivelist plugin can be used. The hivelist command shows the details of virtual and physical addresses along with the more easily readable plaintext names and locations.
The command used to run hivelist is as follows:
volatility --profile=WinXPSP2x86 -f 0zapftis.vmem hivelist
The output of the hivelist plugin is as follows:
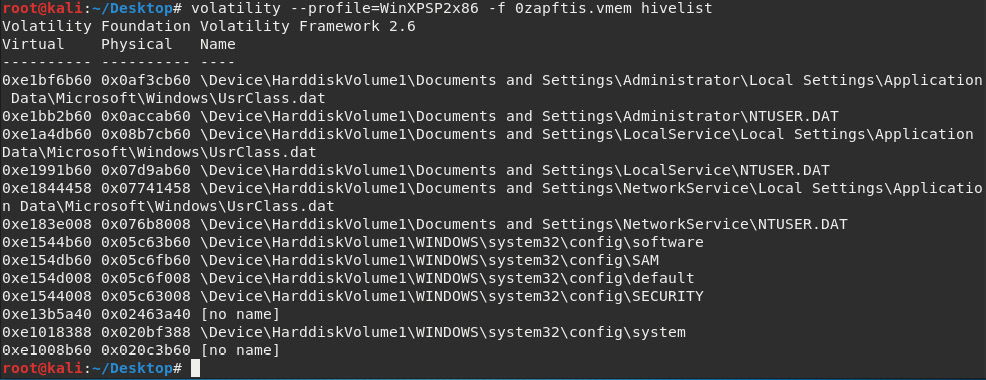
Figure 7.20 – Results of the hivelist plugin
More information on registry hives and their supporting files can be found at https://docs.microsoft.com/en-us/windows/win32/sysinfo/registry-hives.
Password dumping
The location of the Security Accounts Manager (SAM) file is also listed using the hivelist plugin, shown in the following screenshot. The SAM file contains hashed passwords for usernames in Windows machines. The path to the SAM file is seen in the following screenshot as Windowssystem32configSAM:
Figure 7.21 – Snippet to the hivelist plugin displaying the SAM file location
This file cannot be accessed by users within Windows while the system is on. It can be further used to acquire the hashed passwords in the SAM file to crack passwords using a wordlist, along with password-cracking tools such as John the Ripper, also available in Kali Linux.
Timeline of events
Volatility can produce a list of timestamped events, which is essential to any investigation. To produce this list, we will use the timeliner plugin.
The timeliner plugin
The timeliner plugin helps investigators by providing a timeline of all the events that took place when the image was acquired. Although we have an idea of what took place within this scenario, many other dumps may be quite large and far more detailed and complex.
The timeliner plugin groups details by time and includes process, PID, process offset, DDLs used, registry details, and other useful information.
To run the timeliner command, type the following:
volatility --profile=WinXPSP2x86 -f 0zapftis.vmem timeliner
The output of the timeliner plugin is as follows:
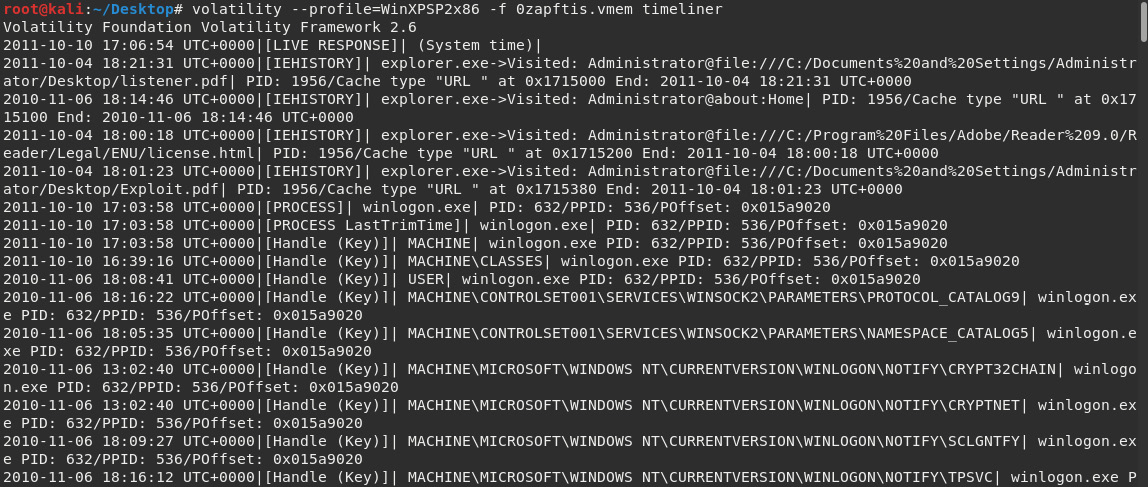
Figure 7.22 – Output of the timeliner plugin
The following is a snippet of the timeliner command when scrolling further through its output:

Figure 7.23 – Output of the timeliner plugin (continued)
The output of the timeliner plugin can be very lengthy, but we can find useful timeline information as it relates to processes, users, programs, and other artifacts if we take the time to sift through the output. Let's now move on to the Volatility Graphical User Interface (GUI): Evolve.
Memory analysis using Evolve (a Volatility GUI)
In this section, we'll be looking at the GUI for Volatility called Evolve.
For this example, I'll install Volatility and Evolve on my desktop. Change to the desktop directory by typing cd Desktop in a new terminal and then download Volatility by typing the following: git clone https://github.com/volatilityfoundation/volatility.git:

Figure 7.24 – Cloning the Evolve GUI tool to the desktop in Kali
Change to the Volatility directory by typing cd volatility and then show the contents of the folder by typing ls:

Figure 7.25 – Changing to the Volatility directory
You should see setup.py in the list. Type python setup.py install:

Figure 7.26 – Installing Python within the Volatility directory
Once completed, we'll also need to install the dependencies required for the tool to work. To install the dependencies, type each line from the following list and press Enter:
- pip install bottle
- pip install yara
- pip install distorm3
- pip install maxminddb

Figure 7.27 – Installing Volatility dependencies
While still in the Volatility directory, we can also now clone and install the Evolve WebGUI. Type the following command:
git clone https://github.com/JamesHabben/evolve.git
The following output displays the Evolve installation cloning process:

Figure 7.28 – Cloning Evolve to the Volatility directory
Type ls to ensure that the Evolve folder is within the volatility folder and then change to the evolve directory by typing in cd evolve. Then, type ls to view the contents within the evolve folder:
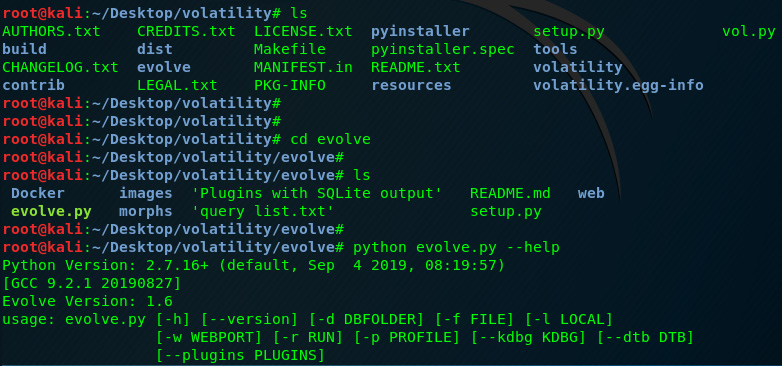
Figure 7.29 – Viewing the content of the Volatility and Evolve directories
To view all the available options for use within the Evolve web interface, type python.py --help while still in the evolve directory:

Figure 7.30 – Using the Volatility help command
You can now copy the cridex.vmem file, or any other memory dump file you'd like to analyze, into the evolve folder. The cridex.vmem file can be downloaded directly at https://github.com/volatilityfoundation/volatility/wiki/Memory-Samples under the name Malware – Cridex.
To open the cridex.vmem file within Evolve, type the following (while still in the Evolve directory): python evolve.py –f cridex.vmem.
Note: The –f option specifies the file we'd like to open and analyze:
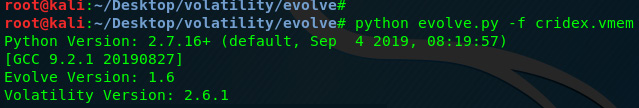
Figure 7.31 – Opening the sample file in Evolve
A web page should now open with the name of the cridex file listed in a tab:

Figure 7.32 – Snippet of the Evolve tab in the Browser
Within the Evolve web interface, the plugins are listed in the left pane, which you can click on to run. In the following screenshot, I've run the pslist plugin, which is exactly the same as we did using Volatility in the terminal earlier in this chapter:

Figure 7.33 – The Evolve Web Interface for Volatility with automated pslist output
Try opening and analyzing some of the other memory samples available for download at https://github.com/volatilityfoundation/volatility/wiki/Memory-Samples. You may also want to have a look at Volatility Workbench v3.0-beta, which runs on Windows machines, for user testing with memory dumps. Volatility Workbench 3.0-beta and sample memory dumps can be downloaded at https://www.osforensics.com/tools/volatility-workbench.html.
Tip
Be sure to download more publicly available memory images and samples to test your skills in this area. Experiment with as many plugins as you can and, of course, be sure to document your findings and consider sharing them online.
Summary
In this chapter, we looked at memory forensics and analysis using some of the many plugins available within the Volatility Framework. One of the first and most important steps in working with Volatility is choosing the profile that Volatility will use throughout the analysis. This profile tells Volatility what type of operating system is being used. Once the profile was chosen, we were able to successfully perform process, network, registry, DLL, and even malware analysis using this versatile tool. As we've seen, Volatility can perform several important functions in digital forensics and should be used together with the other tools we've used previously to perform in-depth and detailed forensic analysis and investigations. We also went a bit further in this edition by installing the web interface for the Volatility Framework for those who may prefer a GUI approach to memory analysis.
In our next chapter, we'll move on to another powerful tool that does everything from acquisition to reporting. Let's get started with Autopsy—the Sleuth Kit®.