
Chapter 8: Artifact Analysis
In this chapter, we'll cover several different tools to uncover various artifacts that may be very useful to our forensic investigations. Most of the tools used in this chapter focus specifically on memory and swap analysis, while Network Mapper (Nmap) and p0f focus more on the network and device.
In this chapter, we'll cover the following topics:
- Identifying and fingerprinting devices, operating systems, and running services with p0f and Nmap
- Analyzing memory dumps to discover traces of ransomware
- Performing swap analysis
- Using swap_digger and mimipenguin for password dumping
- Examining the Firefox browser and Gmail artifacts using pdgmail
Identifying devices and operating systems with p0f
If you're using the VirtualBox version of Kali 2019.3 (kali-linux-2019.3a-vbox-amd64.ova), you may have to install p0f by typing in apt-install get p0f. If you're using the Kali 2019.3 Large.iso image, it should come preinstalled.
You may also use the help option within p0f to verify that it is installed on your system by typing p0f –h. This displays the network interface options, operating mode, output settings, and performance-related options:

Figure 8.1 – p0f help options
Once verified, we can run the p0f command without additional switches or options by typing in p0f, which runs the tool against our machine. In this scenario, my IP address is 172.16.77.159:
- Typing in the p0f command starts the fingerprint process. It may look like the tool has stopped but give it a couple of minutes to perform the scan and display the output:
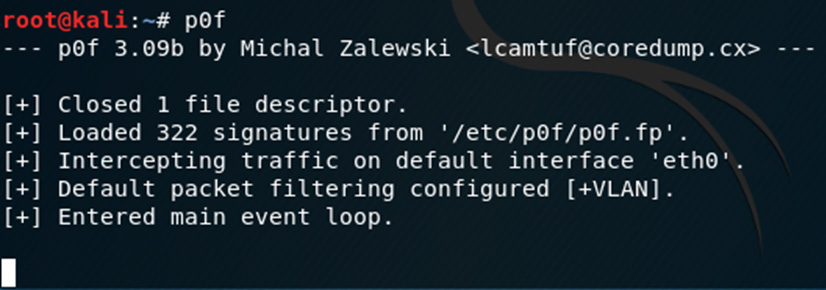
Figure 8.2 – Starting p0f in Kali
- We can also specify the interface on which we'd like to run p0f in the event where we have multiple network interface cards. Let's first view our interfaces by typing ifconfig –a into the Terminal:
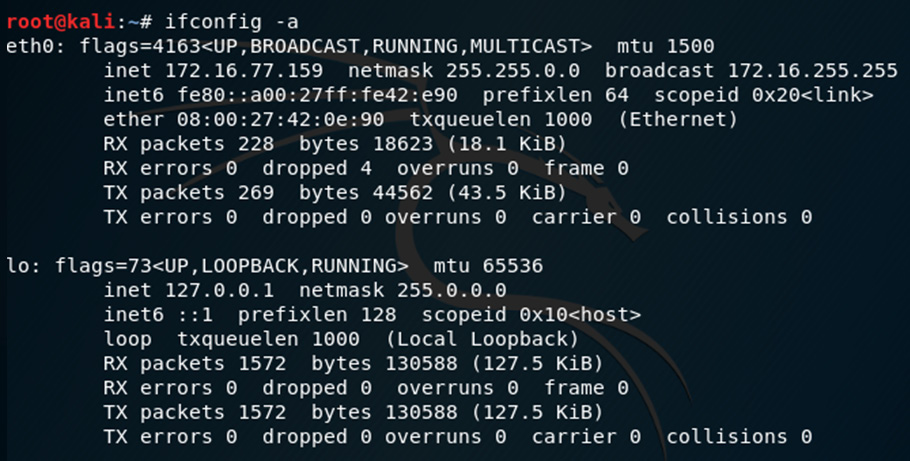
Figure 8.3 – Network adapter settings
The output shows that I have two interfaces, with eth0 being my Ethernet/LAN interface, with an IP of 172.16.77.159 and a loopback address of the default 127.0.0.1. I'll be using the eth0 interface with p0f.
- We can also use the p0f –L command to list all the interfaces:
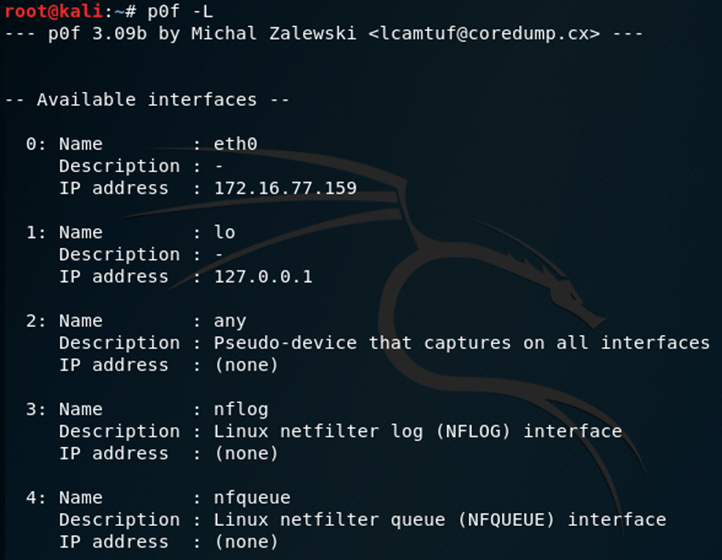
Figure 8.4 – Interfaces detected by p0f
- To specify the interface when using p0f, I'll type p0f –i eth0 into the Terminal:
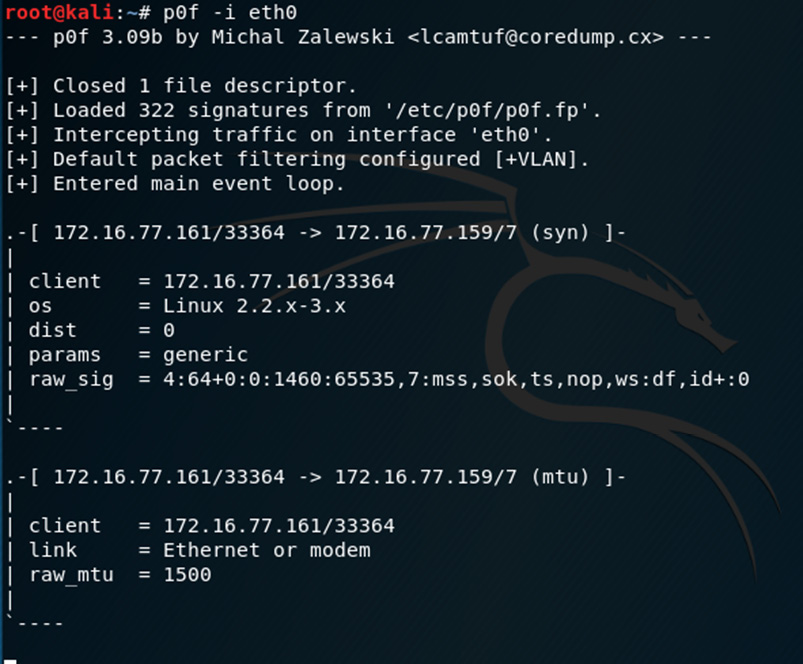
Figure 8.5 – Specifying the Ethernet interface in p0f
- Open the web browser in Kali and you'll see the Terminal being populated with more IP information. By default, the Firefox web browser's home page carries us to the offensive security site and so p0f shows information about the connections and hops (the process of packets passing from one point to another) to the server and information about the server.
- Try browsing to a site. I've opened www.cfsi.co in the browser. p0f updates the information in the Terminal in real time and the first entry displayed shows an SYN request from 172.16.77.159 (my Kali machine) to 185.230.60.211 via port 80. We can also see information about my Kali machine, such as the OS (Linux 2.2-3.x), as fingerprinted by p0f:
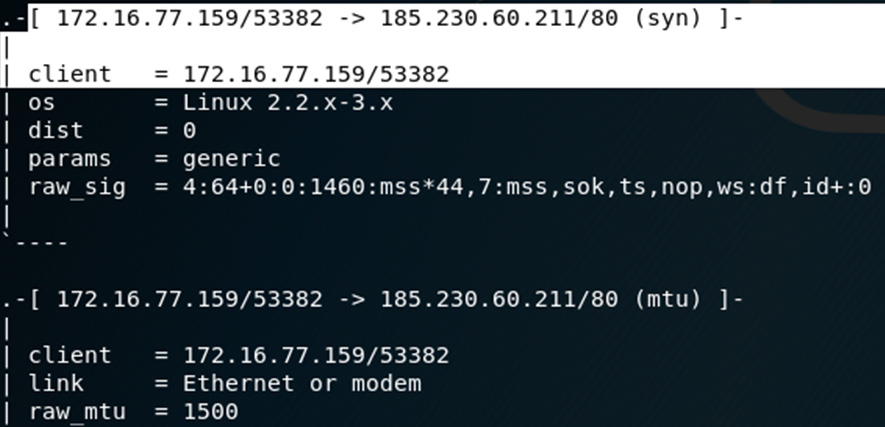
Figure 8.6 – IP and OS information displayed on the p0f output
- Let's get more information about the IP address 185.230.60.211. In the Terminal window, click on File | New Tab. In the new tab, type whois 185.230.60.211.
The output of the whois command can be seen in the following screenshot:
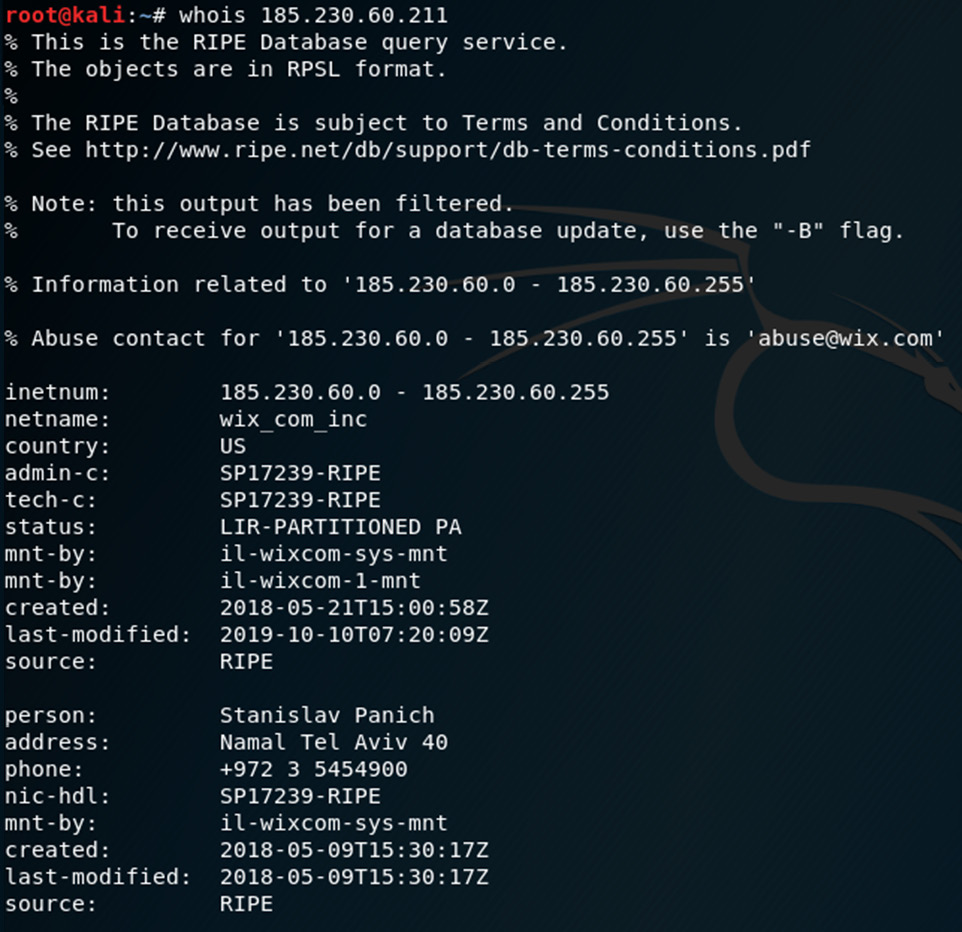
Figure 8.7 – The whois command
In this whois output, we can see that the IP points to wix.com, which is the host for the www.cfsi.co website.
Scrolling through the p0f output, we can see several other pieces of information, including the uptime of the server and other IP addresses and hops along the way:

Figure 8.8 – p0f output displaying server uptime details
Now that we've found some very useful information on our target network IPs, let's have a look at another tool, Nmap, which can also be used to fingerprint and discover devices, services, and more.
Information gathering and fingerprinting with Nmap
Let's now use the Nmap tool to gather information about resources and devices on the network and discover any open, filtered (monitored or firewalled), or closed ports and also fingerprint their operating systems:
- To view the usage options for Nmap, type in nmap -h:
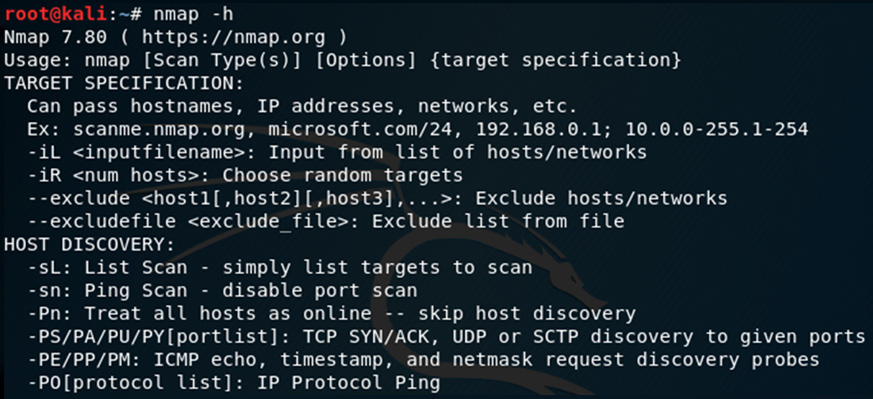
Figure 8.9 – Nmap help options
- I'll scan the devices on my network by typing the following command into a new Terminal:
nmap –v –O –sV 172.16.0.0/24 –Pn
The following list details the options used in the previous command:
- -v : Verbose output
- -O : Enable operating system detection
- -sV : Probe open ports to determine service and version information
- -Pn : Treat all hosts as online (skip discovery)
The following screenshot shows some of the output of the Nmap version scan:
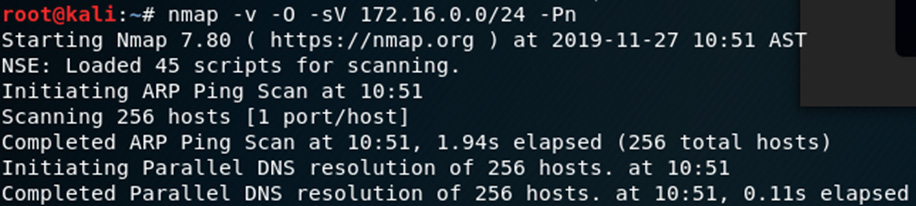
Figure 8.10 – Nmap service scan output
This scan can take some time to run due to the service version scanning in particular. Here's the output of one host (172.16.0.1):

Figure 8.11 – Nmap scan output
In this Nmap result, we can see that six ports are open and running various services, such as SSH 1.25, SIP Proxy, and SSL, inclusive of service version information as specified when using the –sV option. We can also see that Nmap has fingerprinted the OS to be a Cisco router.
We've discovered some very interesting information using Nmap and p0f. Let's move on to our next topic, which covers Linux forensics.
Live Linux forensics with Linux Explorer
When performing live forensics on Linux machines, Linux Explorer can be used to gather information and artifacts.
Linux Explorer can be used to find the following artifacts:
- Processes and process IDs
- Usernames and logins
- Ports and service information
- Suspicious files
- Rootkit detection
Ransomware analysis
The WannaCry cryptoworm became well-known around May 2017, when several large organizations started reporting ransomware infections that spread via EternalBlue exploits on vulnerable Windows systems. A splash screen appeared on users' machines, which then instructed users to pay $300.00 in Bitcoin to have their infected/encrypted file decrypted.
More on the WannaCry ransomware can be found at https://en.wikipedia.org/wiki/WannaCry_ransomware_attack.
Further reading on the WannaCry ransomware can be found by visiting the following links:
- Automated Behavioral Analysis of Malware. A Case Study of WannaCry Ransomware (Chen and Bridges): https://www.osti.gov/servlets/purl/1423027
- A Study of WannaCry Ransomware Attack (Dr. Supreet Kaur Sahi): https://www.technoarete.org/common_abstract/pdf/IJERCSE/v4/i9/Ext_89621.pdf
- WannaCry Ransomware: Analysis of Infection, Persistence, Recovery, Prevention and Propagation Mechanisms (Akbanov, Vassilakis, Logothetis): https://www.il-pib.pl/czasopisma/JTIT/2019/1/113.pdf
For this lab, we'll be using Volatility to analyze the ransomware and attempt to trace and view the originating sources of infection by analyzing a memory dump taken from an infected machine.
Important note
We will not be downloading the actual ransomware but merely a memory dump file of an infected machine.
For additional safety, you may switch your network adapter settings to NAT (if on bridged mode) in VirtualBox or your platform of choice, before downloading the file and then disable your network adapter after downloading the file to ensure that you are working in an isolated VM.
Downloading and extracting a sample ransomware file
The memory dump of the machine infected with the WannaCry ransomware can be downloaded from here: https://mega.nz/#!Au5xlCAS!KX5ZJKYzQgDHSa72lPFwqKL6CsZS7oQGbyyQrMTH9XY.
Thanks to Donny at https://www.null0x4d5a.com/ for providing the mega link and password to the file in his blog.
I've saved the downloaded file to my Downloads folder. In the Terminal, I'll switch to the Downloads folder and view the contents by typing in cd Downloads and then issuing the ls command. There I can see the wannacry.7z file, as in the following screenshot:
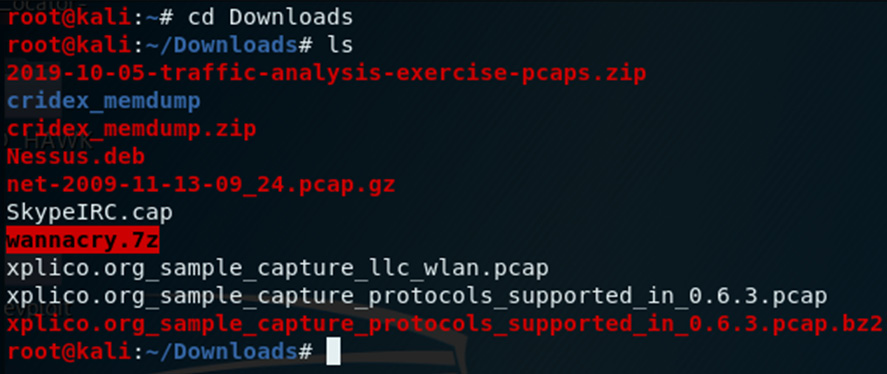
Figure 8.12 – Viewing the downloaded sample file using the ls command
For integrity purposes, I've run the sha1sum and sha256sum tools against the downloaded file. To extract the file, I've opened my Downloads folder, double-clicked on the file, right-clicked on wcry.raw, and then clicked on the Extract option. The password for the file is the word infected, as in the following screenshot:
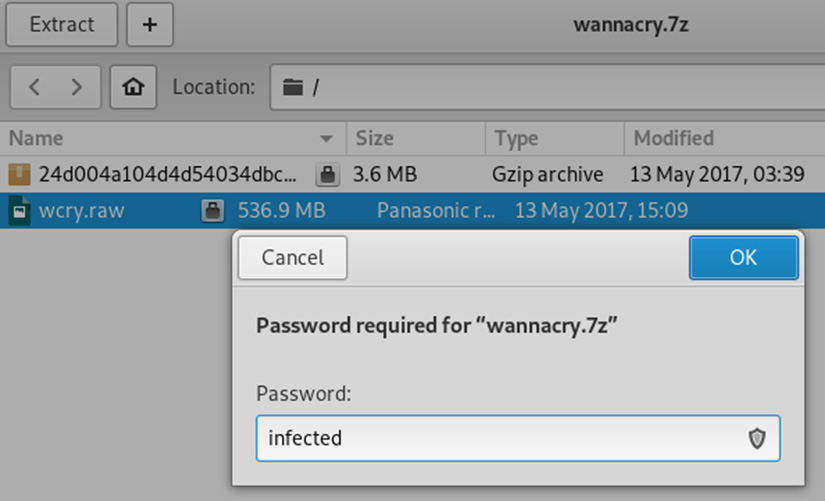
Figure 8.13 – Screenshot of the password to extract the sample file
Click on OK to start the extraction and then click on Show the Files when completed:

Figure 8.14 – Extraction completion options
The extracted memory dump file is named wcry.raw and shows a file size of 536.9 MB:
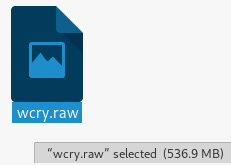
Figure 8.15 – Extracted wcry.raw file
Once the file has been downloaded and extracted, let's begin analyzing the ransomware.
WannaCry analysis using Volatility
Open a new Terminal and navigate to the Downloads folder. Let's start by running the image info plugin to determine the profile to use, just as we did in the earlier Volatility exercise in the previous chapter:
- In the Terminal, type volatility -f wcry.raw imageinfo:
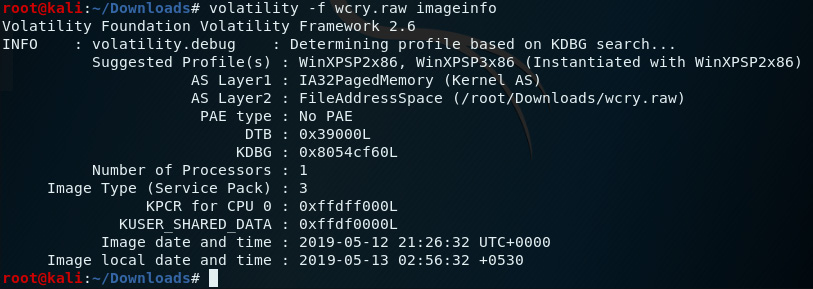
Figure 8.16 – Output of the imageinfo plugin in Volatility
The suggested profiles for our wcry.raw image are WinXPSP2x86 and WinXPSP3x86, but we'll use WinXPSP2x86 from here on.
- Let's first analyze the wcry.raw file by looking at the running processes at the time the dump was acquired.
We'll start with the pslist plugin. Type the following command into the Terminal:
volatility –profile=WinXPSP2x86 -f wcry.raw pslist
The following screenshot displays the output of the pslist command:
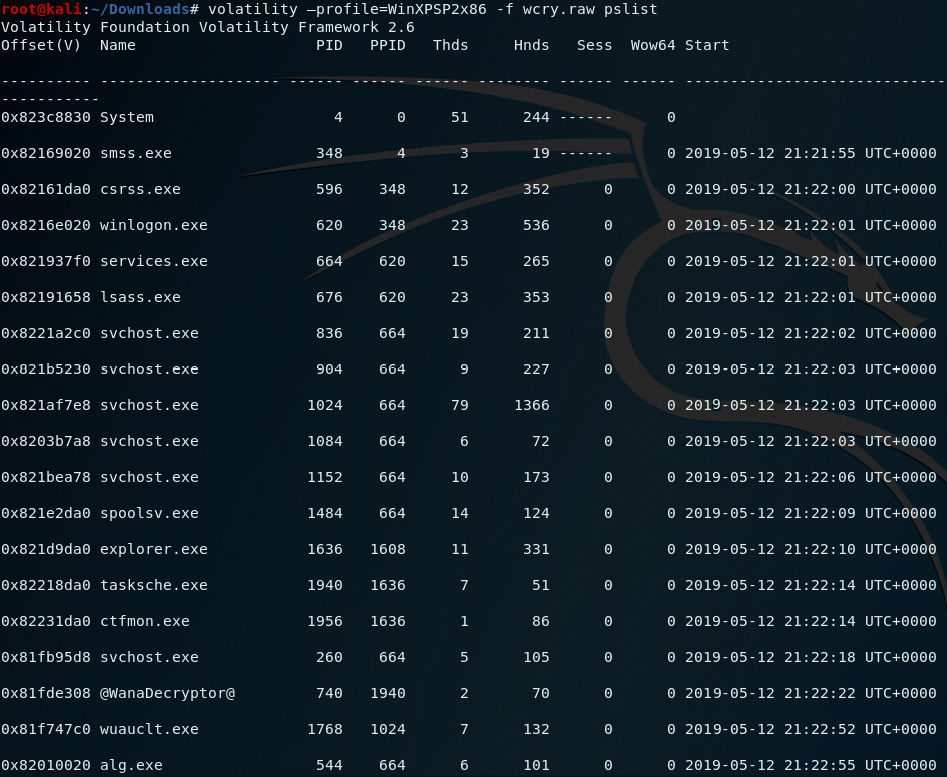
Figure 8.17 – Output of the pslist plugin in Volatility
In the preceding screenshot, we can see that there is an entry (third from last) for a process named @WanaDecryptor@ with a PID of 740 and a PPID of 1940. This is a good indicator that an instance of the WannaCry ramsomware may exist within an infected process or file.
- Let's take a more detailed look by using the pstree plugin, which produces the same output but in a format that's easier to follow when identifying the parent processes. Type the following command into the Terminal:
volatility –profile=WinXPSP2x86 -f wcry.raw pstree
The following screenshot displays the output of the pstree command:
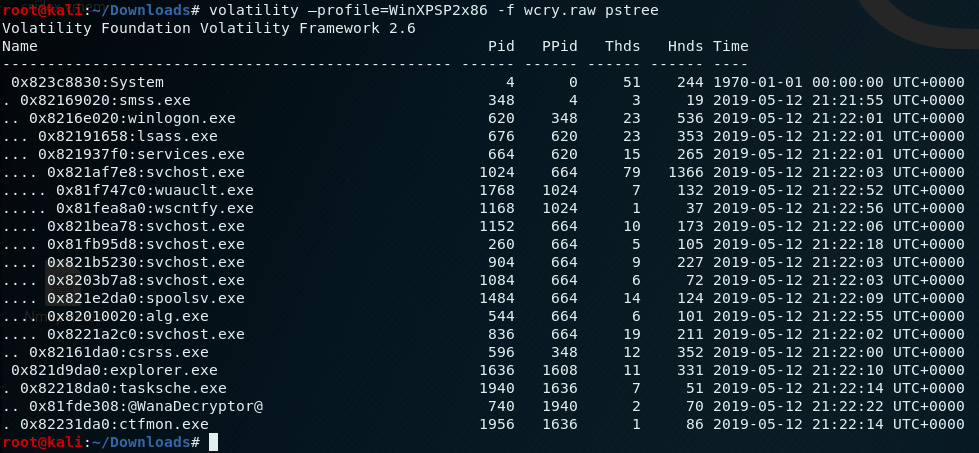
Figure 8.18 – Output of the pstree plugin in Volatility
Using the pslist, psscan, and pstree plugins, we saw the @WanaDecryptor@ process (with a PID of 740 and a PPID of 1940) spawned by the Windows task scheduler (tasksch.exe, PID: 1940) under Windows Explorer (explorer.exe).
- We can also view this information by issuing the psscan plugin by typing the following command into the Terminal:
volatility –profile=WinXPSP2x86 -f wcry.raw psscan
The following screenshot displays the output of the psscan command:
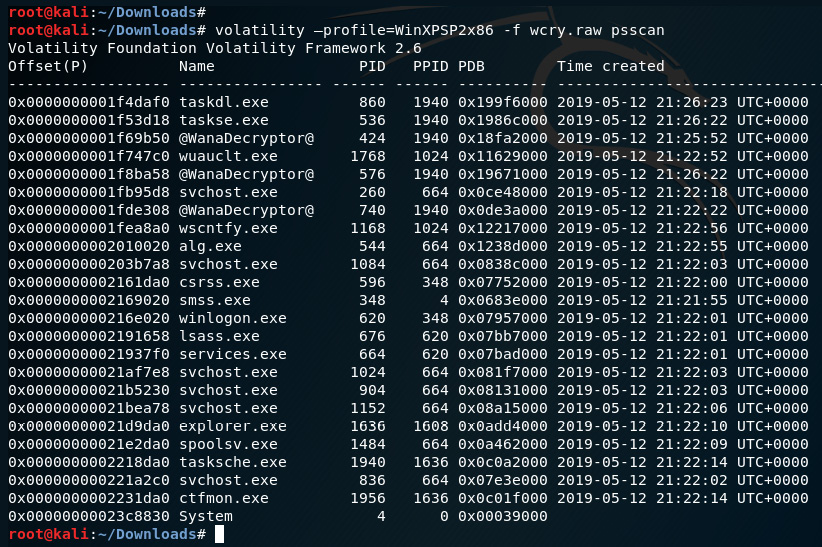
Figure 8.19 – Output of the psscan plugin in Volatility
In this output, we can see four instances of processes that have a PPID of 1940:
Taskdl.exe: PID of 860
Taskse.exe: PID of 536
@WanaDecryptor@: PID of 424
@WanaDecryptor@: PID of 576
- Let's narrow down the output by adding | grep 1940 to pslist and psscans, which will search for any processes associated with the 1940 process.
Let's first run pslist again with the grep option by running the following command:
volatility –profile=WinXPSP2x86 -f wcry.raw pslist | grep 1940
The following screenshot displays the output of the pslist command:
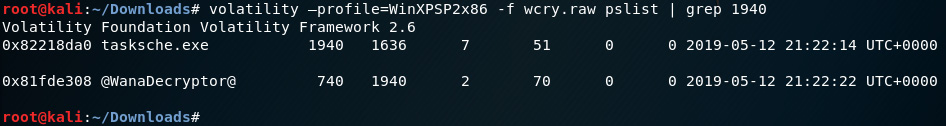
Figure 8.20 – Output of the pslist plugin using the grep option in Volatility
Let's also run the psscan plugin with the grep option to view the processes by running the following command:
volatility –profile=WinXPSP2x86 -f wcry.raw psscan | grep 1940
The following screenshot displays the output of the psscan command:
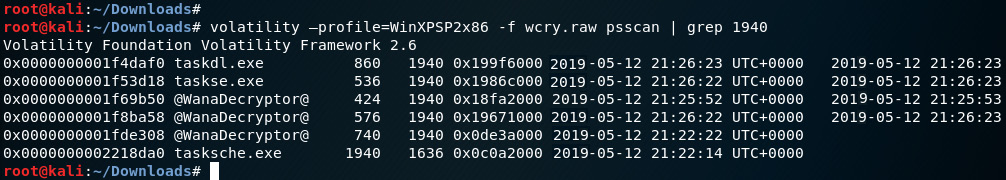
Figure 8.21 – Output of the psscan plugin using the grep option in Volatility
- To obtain more information on the processes, we can run the dlllist plugin and also specify the process ID to determine the DLL libraries used. You may want to run this command in a new tab in the Terminal as the output is quite lengthy. In the output for this command, we'll be looking for processes with the PIDs listed in the previous screenshots (860, 536, 424, 576, 740, 1940).
Run the dlllist plugin by typing the following into the new tab Terminal:
volatility –profile=WinXPSP2x86 -f wcry.raw dlllist –p 1940
The following screenshot displays the output of the dllist command. The dlllist plugin, when specified with the –p 1940 process number, displays the directories and libraries used by the process:
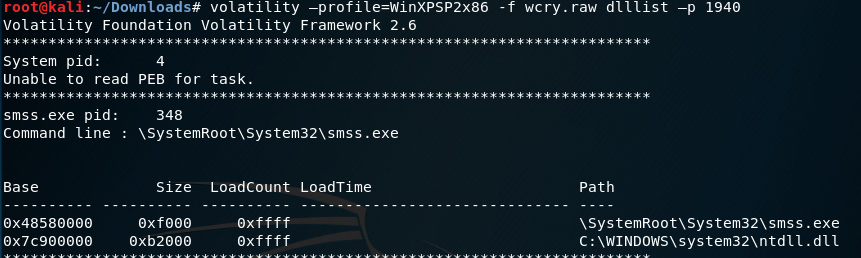
Figure 8.22 – Output of the dlllist plugin
Scrolling down through the output, we can see the output for tasksche.exe, with a PID of 1940 and all the associated DLLs:
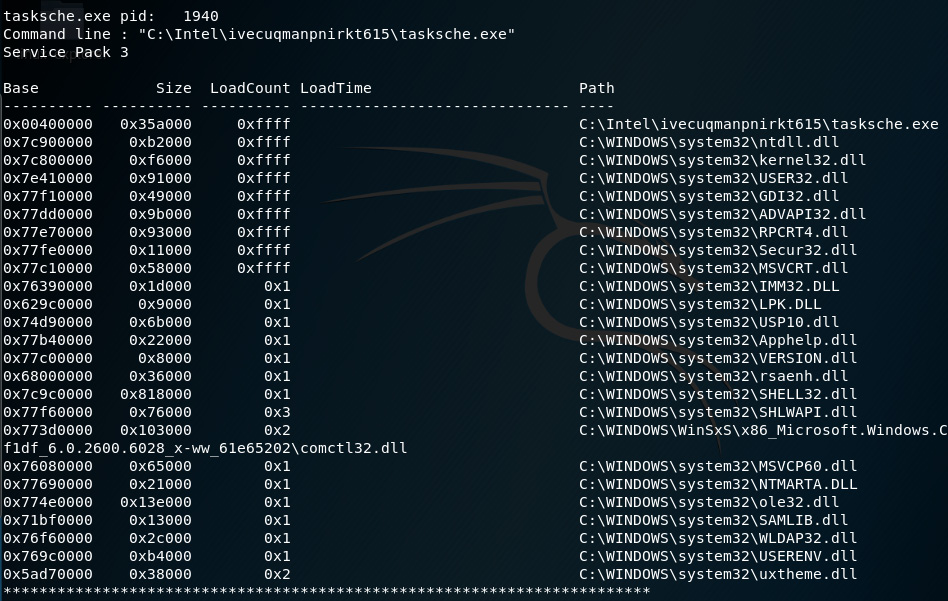
Figure 8.23 – Snippet of the dlllist plugin displaying PID 1940 details
A closeup of the output shows us the command line entry for tasksche.exe as C:Intelivecuqmanpnirkt615 asksche.exe:
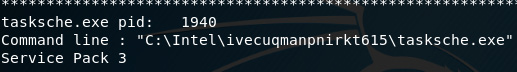
Figure 8.24 – Snippet of tasksche.exe
The path, specifically the ivecuqmanpnirkt615 folder, is a bit suspicious here but let's have a look at some more dlllist outputs before we go further. Here's the output for @WanaDecryptor@, with a PID of 740:
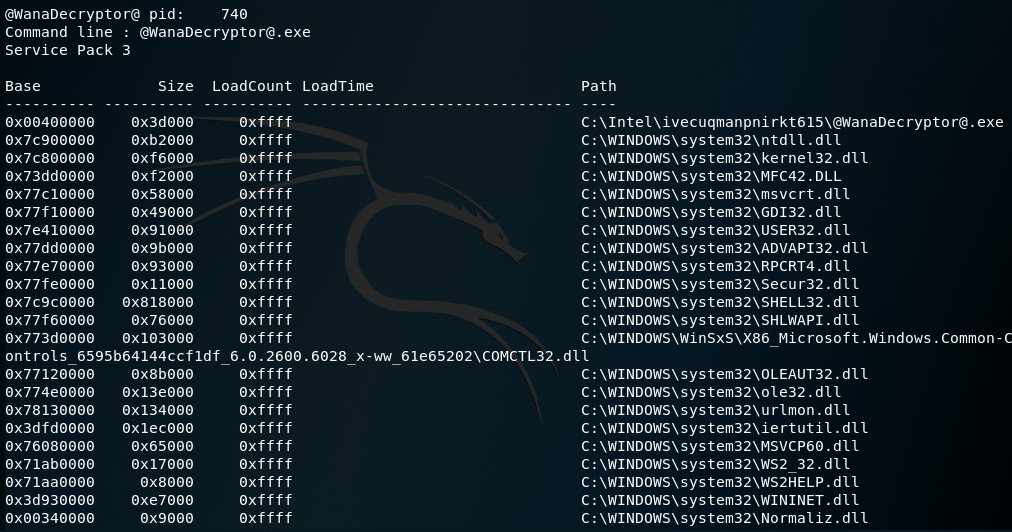
Figure 8.25 – Snippet of PID 740 details in the dlllist output
A closer look at the output shows that the path for @[email protected] is also the same as tasksche.exe, listed as C:Intelivecuqmanpnirkt615@[email protected].
The path for @[email protected] can be seen in the following screenshot:

Figure 8.26 – Snippet of PID 740 details
- We can now assume that based on the output so far, the processes responsible for the execution of the ransomware have originated from the path C:Intelivecuqmanpnirkt615@[email protected].
To confirm this, we can use the dlllist plugin with | grep ivecuqmanpnirkt615 to search for the folder path and the associated .exe files:
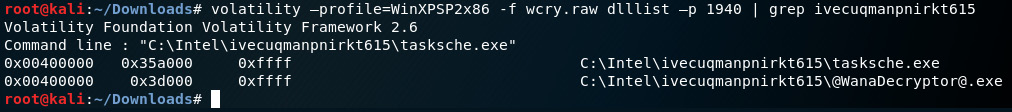
Figure 8.27 – Snippet of associated exe's
- Let's now use the handles plugin, which is used to display the handles for a process to view the access and type. For this ransomware, we'll be looking for a mutex, which prevents the malware from running in multiple instances by specifying the mutant type option.
Type in the following command to run this plugin:
volatility –profile=WinXPSP2x86 -f wcry.raw handles -p 1940 -t mutant
The following screenshot displays the output of the handles plugin used with the mutant option:
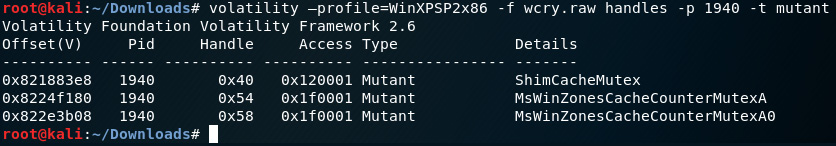
Figure 8.28 – Output of the handles plugin
- Let's do a quick search for the items listed in the details section at www.virustotal.com. As you can see in the following screenshot, VirusTotal detection reveals that antivirus programs detect MsWinZonesCacheCounterMutexA as the WannaCryptor ransomware:
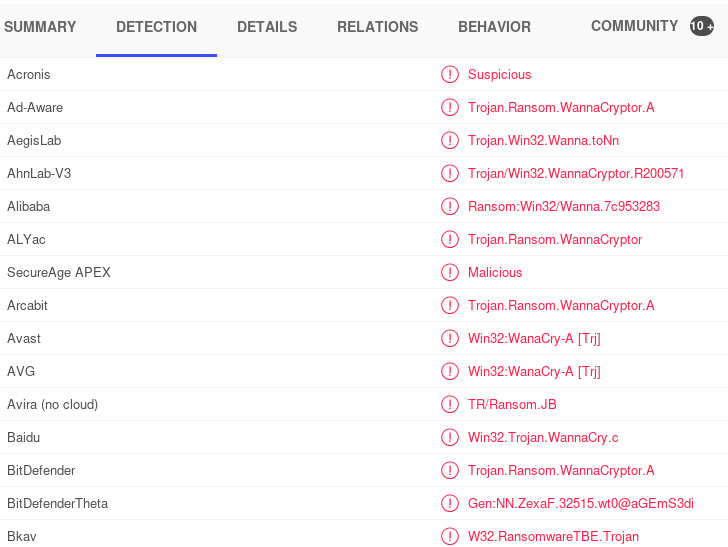
Figure 8.29 – Snippet of the file results from VirusTotal.com
- Clicking on the DETAILS section in the VirusTotal results page, we can see that there are many names for the WannaCryptor ransomware, including tasksche.exe:

Figure 8.30 – Snippet of the Wanna Decryptor alias results from VirusTotal.com
This was a lengthy exercise but I hope you've enjoyed finding artifacts, including the processes, IDs, and paths that have all helped us to identify the ransomware, along with verification from VirusTotal. We'll now move on to Linux swap file analysis using swap_digger.
swap_digger
swap_digger performs an automated analysis of the Linux swap file and can retrieve artifacts such as system passwords, usernames, form credentials, and even Wi-Fi information, such as the SSID and perhaps even passwords if they are stored in the swap file.
Installing and using swap_digger
Let's now clone and install swap_digger in Kali Linux:
- Change directories to the desktop in the Terminal and clone swap_digger to the desktop by typing in: git clone https://github.com/sevagas/swap_digger.git.
The preceding gitclone command clones and installs swap_digger:
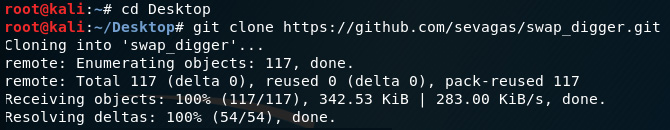
Figure 8.31 – Installing swap_digger in Kali Linux
- Change to the swap_digger directory by typing in cd swap_digger. Type in the following two commands to start swap_digger:
chmod +x swap_digger.sh
sudo ./swap_digger.sh –vx
swap_digger will run after typing in the preceding commands, as in the following output:
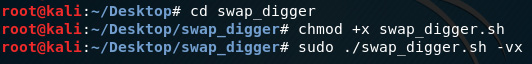
Figure 8.32 – Configuring permissions of swap_digger
- swap_digger runs and starts by looking for the swap partition (located at /dev/sda5 on my machine) and begins dumping the swap strings. It also digs for user credentials in the etc/shadow file and prompts you to perform a dictionary attack against the file. Press Y and Enter to confirm and continue digging for the hash:
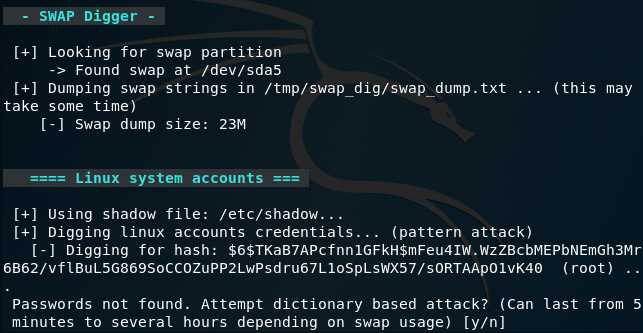
Figure 8.33 – Swap_digger CLI interface
As mentioned in the last line of the preceding screenshot, the dictionary attack can take anywhere from five minutes to several hours:

Figure 8.34 – Swap_digger password cracking process
This may take a while but it will at least show your default password once complete.
If left to run, swap_digger will also search for web and email passwords, XML data, and Wi-Fi passwords. I haven't entered any of those on my Kali machine but here's a screenshot of the process:

Figure 8.35 – Swap_digger scanning process
As the preceding screenshot shows, swap_digger is a very useful tool for live analysis on Linux machines, which can be used to discover artifacts running in the swap file, including passwords. Let's now move on to another password-dumping file in the next section.
Password dumping with mimipenguin
Mimipenguin is based on the very popular password-cracking tool mimikatz. Much like swap_digger, mimipenguin can also retrieve artifacts running in memory by dumping memory processes that may contain unencrypted passwords in plaintext:
- Let's start by changing to the Desktop folder and then cloning mimipenguin to desktop by typing git clone into a new Terminal:
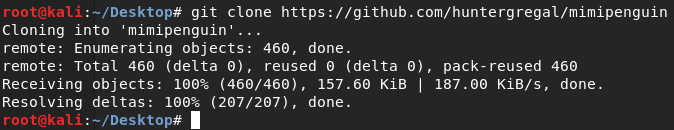
Figure 8.36 – Cloning mimipenguin onto the Kali Desktop
- Change to the mimipenguin directory by typing in cd mimipenguin, then show the files within by typing in ls:
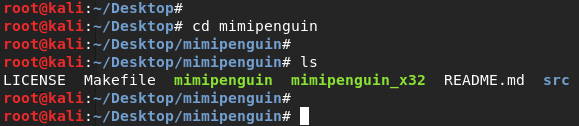
Figure 8.37 – Viewing the contents of the mimipenguin folder
- Run mimipenguin by typing in ./mimipenguin:
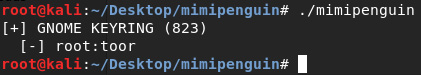
Figure 8.38 – Password discovery using mimipenguin in Kali Linux
In the previous screenshot, we can see that the username and password for the Kali machine was discovered (root : toor).
Examining Firefox artifacts with pdgmail
In this section, we'll use pdgmail, which also performs memory analysis but specifically looks for web artifacts, such as emails, contacts, IP addresses, and even inbox or sent items, by analyzing the memory dump process.
For this lab, I'll be using the Kali Linux Large ISO, which I have installed as a virtual machine in VirtualBox:
- Let's first view some available options in pdgmail by opening a new Terminal and typing in pdgmail –h:

Figure 8.39 – Viewing the help options of pdgmail
I've also opened a Firefox browser and logged into a Gmail account, then clicked on my inbox and sent items box so that this process can be run in memory. I've also visited some other sites, such as www.20minutemail.com, where I signed up for a temporary email address, and www.netcraft.com, where I looked up certifiedhacker.com.
- To find the Firefox process ID (just as we saw in Chapter 7, Memory Forensics with Volatility, using the pslist module) we can run the following command:
ps –ef | grep fire
The following screenshot displays the output of the previous command:
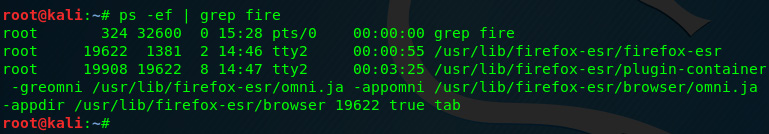
Figure 8.40 – Finding Firefox processes
- In the previous screenshot, we can see that the second entry with a 19622 process is the process ID for Firefox (note that your process ID may be a different number). Let's dump this process to be analyzed by running the following command:
gcore –o firegmail.dmp 19622
The following screenshot displays the output of the previous command:

Figure 8.41 – Firefox process dump output
Once the process dump is completed, the last line should read as Saved corefile firegmail 19622.
We can see the last line of the output of the gcore command in the following screenshot:
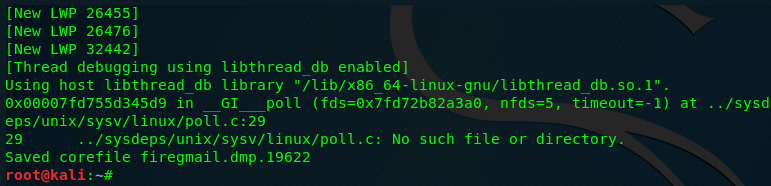
Figure 8.42 – Output of the gcore option
- To analyze the saved process dump, run the following command:
strings –el firegmail.dmp.19622
The command is shown in the following image:
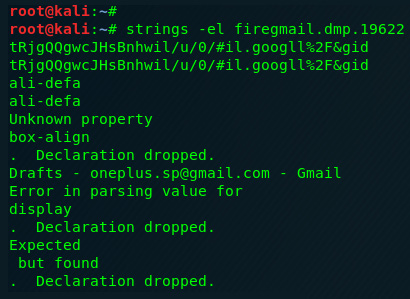
Figure 8.43 – Process dump analysis
Scrolling through the output, you will be able to see the email you logged into, along with the number of unread emails in the inbox:
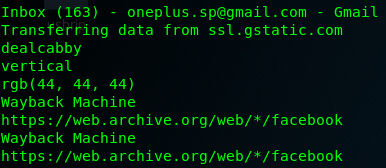
Figure 8.44 – Gmail inbox details
- To verify, I'll click on the Gmail tab in Firefox and click on an email in my inbox. I can now see that there's 162 unread emails in the inbox, which means the pgdmail output was accurate. (There were 163 unread emails in the inbox but I clicked on an email from www.academia.edu to be able to continue with the following example):
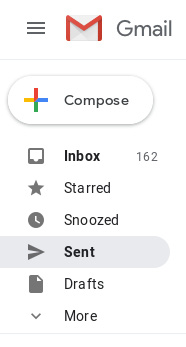
Figure 8.45 – Snippet of the Gmail mailbox
I can also see a link from one of the emails I just clicked on from www.academia.eu:
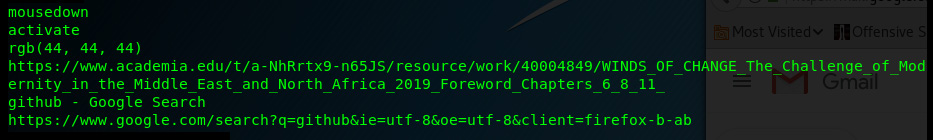
Figure 8.46 – Snippet of the pdgmail analysis
Here's a screen shot of the actual email subject in Gmail:

Figure 8.47 – Screenshot of the Gmail inbox
I can also see that the mail compartments/categories were also found:
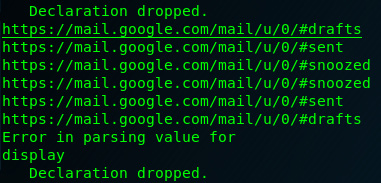
Figure 8.48 – Snippet of the pdgmail analysis output
Pdgmail has also found artifacts relating to www.20minutemail.com where I signed up for a temporary email account earlier:
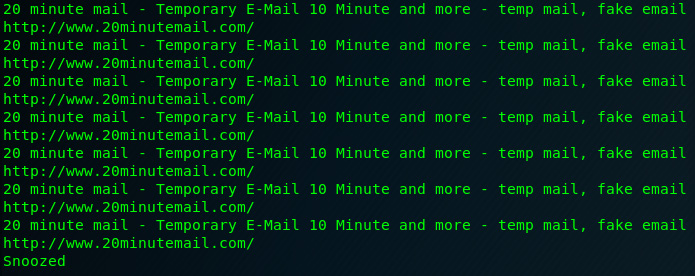
Figure 8.49 – Pdgmail artifact analysis output
It also showed the search entry on www.netcraft.com, where I previously did a DNS search for the www.certifiedhacker.com:
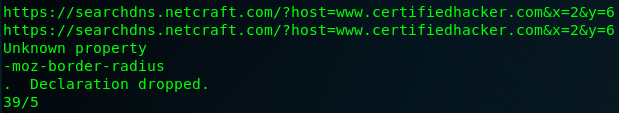
Figure 8.50 – DNS search details revealed in the analysis output
This concludes our usage of pdgmail, which we used to explore Gmail artifacts on a live Linux system, which would be stored within the browser cash within memory. Although the examples and screenshots were based on a sample email that I used, feel free to try this using your own email within Kali Linux.
Summary
This was quite an exciting chapter. We discovered communications services, devices, ports, and protocols using Nmap and p0f and then jumped into ransomware analysis using Volatility to discover the origin of the WannaCry cryptoworm on an infected system's memory dump. Finally, we did an analysis of the swap file using swap_digger, mimipenguin, and pdgmail.
In the next chapter, we'll use Autopsy and The Sleuth Kit to analyze an imaged drive and also compare Autopsy for Linux and Windows.