Appendix B. Survey of Commercial Defense Approaches
As mentioned in Chapter 3, shortly before the turn of the millennium, DoS attacks became more frequent and their effect more devastating. Numerous companies sprang to the challenge of designing effective and practical DDoS defenses. On the one hand, they had a hard task of designing an effective victim-end defense that can successfully handle high-volume attacks and guarantee low collateral damage. The victim-end deployment was dictated by an economic model—customers needed a solution they could deploy themselves and gain immunity against the attacks. Infrastructure (corebased) and source-end solutions were unlikely to sell. On the other hand, commercial solutions did not need to meet the challenge of “completely handling the problem,” as research approaches do. It was sufficient to build a product that works today for existing attacks, then upgrade it should new threat models occur. This resulted in several highly practical solutions that appear to have good performance and do not incur high processing or storage cost.
To their credit, all commercial solutions deviated from the signature-based detection and filtering model established by intrusion detection systems. Rather, they attempted to devise versatile anomaly-based models, selecting multiple traffic and host behavior features and training their systems to recognize ranges of these features that are seen during normal operation. Detection of features that fall outside a baseline range signals an attack. This approach shows promise to handle diverse DoS attacks and other network threats such as worms, viruses, insider threats, and peer-to-peer file sharing. Unlike research approaches that focused mainly on dropping the attack traffic even when this inflicts collateral damage, commercial solutions recognized the need to identify and protect legitimate users’ traffic while controlling the attack. A lot of effort is thus invested in sophisticated algorithms for traffic profiling and separation at the victim-end.
A common downside of commercial products appears to be the inability to spot and handle sophisticated attacks. For instance, those attacks whose features blend into feature ranges incorporated in baseline models will go undetected. So will attacks that attempt to retrain baseline models to suit their needs, by introducing anomalous traffic slowly over time. Randomized attacks are also likely to defeat the characterization process in commercial products. Finally, some levels of false positives are likely to occur when traffic and host patterns change for legitimate reasons, e.g., due to a flash crowd.
A prevalent trend among commercial DDoS defenses is to offer a myriad of utilities for monitoring network usage and easy management and restructuring of the network, in addition to protection functionality. This increases the value and appeal of the product. Since DDoS is an infrequent (although devastating) event from the point of view of a single network, investment in a product purely focusing on DDoS defense may take a long time to pay off. On the other hand, defense products regularly monitor network traffic looking for anomalies as a sign of the attack. Collected information, presented through a user-friendly interface, is valuable for network monitoring and management, thus making the defense product useful on a daily basis.
This appendix surveys a subset of currently available commercial DDoS solutions, and its goal is to provide the reader with a solid understanding of a variety of protection, detection, and response techniques deployed in those products. The authors in no way wish to promote or endorse the solutions discussed in this appendix.
Further, the authors did not themselves test any of the mentioned products for several reasons: (1) since there is currently no agreement in the security community on benchmark suite or testing methodology for DDoS defense product evaluation, test results would have doubtful merit; (2) obtaining sample products from vendors and subjecting them to tests requires the vendors’ consent, which is sometimes hard to get (see [And02]); and (3) testing takes a lot of time, effort, and skilled staff to be done properly. The authors can thus make no informed opinion on how the discussed products perform in practice, or which ones are better than others. The information presented in this appendix is based solely on vendors’ claims. It is gathered from product white papers (on Web pages, for example) and through personal communication with product developers, heavily distilled and summarized to provide design facts and omit performance claims. Its only purpose is to show you what is out there in the commercial world.
The list of solutions presented in this book is by no means exhaustive. In an everchanging market, it would be impossible to account for all commercial products that provide effective DDoS defense. In our opinion, the products discussed herein form a representative set of commercial solutions available today. You should investigate the market yourself before buying any DDoS defense product and assure yourself that the product provides the desired security guarantees to your network.
The material in this appendix is likely to soon become obsolete as new products appear and old ones are withdrawn from sales.
B.1 Mazu Enforcer by Mazu Networks
Mazu Enforcer combines anomaly and signature DDoS detection and deploys filtering to respond to attacks. Anomaly detection is performed by building behavioral models of legitimate traffic. The user specifies triggers—traffic characteristics whose behavior should be monitored and incorporated in the model. There are two types of triggers. Bandwidth triggers describe the amount of inbound and outbound traffic of various types. Total inbound packet or byte rate, outbound TCP packet rate, or inbound ICMP packet rate are all examples of bandwidth triggers. Suspicious traffic triggers describe specific traffic whose excess may overwhelm network resources. Fragmented packets, TCP SYN packets, and the ratio of inbound to outbound TCP packets represent examples of suspicious traffic triggers. Once the triggers have been defined, Enforcer monitors the values of these parameters over time, recording their distributions within the baseline model of the network traffic. Another utility, Threshold Advisor, examines the recorded trigger distributions and guides the definition of thresholds that will be used for anomaly detection. The Threshold Advisor displays the average, maximum, and user-selected percentile value for each trigger, and makes a recommendation for threshold value. Figure B.1 depicts the sample trigger types along with their threshold values. In addition to trigger distributions and thresholds, the baseline model contains the distributions of packet attributes: payload hash and packet header fields, such as source and destination addresses, source and destination ports, TTL, and protocol.
During normal operation, the Enforcer records trigger values and compares them with the defined thresholds to detect anomalies. Once an anomaly is detected, Enforcer alerts the operator of the attack and starts the characterization process, devising appropriate traffic filters. The goal of this process is to accurately describe and surgically separate the attack from the legitimate traffic. The Enforcer first observes each packet attribute (payload hash and header fields), and attempts to identify parameter values that describe the highest volume of the inbound traffic. For instance, assume that 80% of all incoming packets have a TTL value of 23 or 25, and the other 20% have uniformly distributed values from 10 to 250. The characterization process would then identify values 23 and 25 for the TTL parameter. The next step is to compare the distribution of the identified values with the historical distribution for a given packet attribute stored in the baseline model. Assume that a baseline model indicates that, historically, the majority of packets have uniformly distributed TTL values between 10 and 250. The identified distribution of values clustered at 23 and 25 then significantly differs from the historical distribution, which in this example makes a TTL value a suitable parameter for differentiating between the legitimate and the attack packets. If, on the other hand, the distribution of the identified values were similar to that indicated by a historical model (i.e., if packets usually had their TTL values clustered around 23 and 25), the TTL parameter could not be used to perform traffic separation.
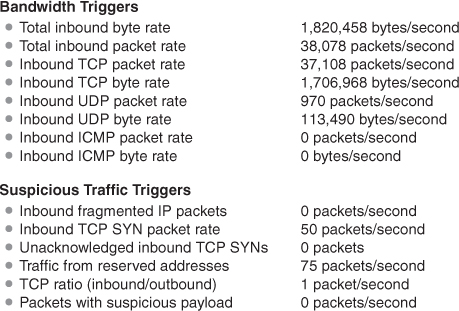
Figure B.1. Illustration of the Mazu Enforcer trigger types along with the corresponding threshold values. (Reprinted from Mazu Enforcer white paper with permission of Mazu Networks.)
Once the separation parameters (and their values) are identified, Enforcer recommends the appropriate filters. Five types of filters are supported:
1. Cisco router ACL filters. These are standard Cisco router filters that describe traffic using source and destination addresses, port numbers, and the protocol field. ACL filters, if accepted by the operator, are not deployed by Enforcer, but rather are installed in the downstream router.
2. High-performance Mazu filters. In addition to the descriptive ability of ACL filters, Mazu filters can describe packets using TTL values, packet length, and the payload hash. Since more descriptive power equals better traffic separation, Mazu filters are likely to inflict lower collateral damage than the ACL filters.
3. Mazu expression filters. Operators have the ability to specify their own filters describing a combination of any packet attribute and value ranges, using Boolean expression constructs.
4. TCP SYN flood filters. Enforcer offers protection against TCP SYN flood attacks, with filters that can be engaged preemptively. TCP SYN flood filters track stale half-open TCP connections and generate resets to free server resources.
5. Payload filters. Fragments of packets seen in known incidents, such as Nimda and Code Red spread, are used to filter out known malicious traffic.
Enforcer also makes an attempt to forecast the expected impact of each recommended filter, with the goal of predicting the filter’s effectiveness in stopping the attack traffic and the likely amount of collateral damage. This prediction is easily made by calculating the percentage of the inbound traffic matching the filtering rule. The collateral damage prediction is derived by calculating the percentage of traffic described by the baseline model that matches the filtering rule. Figure B.2 illustrates a sample filter forecast for two recommended filters. The packet attribute (high-performance Mazu) filter is predicted to reduce the incoming traffic by 63%, and inflict no collateral damage. The ACL filter is predicted to reduce the incoming traffic by 65% and inflict 3% of collateral damage. Enforcer can run in active, passive, or hybrid mode. Active mode places the Enforcer inline, between the entrance router connecting the network to the Internet and the firewall sitting in front of the network. Passive mode places a wiretap on the line connecting the router and the firewall. Hybrid mode combines the passive mode during normal operation with the ability to reroute traffic through the Enforcer and trigger the active mode once the attack has been detected.
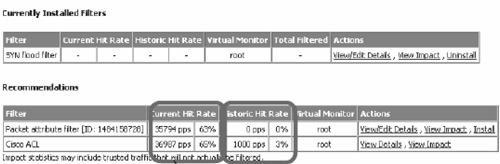
Figure B.2. Illustration of the Enforcer’s forecast of filter impact. (Reprinted from Mazu Enforcer white paper with permission of Mazu Networks.)
Enforcer literature specifies that it has an interactive traffic visualization and analysis tool which can be queried to display statistics on historical or current traffic across many dimensions. Such a tool should facilitate network management.
B.2 Peakflow by Arbor Networks
Peakflow is a family of security products, built on the common Peakflow Platform, which provides an architecture for extensive data collection and anomaly detection.
The Peakflow Platform, shown in Figure B.3, collects three kinds of data about network state.
1. Flow data, describing the traffic seen at each network device. This is a breakdown of traffic characteristics, including source and destination addresses and port numbers, and the transport protocol.
2. Routing data, describing the network connectivity.
3. Security data, collected from network intrusion detection systems (NIDSs) distributed throughout the network, describing detected intrusion attempts.
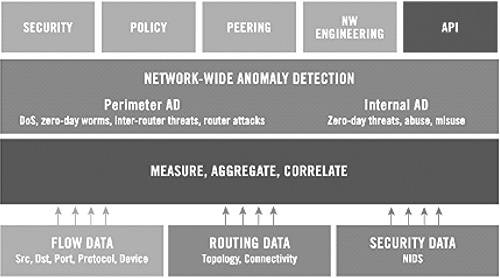
Figure B.3. Illustration of the Peakflow Platform. (Reprinted from Peakflow white paper with permission of Arbor Networks.)
Flow data is collected through distributed passive sensors that tap the network links, while routing and NIDS data is imported from existing network routers and intrusion detection systems. Collected data is used to build baseline models of normal network behavior. Peakflow Platform aggregates and correlates data measured during network operation, looking for anomalies that disagree with the baseline model. The Peakflow white papers specify that, in addition to DDoS, detected anomalies can be used to detect other security problems, such as Internet worms spreading in the network, router attacks, insider threats, and misuse of network resources.
Peakflow SP is a security product for service providers, which aims at protecting the deploying network from external threats and enhancing network management. Figure B.4 illustrates the deployment of Peakflow SP (shapes labeled “Arbor”) within a service provider’s network. Peakflow SP consists of two modules:
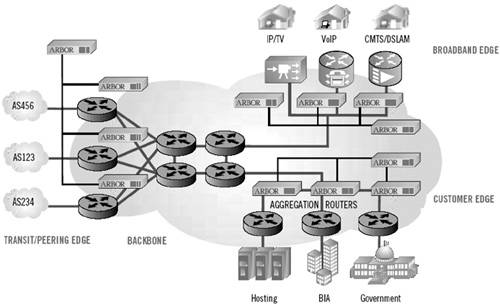
Figure B.4. Peakflow SP deployment within a service provider’s network. (Reprinted from Peakflow white paper with permission of Arbor Networks.)
1. Peakflow DoS, which attempts to detect and mitigate network threats.
2. Peakflow Traffic, which monitors and displays network statistics at different levels, which should facilitate network management.
Peakflow DoS uses Peakflow Platform to monitor network state, detect anomalies, and provide a fingerprint of the offending traffic. The fingerprint describes numerous traffic characteristics, including the source and destination ports and IP addresses, transport protocol, etc. The observations at different network points are then correlated and compared, looking for the presence of the fingerprint. Peakflow DoS thus attempts to trace the offending traffic and reconstruct its trajectory through the network. This action should identify network devices affected by the threat and facilitate easy mitigation. For instance, if a worm is detected in the network, the tracing process aims to identify all infected machines so that they can be cleaned by the operators. Attempted threat mitigation can be performed by Peakflow DoS itself policing the offending traffic through filtering, sinkhole routing or blackhole routing. Another option is that Peakflow DoS recommends filtering or rate-limiting rules to network routers. Peakflow DoS white papers also specify that the product generates detailed reports of the handled anomalies, which should facilitate forensics.
Peakflow Traffic uses Peakflow Platform to monitor, aggregate, and display data on network traffic and routing, which should facilitate network management. One goal of this monitoring process is to enable service providers to monitor behavior of their peers and optimize transit and peering arrangements. The other goal is to enable providers to monitor their customer traffic, which should help devise accurate pricing schemes and understand network utilization. Peakflow Traffic white papers specify that the product can profile network traffic at different granularities—peer-to-peer, AS-to-AS, and pop-to-pop—by various parameters, such as AS number, ASPath attribute, application, or next-hop router. Peakflow Traffic literature also specifies that the product can detect routing anomalies (such as route failures, suspicious BGP announcements, routing instability), can alert network operators, and provide detailed information to support mitigation. The product also offers detailed reports that can be exported in various formats and used to support network management decisions.
Peakflow X is a security system that aims to detect and mitigate internal threats within a company. Figure B.5 illustrates the deployment of Peakflow X (shapes labeled “Arbor”) within a service company’s network. Peakflow X organizes monitored hosts into groups based on similar operational policies and behavior. This creates a map of network usage with a goal to help operators to understand communication patterns between and within groups, profiled by network service, and possibly restructure the network to better use its resources. Grouping further aims to facilitate development of common policies for devices that have similar functionality. For instance, all Web servers could be grouped and managed together. Peakflow X uses Peakflow Platform to build baseline models of normal traffic patterns and to detect anomalous behavior. Peakflow X white papers specify that the product works together with NIDSs to tune NIDS behavior and disable signatures likely to generate false positives. It can also correlate NIDS signature detection with anomaly detection from Peakflow Platform, providing higher-confidence alerts. When a threat is detected, Peakflow X generates a threat alert, assigning it a priority level based on the sensitivity of target and protocol threat. The system also maintains a detailed log of historical network usage which aims to facilitate forensics and provide information for network engineering decisions.
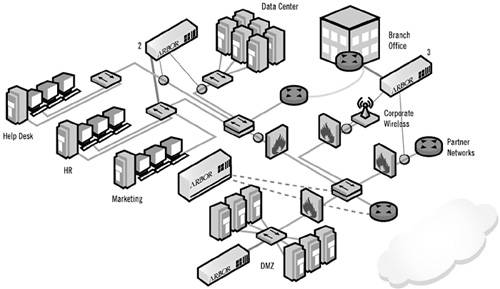
Figure B.5. Peakflow X deployment within a company’s network. Shapes labeled “Arbor” represent Peakflow modules monitoring traffic via inline taps (small circles on the links) and switches (shapes with arrows). (Reprinted from Peakflow white paper with permission of Arbor Networks.)
B.3 WS Series Appliances by Webscreen Technologies
Webscreen is primarily an inline security system, which aims to protect Web servers from DDoS attacks. Webscreen is deployed between a Web server (or a firewall) and the rest of the Internet. It examines each incoming packet using proprietary CHARM technology, attempting to assess a packet’s legitimacy. This packet processing is depicted in Figure B.6. CHARM technology monitors the behavior of users accessing the Web server during normal operation, building a baseline model of legitimate access patterns for each user and recording them in the Internet behavior table. Webscreen attempts to detect the occurrence of the attack by noting the change in traffic levels and user access patterns, in comparison with server resource utilization. Each incoming packet is then assessed for legitimacy and acted on accordingly. A packet is first screened by Syntax Screener, which checks whether the packet is properly formed. Packets that appear malformed will be dropped. A packet then passes through the CHARM Generator and is assigned a CHARM value using the data stored in the Internet behavior table for a given source address, and relating this data to packet contents. The vendor provides no details on how the CHARM value is generated. This value is then compared to the dynamic threshold by the CHARM Screener. The threshold value is dynamically adjusted according to the perceived server resource use—higher resource use results in higher thresholds. Only those packets whose CHARM value is greater than the threshold are allowed to reach the server. Packets deemed legitimate are also used to update the baseline models in the Internet behavior table. This approach appears to favor the known legitimate users, protecting their traffic during the attack, and it may reject first-time users whose access coincides with the attack.
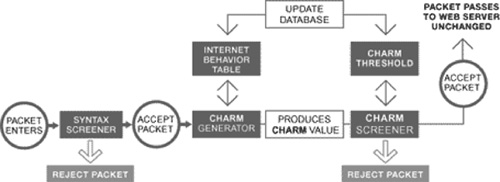
Figure B.6. Processing of an incoming packet by a Webscreen appliance using CHARM technology. (Reprinted from Webscreen’s white paper with permission of WebScreen technology, Inc.)
Webscreen Technology, Inc. offers three products that essentially provide the same protection functionality but operate at different scales. WS2 is designed for 2-Mbps throughput, monitors up to 500,000 source IP addresses, and works to protect up to eight IP addresses. WS100 and WS1000 both monitor up to 8 million source IP addresses and work to protect up to 512 IP addresses. WS100 is designed for 100-Mbps throughput and WS1000 is designed for 1-Gbps throughput.
B.4 Captus IPS by Captus Networks
Captus IPS is an inline, policy-based product that aims to detect and mitigate network threats. It provides policy language that administrators can use to specify fine-granularity security polices. Traffic features that can be used in policy specification include:
• Source and destination IP addresses and ports, and traffic protocol and flags.
• Traffic rate and duration of match required for trigger conditions.
Traffic features can be combined within a policy rule using AND and OR Boolean operators. Additionally, traffic can be grouped into areas, with multiple policies defined over a given area. Policies are used to define the desired condition of the network. A typical policy rule includes at least one match statement and one trigger statement. A match statement instructs Captus IPS to monitor traffic with specified characteristics, e.g., a given source and destination port and transport protocol. A trigger rule compares monitored traffic features with specified thresholds, such as flow rate or expected packet size. Rule violation results in an attack alert. Captus IPS white papers specify that the product can detect DoS attacks, Internet worm and virus propagation, peer-to-peer file sharing, port scans, spam, and insider threats. Captus IPS mitigation options include notifying network operators and shaping, redirecting, or denying traffic. The chosen option depends on the action specified in the violated policy rule.
Captus IPS View is a centralized management console for configuration, management, and monitoring of multiple Captus IPS devices. Captus IPS View white papers specify that the product provides network state visualization and report generation and detailed logging of traffic and attack data. Figure B.7 depicts deployment of Captus IPS and Captus IPS View devices within a company’s network.
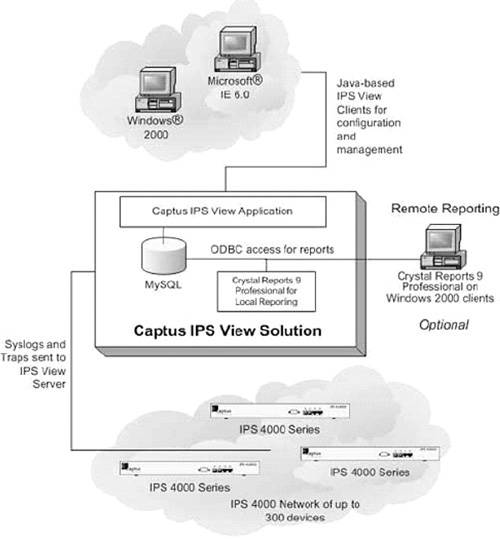
Figure B.7. Deployment of Captus IPS and Captus IPS View devices within a company’s network. (Reprinted from Captus products white paper with permission of Captus Networks Corporation.)
B.5 MANAnet Shield by CS3
MANAnet Shield is a family of products that aim to offer protection from both incoming and outgoing DDoS attacks:
• MANAnet FloodWatcher is a passive device that detects anomalies in network traffic that could be a sign of an incoming DDoS attack and alerts administrators.
• MANAnet Linux Router implements path-enhanced IP (PEIP—CS3 technology to defeat IP spoofing). It also attempts to enforce fair sharing of network resources based on PEIP information using CS3 technology called Place-Based Fair Queueing (PLFQ). The router can deploy rate-limiting rules as a response to incoming DDoS attacks, at the request of its neighbors, or on its own accord.
• MANAnet Firewall offers firewall functionality with PEIP and PLFQ and issues rate-limiting requests when a DDoS attack is detected.
• MANAnet Reverse Firewall is an inline device that aims to detect and throttle outgoing DDoS attacks.
MANAnet FloodWatcher monitors incoming and outgoing network traffic, collecting statistics on multiple traffic parameters. The collected data is compared to operator-set thresholds to detect anomalies. Offending traffic is then profiled and network operators are alerted about the attack and provided with a devised attack signature.
MANAnet Linux Router is a router implementing two proprietary technologies: PEIP, with a goal to defeat IP spoofing; and PLFQ, with a goal to provide fair resource sharing among legitimate users. PEIP modifies each packet with additional information to discern the path that the packet takes through a MANAnet-protected network. The first router on the path will append its IP address to the packet. Subsequent routers will enumerate their incoming interfaces, and append the number of the interface on which a packet was received to the path information. Packets that are replies to service requests preserve the path information from the request. Reply-specific path information is appended to the preserved request path. This should provide useful information in case of reflector DDoS attacks, where the path of reply traffic would be the same in all packets, but the request paths would differ. For instance, assume that three attackers—A, B, and C—send DNS requests to server S, faking a victim’s address V. All replies will carry an identical path from S to V, but they will also carry different paths for request packets indicating A, B, and C. PEIP information aims to help V drop offending replies (to requests from A, B, and C), while still being able to send DNS requests to S and receive replies. The IP address in the beginning of the path information is called a visible source. A MANAnet Linux Router subjects incoming traffic to the proprietary queueing algorithm PLFQ with a goal to assign a fair share of resources to each visible source. A visible source that is particularly misbehaving (sending large amounts of traffic) may be additionally restrained by the router deploying a rate limit on traffic from this source. Contiguous MANAnet routers organize themselves into cooperative neighborhoods and work together to build PEIP information and attempt to trace incoming attacks back to an ingress point into the neighborhood. Figure B.8 depicts two cooperative neighborhoods.
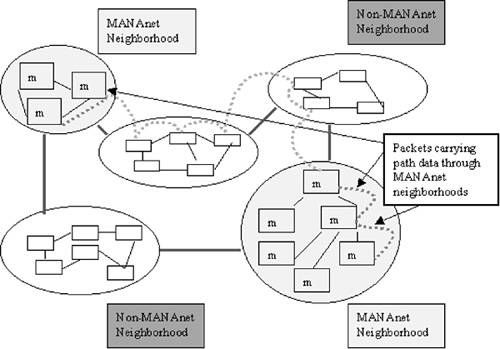
Figure B.8. MANAnet neighborhoods cooperate to defend against DDoS attacks. (Reprinted from MANAnet white paper with permission of CS3, Inc.)
MANAnet Firewall implements the standard firewall functionality and adds three new features:
1. The ability to decode PEIP information and perform PLFQ packet scheduling.
2. The ability to perform Historical Place-Based Fair Queueing (HPLFQ). The vendor does not offer much information on this option, except that the goal of HPLFQ is to ensure fair service to new requests with respect to the recent service history of their paths.
3. The ability to detect and rate-limit packets that are deemed “unexpected” by the firewall. The MANAnet Firewall keeps track of each established TCP connection, defining a range of expected sequence numbers to be seen in the incoming packets. This range is inferred by observing the acknowledgment and TCP window information from the connection’s outgoing packets. Incoming TCP packets with sequence numbers matching the defined range are called expected and sent to their destination. TCP packets that do not match the sequence number range, TCP SYN, UDP, and ICMP packets are called unexpected. These packets will be rate limited in case of an attack by being placed in different processing queues at the MANAnet Firewall and assigning a limited share of resources to each queue. Packets within the queue will be processed applying PLFQ. The product white papers specify that this creates a possibility for legitimate users to have their unexpected packets served even during a DDoS attack.
MANAnet Reverse Firewall applies MANAnet Firewall functionality to the outgoing traffic. It aims to detect outgoing DDoS attacks and responds by placing a rate limit on the amount of unexpected packets that is allowed to leave the network. In this case, packets that cannot be readily identified as replies to incoming TCP packets are called unexpected. The Reverse Firewall also deploys PEIP and PLFQ with a goal to offer fair service to legitimate users within the deploying network. The PEIP information in dropped packets should help network operators locate compromised machines within their network.
B.6 Cisco Traffic Anomaly Detector XT and Cisco Guard XT
Cisco Security products offer a family of solutions intended to mitigate DDoS attacks. Solutions come in two flavors:
1. Cisco Traffic Anomaly Detector XT aims to detect denial-of-service attacks, worms, and other threats by passively monitoring network traffic.
2. Cisco Guard XT is an inline solution that aims to mitigate attacks by policing offending traffic.
The Detector learns normal traffic patterns and builds baseline models of normal activity over time, using proprietary Multi-Verification Process (MVP) architecture. The Detector stores state for each session (e.g., a TCP connection) and verifies each incoming packet within the context of its session state, source, destination, and protocol. Monitored traffic is compared to baseline models using proprietary MVP technology to detect anomalous behavior. Upon attack detection, the Detector provides its corresponding Guard product with information about the attack’s target IP (or several target IPs). All traffic destined to the target IP is then diverted using proprietary Cisco technology through the Guard product, which examines each packet and classifies it as either legitimate or attack. The packet verification process again uses MVP architecture, and subjects each packet to five-stage inspection designed to identify and block the suspicious traffic while allowing legitimate packets to pass:
1. Filtering. The Guard initially enforces user-configurable static filters to block obvious and known attacks. Dynamic filters are defined and imposed in real time by later stages of the MVP process, based on specific anomalies detected during the inspection.
2. Active verification. The Guard uses proprietary mechanisms with a goal to detect and discard spoofed packets.
3. Anomaly recognition. This module monitors all traffic that has not been dropped by Filtering and Active Verification modules, and compares it to baseline models to detect anomalies. Baseline models attempt to capture legitimate behavior at source IP and protocol granularity, using numerous parameters, including the total traffic volume, distribution of packet sizes and port numbers, distribution of packet interarrival times, the number of concurrent flows, higher-level protocol characteristics, the ratio of inbound to outbound traffic, etc. Traffic that deviates significantly from the baseline is identified as attack. The Anomaly Recognition module then creates and imposes a series of dynamic filters at the Filtering module to block the newly discovered attack source.
4. Protocol analysis. This module processes flows identified as suspicious by the Anomaly Recognition module with a goal to identify application-specific attacks, such as incomplete or erroneous service requests. It then creates and imposes a series of dynamic filters at the Filtering module to block the newly discovered attack source.
5. Rate limiting. This module deploys per-flow and per-protocol traffic shaping, applying a target resource–specific policy. This policy is learned over time, with a goal of setting the appropriate rate limit without human intervention.
Figure B.9 depicts the Guard’s attack mitigation process. The Guard looks for signs that the attack has stopped and then restores diverted traffic to its original path. Detector and Guard are designed to be used as stand-alone solutions, as well as in joint operation. Figure B.10 depicts a recommended deployment of Detector and Guard products within a network. Both Detector and Guard products claim to generate detailed traffic reports that can be used by operators to examine network usage or to perform attack forensics. Figures B.9, B.10, and the text in this section have been reproduced by Prentice Hall with the permission of Cisco Systems, Inc. Copyright © 2004 Cisco Systems, Inc. All rights reserved.
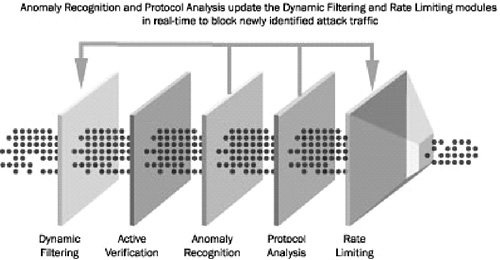
Figure B.9. Attack mitigation process in Cisco Guard and Cisco Guard XT
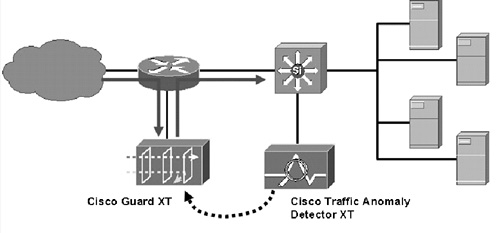
Figure B.10. A recommended deployment of Guard and Detector products within a network
B.7 StealthWatch by Lancope
StealthWatch aims to detect DDoS attacks by deploying anomaly detection. It profiles traffic at the host granularity and builds baseline models of each host’s activity, including services provided and requested by each host and the corresponding traffic volumes. Upon completing an initial training period, the host models are locked in place. Stealth-Watch also builds legitimate traffic models at a flow granularity, where Lancope defines a flow as any communication between two hosts, using a specific transport protocol and a specific destination port. During normal operation, each communication between hosts is assessed against corresponding flow and traffic models, and possibly using IDS-provided signature detection, and the source host is assigned a Concern Index denoting the level of suspicion. Each network host has a separate Concern Index threshold. When a host’s Concern Index exceeds the threshold, StealthWatch raises an alarm alerting the network administrator about suspicious host behavior. The vendor provides no details about the process of calculating the Concern Index or assigning host-specific thresholds. The StealthWatch white papers claim that this detection mechanism can be used to detect DoS attacks, worms, and insider threats.
By profiling individual hosts, StealthWatch also facilitates division of network resources into Virtual Security Zones. Hosts with similar network and application behaviors are grouped together into zones, facilitating zone-based security policy definition and enforcement, with a goal to help network management.
StealthWatch white papers specify that the product preserves detailed flow statistics and can display them using a variety of graphical views, which aim to facilitate network management and attack forensics.
StealthWatch can be deployed outside the firewall with a goal to protect a network from external threats, or inside the firewall with a goal to protect key segments from internal threats. Figure B.11 depicts a sample StealthWatch deployment inside a company’s network. The StealthWatch Management Console is a centralized management console for monitoring, configuration, and management of multiple StealthWatch devices. Its white papers specify that the product coordinates intelligence and attack alerts from these devices, offering a global view of network usage and security.
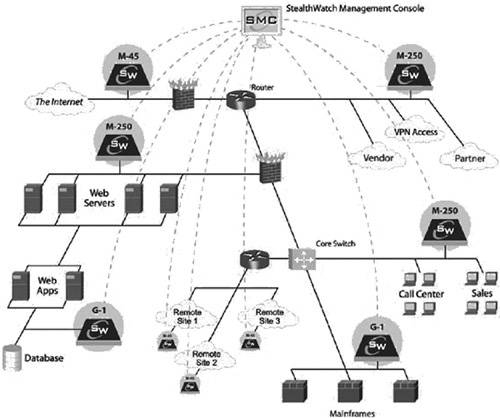
Figure B.11. Deployment of StealthWatch devices inside a company’s network. (Reprinted from StealthWatch white paper with permission of Lancope.)
B.8 Summary
After surveying the above solutions, several questions may have occurred to the reader.
• Are the preceding solutions the only ones that handle the DDoS problem? Not by any means. It was impossible to collect and survey all the existing DDoS solutions in this book, first, because space is limited and, second, because the market scene is continuously changing.
• Are the preceding solutions better than those that were not surveyed? This is a hard question to answer. Due to the lack of common evaluation methodology for DDoS defense solutions, it is impossible even to compare surveyed solutions to one another. It would be even more far-fetched to compare one of those to another solution not surveyed in this book. Rather, we believe that the selected solutions represent popular attack detection and mitigation approaches that are currently favored by the commercial community. Other solutions that you may find on the market are likely not to be drastically different from the surveyed ones. The overview of the functionalities offered by the preceding solutions should provide you with a list of features you can look for in a DDoS solution.
• So which one is the best? Ah, another hard question! There is currently no agreement in the DDoS defense community about the methodology for DDoS solution evaluation. Thus, even if we obtained and tested a sample of each of the systems discussed, we would have a hard time designing tests that everyone would accept as realistic and appropriate. This situation might change in the next few years. A number of ongoing research projects are examining the proper methods of evaluating DDoS defense solutions. The NSF also funded a project in 2003 to build a large DDoS research testbed [USC]. Answering questions about the relative performances of different research and commercial DDoS defense mechanisms may be more feasible when these projects have reached fruition.
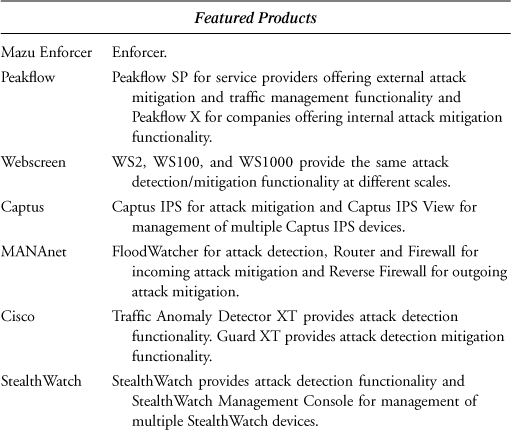
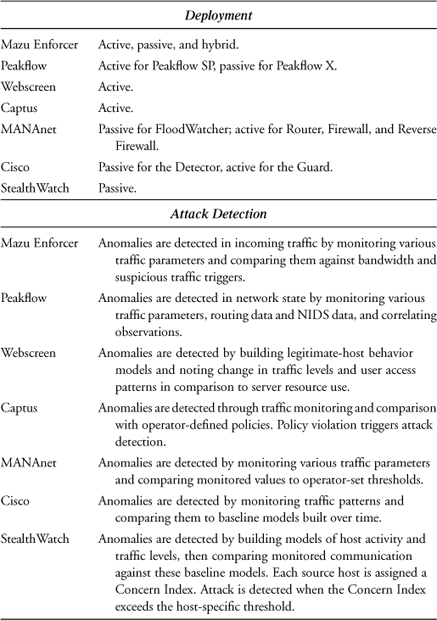
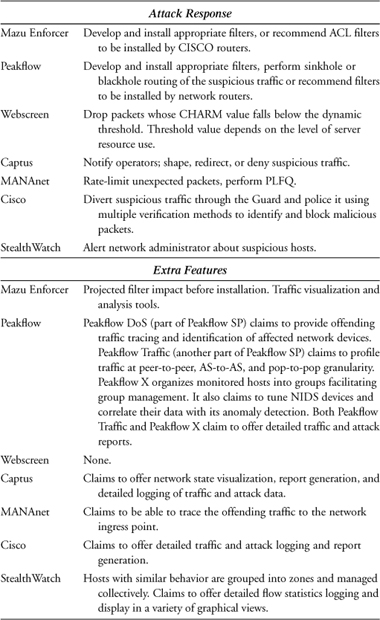
In an attempt to provide more useful information to the reader, we summarize the capabilities found in the preceding solutions in Table B.1. As with the earlier material in this appendix, the summary is based solely on vendor claims in product white papers and does not reflect any of the authors’ or publisher’s opinions.
Table B.1. Summary of Commercial Product Features