This chapter introduces tools to examine CPU cache activity (cpustat, cpu-track) and bus activity (busstat).
Figure 8.1 depicts typical caches that a CPU can use.
I-cache. Level 1 instruction cache
D-cache. Level 1 data cache
P-cache. Prefetch cache
W-cache. Write cache
E-cache. Level 2 external or embedded cache
These are the typical caches for the content of main memory, depending on the processor. Another framework for caching page translations as part of the Memory Management Unit (MMU) includes the Translation Lookaside Buffer (TLB) and Translation Storage Buffers (TSBs). These translation facilities are discussed in detail in Chapter 12 in Solaris™ Internals.
Of particular interest are the I-cache, D-cache, and E-cache, which are often listed as key specifications for a CPU type. Details of interest are their size, their cache line size, and their set-associativity. A greater size improves cache hit ratio, and a larger cache line size can improve throughput. A higher set-associativity improves the effect of the Least Recently Used policy, which can avoid hot spots where the cache would otherwise have flushed frequently accessed data.
Experiencing a low cache hit ratio and a large number of cache misses for the I-, D-, or E-cache is likely to degrade application performance. Section 8.2 demonstrates the monitoring of different event statistics, many of which can be used to determine cache performance.
It is important to stress that each processor type is different and can have a different arrangement, type, and number of caches. For example, the UltraSPARC IV+ has a Level 3 cache of 32 Mbytes, in addition to its Level 1 and 2 caches.
To highlight this further, the following describes the caches for three recent SPARC processors:
UltraSPARC III Cu. The Level 2 cache is an external cache of either 1, 4, or 8 Mbytes in size, providing either 64-, 256-, or 512-byte cache lines connected by a dedicated bus. It is unified, write-back, allocating, and either one-way or two-way set-associative. It is physically indexed, physically tagged (PIPT).
UltraSPARC IIIi. The Level 2 cache is an embedded cache of 1 Mbyte in size, providing a 64-byte cache line and is on the CPU itself. It is unified, write-back, write-allocate, and four-way set-associative. It is physically indexed, physically tagged (PIPT).
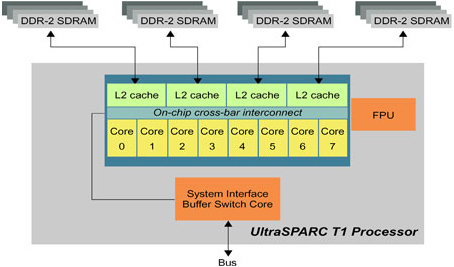
UltraSPARC T1. Sun’s UltraSPARC T1 is a chip level multi-processor. Its CMT hardware architecture has eight cores, or individual execution pipelines, per chip, each with four strands or active thread contexts that share a pipeline in each core. Each cycle of a different hardware strand is scheduled on the pipeline in round robin order. There are 32 threads total per Ultra-SPARC T1 processor.
The cores are connected by a high-speed, low-latency crossbar in silicon. An UltraSPARC T1 processor can be considered SMP on a chip. Each core has an instruction cache, a data cache, an instruction translation-lookaside buffer (iTLB), and a data TLB (dTLB) shared by the four strands. A twelve-way associative unified Level 2 (L2) on-chip cache is shared by all 32 hardware threads. Memory latency is uniform across all cores—uniform memory access (UMA), not non-uniform memory access (NUMA).
Figure 8.2 illustrates the structure of the UltraSPARC T1 processor.
For a reference on UltraSPARC caches, see the UltraSPARC Processors Documentation Web site at
http://www.sun.com/processors/documentation.html
This Web site lists the processor user manuals, which are referred to by the cpustat command in the next section. Other CPU brands have similar documentation that can be found online.
The cpustat command monitors the CPU Performance Counters (CPCs), which provide performance details for the CPU hardware caches. These types of hardware counters are known as Performance Instrumentation Counters, or PICs, which also exist on other devices. The PICs are programmable and record statistics for different events (event is a deliberate term). For example, they can be programmed to track statistics for CPU cache events.
A typical UltraSPARC system might provide two PICs, each of which can be programmed to monitor one event from a list of around twenty. An example of an event is an E-cache hit, the number of which could be counted by a PIC.
Which CPU caches can be measured depends on the type of CPU. Different CPU types not only can have different caches but also can have different available events that the PICs can monitor. It is possible that a CPU could contain a cache with no events associated with it—leaving us with no way to measure cache performance.
The following example demonstrates the use of cpustat to measure E-cache (Level 2 cache) events on an UltraSPARC IIi CPU.
# cpustat -c pic0=EC_ref,pic1=EC_hit 1 5
   time cpu event      pic0      pic1
  1.005   0  tick     66931     52598
  2.005   0  tick     67871     52569
  3.005   0  tick     65003     50907
  4.005   0  tick     64793     50958
  5.005   0  tick     64574     50904
  5.005   1 total    329172    257936
The cpustat command has a -c eventspec option to configure which events the PICs should monitor. We set pic0 to monitor EC_ref, which is E-cache references; and we set pic1 to monitor EC_hit, which is E-cache hits.
If both the cache references and hits are available, as with the UltraSPARC IIi CPU in the previous example, you can calculate the cache hit ratio. For that calculation you could also use cache misses and hits, which some CPU types provide. The calculations are fairly straightforward:
cache hit ratio = cache hits / cache references
cache hit ratio = cache hits / (cache hits + cache misses)
A higher cache hit ratio improves the performance of applications because the latency incurred when main memory is accessed through memory buses is obviated. The cache hit ratio may also indicate the pattern of activity; a low cache hit ratio may indicate a hot spot—where frequently accessed memory locations map to the same cache location, causing frequently used data to be flushed.
Since satisfying each cache miss incurs a certain time cost, the volume of cache misses may be of more interest than the cache hit ratio. The number of misses can more directly affect application performance than does changing percent hit ratios since the number of misses is proportional to the total time penalty.
Both cache hit ratios and cache misses can be calculated with a little awk, as the following script, called ecache, demonstrates.[1]
#!/usr/bin/sh
#
# ecache - print E$ misses and hit ratio for UltraSPARC IIi CPUs.
#
# USAGE: ecache [interval [count]]      # by default, interval is 1 sec

cpustat -c pic0=EC_ref,pic1=EC_hit ${1-1} $2 | awk '
        BEGIN { pagesize = 20; lines = pagesize }
        lines >= pagesize {
           lines = 0
           printf("%8s %3s %5s %9s %9s %9s %7s
",
              "E$  time", "cpu", "event", "total", "hits", "miss", "%hit")
        }
        $1 !~ /time/ {
           total = $4
           hits = $5
           miss = total - hits
           ratio = 100 * hits / total
           printf("%8s %3s %5s %9s %9s %9s %7.2f
",
              $1, $2, $3, total, hits, miss, ratio)
           lines++
        }
'
This script is verbose to illustrate the calculations performed, in particular, using extra named variables.[2] nawk or perl would also be suitable for postprocessing the output of cpustat, which itself reads the PICs by using the libcpc library, and binding a thread to each CPU.
The following example demonstrates the extra columns that ecache prints.
# ecache 1 5
E$  time cpu event     total      hits      miss    %hit
   1.013   0  tick     65856     51684     14172   78.48
   2.013   0  tick     71511     55793     15718   78.02
   3.013   0  tick     69051     54203     14848   78.50
   4.013   0  tick     69878     55082     14796   78.83
   5.013   0  tick     68665     53873     14792   78.46
   5.013   1 total    344961    270635     74326   78.45
This tool measures the volume of cache misses (miss) and the cache hit ratio (%hit) achieved for UltraSPARC II CPUs.
The -h option to cpustat lists the available events for a CPU type and the PICs that can monitor them.
# cpustat -h
Usage:
        cpustat [-c events] [-p period] [-nstD] [interval [count]]

        -c events specify processor events to be monitored
        -n        suppress titles
        -p period cycle through event list periodically
        -s        run user soaker thread for system-only events
        -t        include %tick register
        -D        enable debug mode
        -h        print extended usage information

        Use cputrack(1) to monitor per-process statistics.

        CPU performance counter interface:  UltraSPARC I&II

        event specification syntax:
        [picn=]<eventn>[,attr[n][=<val>]][,[picn=]<eventn>[,attr[n][=<val>]],...]

        event0:  Cycle_cnt Instr_cnt Dispatch0_IC_miss IC_ref DC_rd DC_wr
                 EC_ref EC_snoop_inv Dispatch0_storeBuf Load_use
                 EC_write_hit_RDO EC_rd_hit

        event1:  Cycle_cnt Instr_cnt Dispatch0_mispred EC_wb EC_snoop_cb
                 Dispatch0_FP_use IC_hit DC_rd_hit DC_wr_hit Load_use_RAW
                 EC_hit EC_ic_hit

        attributes: nouser sys

        See the "UltraSPARC I/II User's Manual" (Part No. 802-7220-02) for
        descriptions of these events. Documentation for Sun processors can
        be found at: http://www.sun.com/processors/manuals
The -h output lists the events that can be monitored and finishes by referring to the reference manual for this CPU. These invaluable manuals discuss the CPU caches in detail and explain what the events really mean.
In this example of cpustat -h, the event specification syntax shows that you can set picn to measure events from eventn. For example, you can set pic0 to IC_ref and pic1 to IC_hit; but not the other way around. The output also indicates that this CPU type provides only two PICs and so can measure only two events at the same time.
We chose the UltraSPARC IIi CPU for the preceding examples because it provides a small collection of fairly straightforward PICs. Understanding this CPU type is a good starting point before we move on to more difficult CPUs. For a full reference for this CPU type, see Appendix B of the UltraSPARC I/II User’s Manual.[3]
The UltraSPARC IIi provides two 32-bit PICs, which are joined as a 64-bit register. The 32-bit counters could wrap around, especially for longer sample intervals. The 64-bit Performance Control Register (PCR) configures those events (statistics) the two PICs will contain. Only one invocation of cpustat (or cputrack) at a time is possible, since there is only one set of PICs to share.
The available events for measuring CPU cache activity are listed in Table 8.1. This is from the User’s Manual, where you can find a listing for all events.
Table 8.1. UltraSPARC IIi CPU Cache Events
Event | PICs | Description |
|---|---|---|
| PIC0 | I-cache references; I-cache references are fetches of up to four instructions from an aligned block of eight instructions. I-cache references are generally prefetches and do not correspond exactly to the instructions executed. |
| PIC1 | I-cache hits. |
| PIC0 | D-cache read references (including accesses that subsequently trap); non-D-cacheable accesses are not counted. Atomic, block load, “internal” and “external” bad ASIs, quad precision LDD, and MEMBAR instructions also fall into this class. |
| PIC1 | D-cache read hits are counted in one of two places:
|
| PIC0 | D-cache write references (including accesses that subsequently trap); non-D-cacheable accesses are not counted. |
| PIC1 | D-cache write hits. |
| PIC0 | Total E-cache references; noncacheable accesses are not counted. |
| PIC1 | total E-cache hits. |
| PIC0 | E-cache hits that do a read for ownership of a UPA transaction. |
| PIC1 | E-cache misses that do writebacks. |
| PIC0 | E-cache invalidates from the following UPA transactions: S_INV_REQ, S_CPI_REQ. |
| PIC1 | E-cache snoop copybacks from the following UPA transactions: S_CPB_REQ, S_CPI_REQ, S_CPD_REQ, S_CPB_MSI_REQ. |
| PIC0 | E-cache read hits from D-cache misses. |
| PIC1 | E-cache read hits from I-cache misses. |
Reading through the descriptions will reveal many subtleties you need to consider to understand these events. For example, some activity is not cacheable and so does not show up in event statistics for that cache. This includes block loads and block stores, which are not sent to the E-cache since it is likely that this data will be touched only once. You should consider such a point if an application experienced memory latency not explained by the E-cache miss statistics alone.
Each of the 32 UltraSPARC T1 strands has a set of hardware performance counters that can be monitored using the cpustat(1M) command. cpustat can collect two counters in parallel, the second always being the instruction count. For example, to collect iTLB misses and instruction counts for every strand on the chip, type the following:
# /usr/sbin/cpustat -c pic0=ITLB_miss,pic1=Instr_cnt,sys 1 10
time cpu event pic0 pic1
2.019 0 tick 6 186595695 # pic0=ITLB_miss,sys,pic1=Instr_cnt,sys
2.089 1 tick 7 192407038 # pic0=ITLB_miss,sys,pic1=Instr_cnt,sys
2.039 2 tick 49 192237411 # pic0=ITLB_miss,sys,pic1=Instr_cnt,sys
2.049 3 tick 15 190609811 # pic0=ITLB_miss,sys,pic1=Instr_cnt,sys
......
Both a pic0 and pic1 register must be specified. ITLB_miss is used in the preceding example, although instruction counts are only of interest in this instance.
The performance counters indicate that each strand is executing about 190 million instructions per second. To determine how many instructions are executing per core, aggregate counts from four strands. Strands zero, one, two, and three are in the first core, strands four, five, six, and seven are in the second core, and so on. The preceding example indicates that the system is executing about 760 million instructions per core per second. If the processor is executing at 1.2 Gigahertz, each core can execute a maximum of 1200 million instructions per second, yielding an efficiency rating of 0.63. To achieve maximum throughput, maximize the number of instructions per second on each core and ultimately on the chip.
Other useful cpustat counters for assessing performance on an UltraSPARC T1 processor-based system are detailed in Table 8.2. All counters are per second, per thread. Rather than deal with raw misses, accumulate the counters and express them as a percentage miss rate of instructions. For example, if the system executes 200 million instructions per second on a strand and IC_miss indicates 14 million instruction cache misses per second, then the instruction cache miss rate is seven percent.
Table 8.2. UltraSPARC-T1 Performance Counters
Events | Description | High Value | Impact | Potential Remedy |
|---|---|---|---|---|
| Number of instruction cache misses | >7% | Small impact as latency can be hidden by strands | Compiler flag options to compact the binary. See compiler section. |
| Number of data cache misses | >11% | Small impact as latency can be hidden by strands | Compact data structures to align on 64-byte boundaries. |
| Number of instruction TLB misses | >.001% | Potentially severe impact from TLB thrashing | Make sure text on large pages. See TLB section. |
| Number of data TLB misses | >.005% | Potentially severe impact from TLB thrashing | Make sure data segments are on large pages. See TLB section. |
| Instruction cache misses that also miss L2 | >2% | Medium impact potential for all threads to stall | Reduce conflict with data cache misses if possible. |
| Data case misses that also miss L2 | >2% | Medium impact potential for all threads to stall | Potential alignment issues. Offset data structures. |
Since some CPUs have only two PICs, only two events can be measured at the same time. If you are looking at a specific CPU component like the I-cache, this situation may be fine. However, sometimes you want to monitor more events than just the PIC count. In that case, you can use the -c option more than once, and the cpustat command will alternate between them. For example,
# cpustat -c pic0=IC_ref,pic1=IC_hit -c pic0=DC_rd,pic1=DC_rd_hit -c
pic0=DC_wr,pic1=DC_wr_hit -c pic0=EC_ref,pic1=EC_hit -p 1 0.25 5
   time cpu event      pic0      pic1
  0.267   0  tick    221423    197095  # pic0=IC_ref,pic1=IC_hit
  0.513   0  tick       105        65  # pic0=DC_rd,pic1=DC_rd_hit
  0.763   0  tick        37        21  # pic0=DC_wr,pic1=DC_wr_hit
  1.013   0  tick       282       148  # pic0=EC_ref,pic1=EC_hit
  1.267   0  tick    213558    190520  # pic0=IC_ref,pic1=IC_hit
  1.513   0  tick       109        62  # pic0=DC_rd,pic1=DC_rd_hit
  1.763   0  tick        37        21  # pic0=DC_wr,pic1=DC_wr_hit
  2.013   0  tick       276       149  # pic0=EC_ref,pic1=EC_hit
  2.264   0  tick    217713    194040  # pic0=IC_ref,pic1=IC_hit
...
We specified four different PIC configurations (-c eventspec), and cpustat cycled between sampling each of them. We set the interval to 0.25 seconds and set a period (-p) to 1 second so that the final value of 5 is a cycle count, not a sample count. An extra commented field lists the events the columns represent, which helps a postprocessing script such as awk to identify what the values represent.
Some CPU types provide many PICs (more than eight), usually removing the need for event multiplexing as used in the previous example.
Each example output of cpustat has contained a column for the CPU ID (cpu). Each CPU has its own PIC, so when cpustat runs on a multi-CPU system, it must collect PIC values from every CPU. cpustat does this by creating a thread for each CPU and binding it onto that CPU. Each sample then produces a line for each CPU and prints it in the order received. Thus, some slight shuffling of the output lines occurs.
The following example demonstrates cpustat on a server with four Ultra-SPARC IV CPUs, each of which has two cores.
# cpustat -c pic0=DC_rd,pic1=DC_rd_miss 5 1
   time cpu event      pic0      pic1
  5.008 513  tick    355670     25132
  5.008   3  tick   8824184     34366
  5.008 512  tick        11         1
  5.008   2  tick      1127       123
  5.008 514  tick     55337      3908
  5.008   0  tick        10         3
  5.008   1  tick     19833       854
  5.008 515  tick   7360753     36567
  5.008   8 total  16616925     100954
The cpu column prints the total CPU count for the last line (total).
The CPC events can monitor more than just the CPU caches. The following example demonstrates the use of the cycle count and instruction count on an Ultra-SPARC IIi to calculate the average number of cycles per instruction, printed last.
# cpustat -nc pic0=Cycle_cnt,pic1=Instr_cnt 10 1 |
awk '{ printf "%s %.2f cpi
",$0,$4/$5; }'
 10.034   0  tick 3554903403 3279712368  1.08 cpi
 10.034   1 total 3554903403 3279712368  1.08 cpi
This single 10-second sample averaged 1.08 cycles per instruction. During this test, the CPU was busy running an infinite loop program. Since the same simple instructions are run over and over, the instructions and data are found in the Level-1 cache, resulting in fast instructions.
Now the same test is performed while the CPU is busy with heavy random memory access:
# cpustat -nc pic0=Cycle_cnt,pic1=Instr_cnt 10 1 |
awk '{ printf "%s %.2f cpi
",$0,$4/$5; }'
 10.036   0  tick 205607856  34023849  6.04 cpi
 10.036   1 total 205607856  34023849  6.04 cpi
Since accessing main memory is much slower, the cycles per instruction have increased to an average of 6.04.
The UltraSPARC IV processor provides a greater number of events that can be monitored. The following example is the output from cpustat -h, which lists these events.
# cpustat -h
...
Use cputrack(1) to monitor per-process statistics.

        CPU performance counter interface:  UltraSPARC III+ & IV

        events  pic0=<event0>,pic1=<event1>[,sys][,nouser]

        event0: Cycle_cnt Instr_cnt Dispatch0_IC_miss IC_ref DC_rd DC_wr
                EC_ref EC_snoop_inv Dispatch0_br_target Dispatch0_2nd_br
                Rstall_storeQ Rstall_IU_use EC_write_hit_RTO EC_rd_miss
                PC_port0_rd SI_snoop SI_ciq_flow SI_owned SW_count_0
                IU_Stat_Br_miss_taken IU_Stat_Br_count_taken
                Dispatch_rs_mispred FA_pipe_completion MC_reads_0
                MC_reads_1 MC_reads_2 MC_reads_3 MC_stalls_0 MC_stalls_2
                EC_wb_remote EC_miss_local EC_miss_mtag_remote

        event1: Cycle_cnt Instr_cnt Dispatch0_mispred EC_wb EC_snoop_cb
                IC_miss_cancelled Re_FPU_bypass Re_DC_miss Re_EC_miss
                IC_miss DC_rd_miss DC_wr_miss Rstall_FP_use EC_misses
                EC_ic_miss Re_PC_miss ITLB_miss DTLB_miss WC_miss
                WC_snoop_cb WC_scrubbed WC_wb_wo_read PC_soft_hit
                PC_snoop_inv PC_hard_hit PC_port1_rd SW_count_1
                IU_Stat_Br_miss_untaken IU_Stat_Br_count_untaken
                PC_MS_misses Re_RAW_miss FM_pipe_completion MC_writes_0
                MC_writes_1 MC_writes_2 MC_writes_3 MC_stalls_1 MC_stalls_3
                Re_DC_missovhd EC_miss_mtag_remote EC_miss_remote

        See the "SPARC V9 JPS1 Implementation Supplement: Sun
        UltraSPARC-III+"
Some of these are similar to the UltraSPARC IIi CPU, but many are additional. The extra events allow memory controller and pipeline activity to be measured.
While the cpustat command monitors activity for the entire system, the cputrack command allows the same counters to be measured for a single process. This can be useful for focusing on particular applications and determining whether only one process is the cause of performance issues.
The event specification for cputrack is the same as cpustat, except that instead of an interval and a count, cputrack takes either a command or -p PID.
# cputrack
Usage:
        cputrack [-T secs] [-N count] [-Defhnv] [-o file]
                -c events [command [args] | -p pid]

        -T secs   seconds between samples, default 1
        -N count  number of samples, default unlimited
        -D        enable debug mode
        -e        follow exec(2), and execve(2)
        -f        follow fork(2), fork1(2), and vfork(2)
        -h        print extended usage information
        -n        suppress titles
        -t        include virtualized %tick register
        -v        verbose mode
        -o file   write cpu statistics to this file
        -c events specify processor events to be monitored
        -p pid    pid of existing process to capture

        Use cpustat(1M) to monitor system-wide statistics.
The usage message for cputrack ends with a reminder to use cpustat for systemwide statistics.
The following example demonstrates cputrack monitoring the instructions and cycles for a sleep command.
# cputrack -c pic0=Instr_cnt,pic1=Cycle_cnt sleep 5
   time lwp      event      pic0      pic1
  1.024   1       tick    188134    629987
  2.023   1       tick         0         0
  3.023   1       tick         0         0
  4.023   1       tick         0         0
  5.023   1       tick         0         0
  5.034   1       exit    196623    682808
In the first second, the sleep command initializes and executes 188, 134 instructions. Then the sleep command sleeps, reporting zero counts in the output; this shows that cputrack is monitoring our sleep command only and is not reporting on other system activity. The sleep command wakes after five seconds and executes the final instructions, finishing with the total on exit of 196, 623 instructions.
As another example, we use cputrack to monitor the D-cache activity of PID 19849, which has multiple threads. The number of samples is limited to 20 (-N).
$ cputrack -N 20 -c pic0=DC_access,pic1=DC_miss -p 19849
   time lwp      event      pic0      pic1
  1.007   1       tick  34543793    824363
  1.007   2       tick         0         0
  1.007   3       tick 1001797338   5153245
  1.015   4       tick 976864106   5536858
  1.007   5       tick 1002880440   5217810
  1.017   6       tick 948543113   3731144
  2.007   1       tick  15425817    745468
  2.007   2       tick         0         0
  2.014   3       tick 1002035102   5110169
  2.017   4       tick 976879154   5542155
  2.030   5       tick 1018802136   5283137
  2.033   6       tick 1013933228   4072636
......
This CPU type provides D-cache misses for pic1, a useful statistic inasmuch as cache misses incur a certain time cost. Here, lwp 2 appears to be idle, while lwps 3, 4, 5, and 6 are causing many D-cache events. With a little awk, we could add another column for D-cache hit ratio.
For additional information on cputrack, see cputrack(1).
The busstat command monitors bus statistics for systems that contain instrumented buses. Such buses contain Performance Instrumentation Counters (PICs), which in some ways are similar to the CPU PICs.
busstat -l lists instrumented buses that busstat can monitor.
# busstat -l
busstat: No devices available in system.
If you see the “No devices available” message, then you won’t get any further. Find another system (usually a larger system) that responds by listing instance names. The following is from a Sun Enterprise E4500.
# busstat -l
Busstat Device(s):
sbus1 ac0 ac1 ac2 ac3 ac4 sbus0 sbus2 sbus3 sbus4
The output of busstat -l has now listed six devices that provide PICs for us to use. sbus is for SBus, the interconnect bus for devices including peripherals; ac is for Address Controller.
The -e switch for busstat lists events that a bus device can monitor. Here we list events for ac0.
# busstat -e ac0
pic0
mem_bank0_rds
mem_bank0_wrs
mem_bank0_stall
mem_bank1_rds
mem_bank1_wrs
mem_bank1_stall
clock_cycles
...

pic1
mem_bank0_rds
mem_bank0_wrs
mem_bank0_stall
mem_bank1_rds
mem_bank1_wrs
mem_bank1_stall
clock_cycles
...
The list of events for each PIC is very long; we truncated it so that this example doesn’t fill an entire page.
It can help to use the pr command to rework the output into columns. The following example does this for the sbus0.
# busstat -e sbus0 | pr -t2
pic0                                pic1
dvma_stream_rd                      dvma_stream_rd
dvma_stream_wr                      dvma_stream_wr
dvma_const_rd                       dvma_const_rd
dvma_const_wr                       dvma_const_wr
dvma_tlb_misses                     dvma_tlb_misses
dvma_stream_buf_mis                 dvma_stream_buf_mis
dvma_cycles                         dvma_cycles
dvma_bytes_xfr                      dvma_bytes_xfr
interrupts                          interrupts
upa_inter_nack                      upa_inter_nack
pio_reads                           pio_reads
pio_writes                          pio_writes
sbus_reruns                         sbus_reruns
pio_cycles                          pio_cycles
#
The first column lists events for pic0; the second are events for pic1.
Unlike cpustat, busstat does not finish by listing a reference manual for these events. There is currently little public documentation for bus events[4]; most Internet searches match only the man page for busstat and the event names in the OpenSolaris source. Fortunately, many of the event names are self-evident (for example, mem_bank0_rds is probably memory bank 0 reads), and some of the terms are similar to those used for CPU PICs, as documented in the CPU manuals.
Monitoring bus events is similar to monitoring CPU events, except that we must specify which bus instance or instances to examine.
The following example examines ac1 for memory bank stalls, printing a column for each memory bank. We specified an interval of 1 second and a count of 5.
# busstat -w ac1,pic0=mem_bank0_stall,pic1=mem_bank1_stall 1 5
time dev    event0               pic0        event1               pic1
1    ac1    mem_bank0_stall      2653        mem_bank1_stall      0
2    ac1    mem_bank0_stall      2039        mem_bank1_stall      0
3    ac1    mem_bank0_stall      3614        mem_bank1_stall      0
4    ac1    mem_bank0_stall      3213        mem_bank1_stall      0
5    ac1    mem_bank0_stall      2380        mem_bank1_stall      0
The second bank is empty, so pic1 measured no events for it. Memory stall events are interesting—they signify latency suffered when a memory bank is already busy with a previous request.
There are some differences between busstat and cpustat: There is no total line with busstat, and intervals less than one second are not accepted. busstat uses a -w option to indicate that devices are written to, thereby configuring them so that their PICs will monitor the specified events, whereas cpustat itself writes to each CPU’s PCR.
By specifying ac instead of ac1, we now monitor these events across all address controllers.
# busstat -w ac,pic0=mem_bank0_stall,pic1=mem_bank1_stall 1 5
time dev    event0               pic0        event1               pic1
1    ac0    mem_bank0_stall      2641        mem_bank1_stall      0
1    ac1    mem_bank0_stall      2766        mem_bank1_stall      0
1    ac2    mem_bank0_stall      0           mem_bank1_stall      0
1    ac3    mem_bank0_stall      0           mem_bank1_stall      0
1    ac4    mem_bank0_stall      0           mem_bank1_stall      0
2    ac0    mem_bank0_stall      2374        mem_bank1_stall      0
2    ac1    mem_bank0_stall      2545        mem_bank1_stall      0
2    ac2    mem_bank0_stall      0           mem_bank1_stall      0
2    ac3    mem_bank0_stall      0           mem_bank1_stall      0
2    ac4    mem_bank0_stall      0           mem_bank1_stall      0
3    ac0    mem_bank0_stall      2133        mem_bank1_stall      0
We would study the dev column to see which device the line of statistics belongs to.
busstat also provides a -r option, to read PICs without changing the configured events. This means that we monitor whatever was previously set by -w. Here’s an example of using -r after the previous -w example.
# busstat -r ac0 1 5
time dev    event0               pic0        event1               pic1
1    ac0    mem_bank0_stall      2039        mem_bank1_stall      0
2    ac0    mem_bank0_stall      1822        mem_bank1_stall      0
3    ac0    mem_bank0_stall      1868        mem_bank1_stall      0
4    ac0    mem_bank0_stall      2109        mem_bank1_stall      0
5    ac0    mem_bank0_stall      1779        mem_bank1_stall      0
As with using cpustat for a limited number of PICs (see Section 8.2.5), you can specify multiple events for busstat so that more events than PICs can be monitored. The multiple-event specifications are measured alternately.
The following example demonstrates the use of busstat to measure many bus events.
# busstat -w ac0,pic0=mem_bank0_rds,pic1=mem_bank0_wrs -w
ac0,pic0=addr_pkts,pic1=data_pkts -w ac0,pic0=ac_addr_pkts,pic1=ac_data_pkts 1 9
time dev    event0               pic0        event1               pic1
1    ac0    mem_bank0_rds        47692       mem_bank0_wrs        1785
2    ac0    addr_pkts            87753       data_pkts            112209
3    ac0    ac_addr_pkts         126718      ac_data_pkts         141410
4    ac0    mem_bank0_rds        40187       mem_bank0_wrs        4860
5    ac0    addr_pkts            92343       data_pkts            119899
6    ac0    ac_addr_pkts         55964       ac_data_pkts         69573
7    ac0    mem_bank0_rds        39518       mem_bank0_wrs        3050
8    ac0    addr_pkts            84103       data_pkts            108542
9    ac0    ac_addr_pkts         256737      ac_data_pkts         317145
#
We specified three pairs of events, with an interval of one second and a count of nine. Each event pair was measured three times, for one second. We would study the event0 and event1 columns to see what the pic values represent.
For additional information on busstat, see busstat(1M).
UltraSPARC T1 processors also have a number of DRAM performance counters, the most important of which are read and write operations to each of the four memory banks. The tool to display DRAM counters is the busstat command. Be sure to type the command on a single line.
# busstat -w dram0,pic0=mem_reads,pic1=mem_writes -w dram1,pic0=mem_reads,pic1=mem_
writes
-w dram2,pic0=mem_reads,pic1=mem_writes -w dram3,pic0=mem_reads,pic1=mem_writes
time dev event0 pic0 event1 pic1
1 dram0 mem_reads 16104 mem_writes 8086
1 dram1 mem_reads 15953 mem_writes 8032
1 dram2 mem_reads 15957 mem_writes 8069
1 dram3 mem_reads 15973 mem_writes 8001
The counts are of 64-byte lines read or written to memory; to get the total bandwidth, add all four counters together. In the preceding example, the system is roughly reading (4 * 16000 * 64) = 4096000 bytes / 3.9 megabytes per second and writing (4 * 8000 * 64 bytes) = 2048000 bytes / 1.95 megabytes per second.
[1] This script is based on E-cache from the freeware CacheKit (Brendan Gregg). See the Cache-Kit for scripts that support other CPU types and scripts that measure I- and D-cache activity.
[2] A one-liner version to add just the %hit column is as follows:
# cpustat -nc pic0=EC_ref,pic1=EC_hit 1 5 | awk '{ printf "%s %.2f
",$0,$5*100/$4 }'
[3] This manual is available at http://www.sun.com/processors/manuals/805-0087.pdf.
[4] Probably because no one has asked! busstat is not in common use by customers; the main users have been engineers within Sun.