
5. Strategy: The Alignment of External Realities, Setting Measurable Goals, and Internal Actions
With Mike Brennan
Why even bother discussing strategy in a book devoted to the deployment of Six Sigma? Because moving from strategy to breakthrough performance is one of the toughest leadership challenges. It takes careful understanding of the external realities of your markets and your customers, setting measurable goals, and aligning your internal actions to accomplish the strategic forecasted outcomes.
In fact, in their excellent article, “Turning Great Strategy into Great Performance” (Harvard Business Review, July–August, 2005), Michael Mankins and Richard Steele report that, of 197 large companies surveyed, companies generally delivered 63 percent of the financial performance promised by the strategy. Many CEOs have been fired because they could not execute their strategic plan. Doing that is the real art of successful businesses.
As discussed in Chapter 2, “The True Nature of Six Sigma: The Business Model,” Larry Bossidy (with Ram Charan) in his book, Confronting Reality, presents a unique business model that links three components:
• External realities
• Financial targets
• Internal activities
These three components are linked into a dynamic system that produces new business models with which to move your business smoothly into new markets and new products. The authors state, “Linking and iterating the financial targets, external realities, and internal activities, and searching for the right mix in each of the three components of the business model, is what determines the accuracy of the final product.” You will make money by effectively linking your internal activities to the external realities and setting appropriate financial targets.
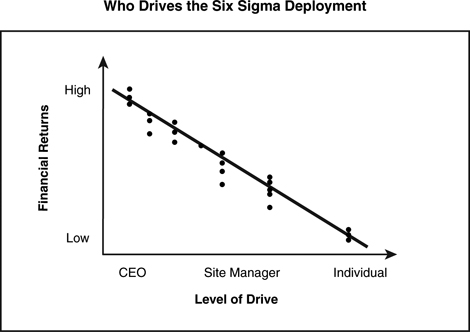
The construct that drives the linkage is the strategic plan, which is included in internal activities. Companies that realize breakthrough results with Lean and Six Sigma have strong leadership that drives the change initiative from the Corporate Strategic Plan through to the lowest levels of the organization. The total financial returns are directly related to the organizational level of the leadership driving it, as shown in Figure 5.1. Figure 5.1 displays that senior leadership driving Six Sigma as a strategic initiative will achieve noteworthy financial benefits from the deployment.
Figure 5.1 This chart shows that the financial results from a Six Sigma deployment are strongly related to the level of leadership committed to the deployment.
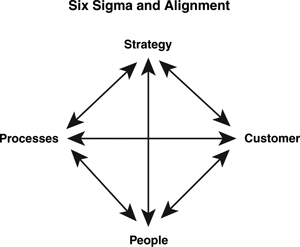
Six Sigma is truly a company culture change, in that it moves decision making from the political/subjective realm to a data-driven process. In their outstanding book titled The Power of Alignment, George Labovitz and Victor Rosansky created a linkage model that directly compares to the three-component business model.
This model is seen in Figure 5.2 and shows the vertical linkage of the corporate strategy to its people. It also displays the horizontal linkage from the business processes to the customer. In addition, the model shows that the strategy is linked to the processes, the people, and the customers (external realities). Likewise, it displays people being linked to the processes, strategy, and customers as well. This is actually a definition of Six Sigma: Optimized business processes developed by people make the customers happy. The strategy drives which customer, process, and products need to be optimized.
Figure 5.2 This chart shows the model developed by Labovitz and Rosansky in their book, The Power of Alignment. Making the critical linkages among strategy, people, customers, and processes is the key to Six Sigma success.
In fact, Total Quality Management (TQM) largely failed because organizations didn’t link TQM activities to the external realities as defined in a good strategy. Likewise, reengineering largely failed because organizations didn’t link processes to strategy and people.
Recently I talked to a new CEO whom I knew from my work with AlliedSignal. I asked him how he was doing in his new job. He said it was easy: “Just improve growth and productivity.” He was right. Of course, growth is very difficult if your company’s productivity is inadequate. To grow, your operational excellence must be there. Regardless of whether your company has a strategic plan or not, the first step in the improvement process is to move to operational excellence in your existing business lines. You shouldn’t waste time in getting started, as every day of delay is lost profit. Most companies, in fact, do start Six Sigma by focusing on productivity in one form or another.
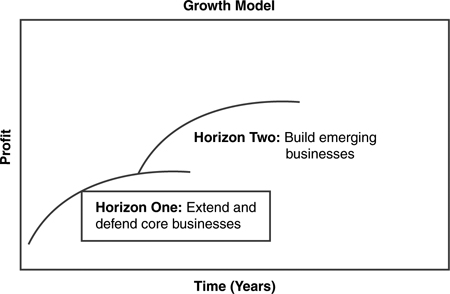
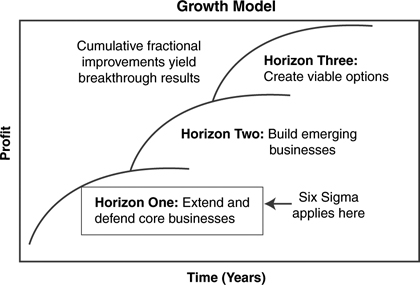
The data analysis of more than 50 different companies and their Six Sigma deployments shows that 1 percent of your population of employees trained as Black Belts can deliver four profit improvement projects per year, each with an average profit improvement of $250,000 per project, for a total of $1,000,000 per trained full-time Black Belt per year. In the first two years of deployment, you should expect to achieve 2 to 4 percent of your revenue in profit improvements. From a timeline standpoint, getting your existing business to operational excellence is the first order of business, and Mehrdad Baghai in his book, The Alchemy of Growth, calls this Horizon 1, as shown in Figure 5.3.
Figure 5.3 Adapted from Baghai, Coley, & White. The three horizons of growth. Strategic plans should include plans to move further in each horizon.
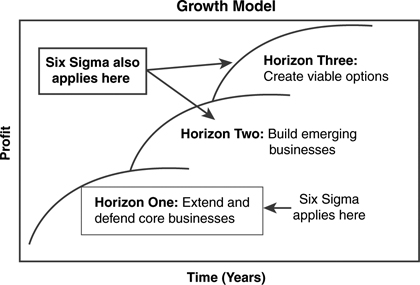
Baghai’s model consists of three growth horizons. The first horizon (extend and defend the core businesses) is focused on shoring up the core businesses and getting the potential growth that remains. By successfully executing Horizon 1, you will earn the opportunity to start Horizon 2 and 3 growth activities. So Horizon 1 tends to be focused on productivity as a priority, with growth as a secondary priority.
The second horizon (build emerging businesses) places a premium on growth and building new streams of revenue, rather than improving productivity. Horizon 2 focuses on the new potential star products or services of the company and extending the core business. Horizon 3 (create viable options) is focused on creating new business out of research or pilot projects and creating new core businesses. Horizon 3 is the lifeblood of a long-term company.
Taking the concept of improving productivity and then focusing on growth, improving Horizon 1 is the ticket to creating strategic actions in Horizon 2 and Horizon 3. You have to be able to eat short term to grow long term.
An excellent strategic plan will include ideas and actions for all three horizons. Six Sigma is ideal for Horizon 1 because the priority is improving operational excellence. But Six Sigma is also instrumental in Horizon 2 and Horizon 3, with Design for Six Sigma, Technology for Six Sigma, and Marketing for Six Sigma. Therefore, the strategy can yield Six Sigma projects for all three horizons simultaneously.
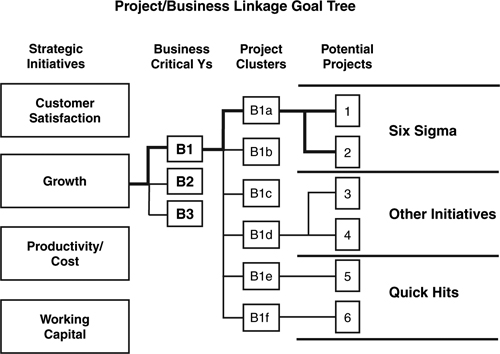
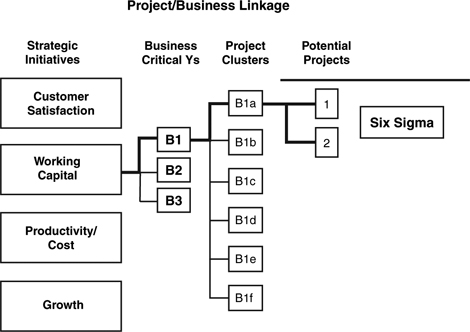
The Six Sigma project selection process starts with the measurable corporate business goals. The key word here is “measurable.” If the goal isn’t measurable, with a baseline value of where you are today and a value of where you want to be at a specific time in the future, then you don’t have a goal. Each business unit identifies its own measurable goals that support the corporate business goals. These measurable goals are called Business Critical Ys to represent the output from the completed projects. Then, project cluster areas are identified, like accounts payable, working capital, supply chain, and so on. From here, individual projects can be identified that are linked to the business goals, as shown in Figure 5.4.
Figure 5.4 The linkages linking the top strategic initiatives to the measurable Critical Ys, to project clusters, and finally to projects. Projects all have a “line of sight” to at least one or more strategic initiative.
Now that we have kicked off projects that will improve our base business, it is time to turn our attention to the medium-term strategic goals, or from a timing standpoint, Horizon 2, as shown in Figure 5.5.
Figure 5.5 Horizon 1 success is necessary to earn growth in Horizon 2.
Even though Motorola started Six Sigma, it was General Electric that showed the world on a large and dramatic scale that the Six Sigma methodology applies to any business process. As we have seen earlier, the basic equation of Six Sigma is: the Output (Y) is a function of some number of input variables (Y is a function of Xs). This approach can also be applied to the strategic planning process. Figure 5.6 shows that the typical financial outputs of a company are a function of certain input variables.
Figure 5.6 The Critical Ys are a function of inputs. Projects improving those inputs will improve the performance on the outputs.
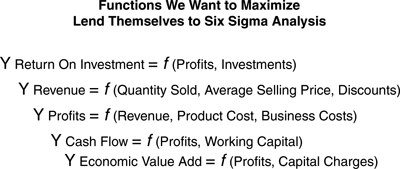
Figure 5.6 displays some of the financial inputs for the outputs (Ys) of return on investment, revenue, profits, cash flow, and economic value add. For example, we can say that revenue is a function of quantity sold, average selling price, and discounts. Of course, there are a lot of other inputs for revenue, but the point is that some inputs are more important than others. The process of Six Sigma is designed to identify the most important inputs, optimize those inputs, and then control them.
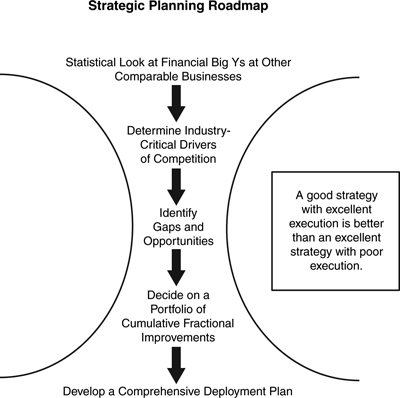
Figure 5.7 shows the roadmap we will use in the strategic planning process. The first step is to discover the financial factors that determine the long-term value of a company. Then we look to the external realities to determine the specific industry-critical drivers of competition. Next, we identify the gaps in our company’s competitive position and opportunities to exploit. To address the gaps and opportunities, we pick a balanced portfolio of cumulative fractional improvements to better position ourselves. The last step is the one where most companies fail to achieve their strategic intent, and that is the execution of a comprehensive deployment plan.
Figure 5.7 This is one roadmap leading to the output of a comprehensive strategic deployment plan. The strategic plan addresses the external realities by aligning internal actions to the strategy.
General Electric did a benchmarking study identifying factors that have the biggest influence on long-term company value. As one might expect, return on investment (ROI) has the biggest effect on long-term company value, as shown in Figure 5.8.
Figure 5.8 The linkage of strategic drivers to the long-term company value. The more strategic drivers that are made real to the company, the more value the company delivers.

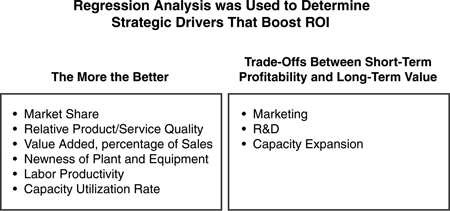
GE also did an analysis on what factors affected ROI. Figure 5.9 shows “the more, the better factors” like market share (be #1 or # 2 in your market), relative product/service quality (you have preferred product or service), and so on. It also shows the factors that are trade-offs between short-term profitability and long-term value. The key finding was that businesses that perform best over the long term are more aggressive in investing in marketing, R&D, and capacity expansion than competitors.
Figure 5.9 Businesses that perform best over the long term are more aggressive in the trade-off factors of marketing, R&D, and capacity expansion than competitors.
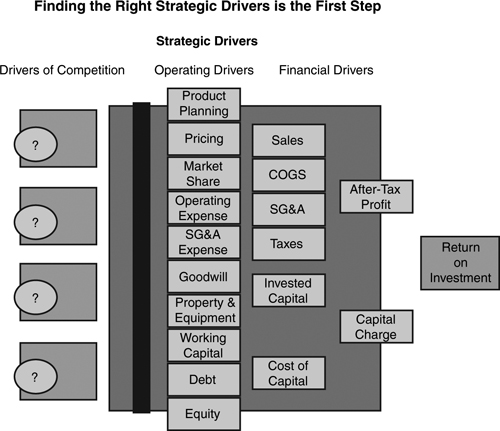
Now our job is to find the drivers of competition, as shown on Figure 5.10, which will allow us to be the most preferred supplier by our targeted customers. Being the most preferred supplier of products or services drives revenue growth. Once we have generated the revenues, the operational drivers will determine how effectively and efficiently we deliver on the drivers of competition. And finally, the financial drivers will determine how well we achieve our business goals.
Figure 5.10 Identifying the factors that drive competition are linked to strategic and operational drivers and then to financial targets.
Interviews with your customers will reveal their needs and how your company compares to your competitors in delivering on these prioritized customer requirements. Design for Six Sigma’s (DFSS’s) Quality Function Deployment (QFD) is used as a planning tool. The right side of the QFD House of Quality depicts a graphical representation of how you fare against competition in meeting the prioritized customer requirements. Figure 5.11 shows an example company. A set of customers rated the company on several drivers of customer satisfaction to include in order of importance and the customer rating. For the customer rating, the higher the rating, the better:
2. Brand (1)
3. Product Performance (6)
4. Delivery (6)
5. Product Offerings (3)
6. Service (6)
7. Relationship Management (6)
8. Ease of Doing Business (5)
9. Marketing Support (8)
10. Price (7)
11. Value (4)
Figure 5.11 Customer rating of a company’s competitive drivers. This company has been rated low in product quality, brand, and product offerings. These are good drivers to address with a strategy.
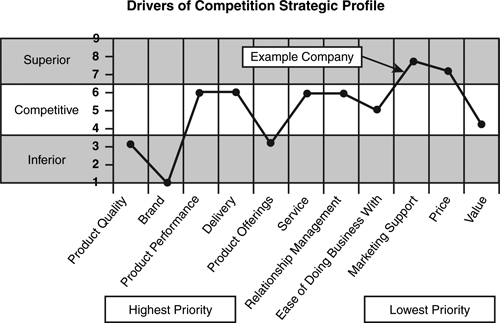
Product quality is the most important requirement the customer has, and the customer rates the example company as a 3 out of 9, or inferior to competition. Even worse, the customer perceives the brand name as totally inferior. In addition, this company’s product offerings are scored low. This analysis, using direct customer feedback, gives the company three clear areas in which to work.
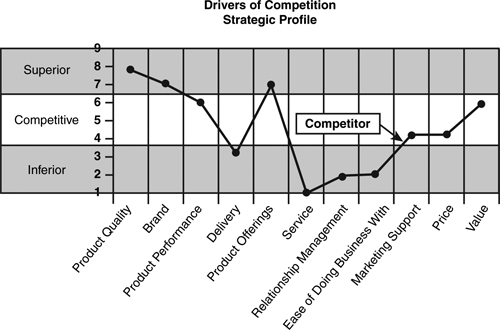
In contrast, Figure 5.12 shows the competition as superior in the top three of five important customer requirements. However, the competition is inferior in several areas including service, relationship management, and ease of doing business with. So, this company has a very clear picture of its external realities, and the next steps are to align a strategy with these realities and to align its internal actions with the strategy.
Figure 5.12 The chart depicts rating on the same competitive drivers for a competitor. Customers rated this competitor low in delivery, service, product offerings, relationship management, ease of doing business, and marketing support.
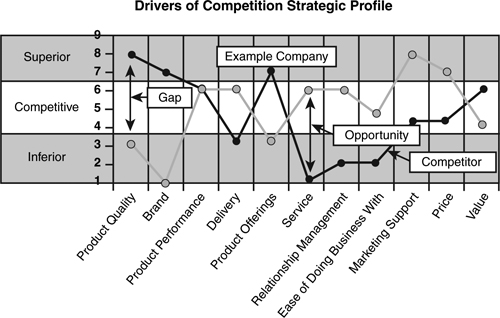
It is time for this company to do a gap analysis. Contrasting the example company to its competition in Figure 5.13, we get a clear picture of the gaps and opportunities the example company has to address. Our company is weak in product quality and strong in customer service. This is useful strategic information.
Figure 5.13 Comparing customer ratings on competitive drivers identifies several gaps between the company and competitors. Some of these gaps will have actions defined that will close those gaps.
Following our strategic planning roadmap of Figure 5.7, now that we have looked at gaps and opportunities against our competitors, we can identify other opportunities.
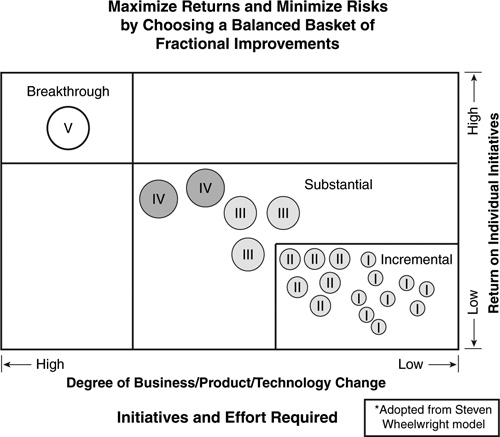
Figure 5.14 shows a potential set of options to consider in your strategic planning. These options are classified according to two categories: (1) The business return on each initiative and (2) Degree of business, product, or technology change. The temptation here is to try to do too many breakthrough initiatives at once. It is better to have a balance of short-, medium-, and long-term initiatives, shown in Figure 5.15, which we will refer to as a balanced basket of fractional improvements.
Figure 5.14 Clusters of breakout opportunities based on gaps in strategic performance.
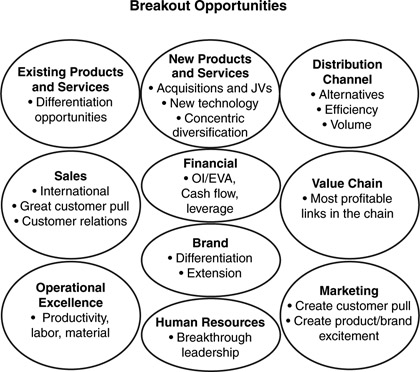
Figure 5.15 Categorizing strategic opportunities by degree of business impact and potential return.
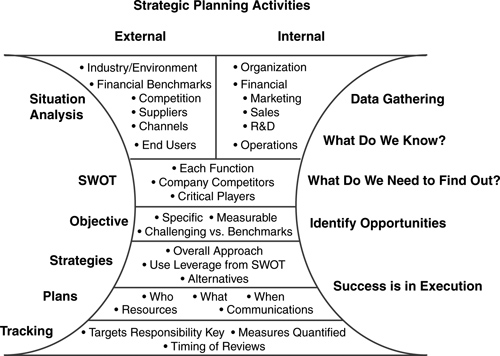
Now that we have funneled down to a set of concise objectives, the strategy deployment plan is how you will achieve the results. The plan and tracking phase is displayed in the roadmap shown in Figure 5.16.
Figure 5.16 Roadmap for activities associated with strategic planning, starting with the external and internal realities and ending with targets, accountability, and review timing.
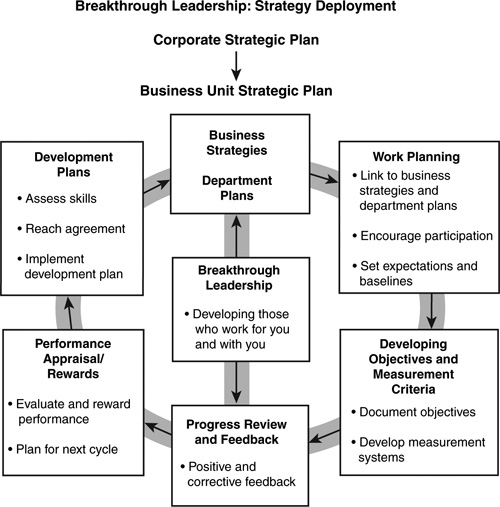
The key to achieving these results is following a strategic deployment plan, which includes communicating the plan, setting performance objectives, and putting in place the infrastructure that will provide support and accountability, as shown in Figure 5.17. This is the process you will use to effectively deploy Six Sigma. Six Sigma must be linked to the strategy deployment plan. The most important box in the Figure 5.17 graphic is “Developing Objectives and Measurement Criteria.” The measurable objectives you define become the Critical Ys that start the top-down project selection process.
Figure 5.17 A model for leading strategic deployment. These activities are key to deploying Six Sigma.
Just as building a solid base business in Horizon 1 is the price of admission to Horizon 2’s growth, the success in Horizon 2 will provide the opportunity for longer-term strategy deployment in Horizon 3, as shown in Figure 5.18.
Figure 5.18 The three horizons of growth are achieved by executing a series of fractional improvements in the right places.
The following chapters will guide you through the process of planning and executing on Horizon 1 and perhaps even initiatives addressing Horizon 2 and 3. The most difficult task of any company is to define a viable strategy and execute it systematically. Deploying Six Sigma and other strategic initiatives will help your company do that. To use the strategy to guide Six Sigma project selection is critical. Figure 5.19 shows how this works.
Figure 5.19 Strategic initiatives linked to Business Critical Ys, project clusters, and projects. Each of the four strategic initiatives would have a similar tree alignment.
Going from the strategic initiatives creates measurable objectives we’ll call Critical Ys. The Critical Ys each create a set of project clusters. The organizations then identify projects for each project cluster. Before you know it, you could have hundreds of projects in progress, each addressing important aspects of executing your strategy. The rest of this book gives you the details on how this happens.