5. Full Content Data
Full content data is the most flexible form of network-based information. It is a rich form of evidence offering detail and opportunities seldom found elsewhere. Once full content data has been acquired, analysts can derive session, alert, and statistical data if necessary. In many cases it is impossible to collect full content data on all services simultaneously. In other cases it is possible, but only when deploying specialized hardware and software. In most cases, it's possible to collect some full content data, even if narrowly focused on a specific protocol or IP address. This chapter shares a few tips on how to collect and interpret that full content data. I have always found examples to be more informative than lists of options, so where appropriate I include examples based on the reference intrusion model presented in Chapter 4. Most of the tool explanations in Part II use the two capture files from Chapter 4, so you can follow along after downloading sf1.lpc and em0.lpc from the book's Web site at http://www.taosecurity.com.
Full content data offers two compelling features that make collecting it worthwhile: granularity and application relevance. Granularity refers to the collection of every nuanced bit in a packet. If an intruder uses a covert channel application like Stegtunnel to communicate using the IP ID or TCP sequence number fields, that information is preserved in full content data.1 Some may argue that collecting packet headers achieves the same goal. What if the intruder embeds commands in a series of TCP options at the end of the TCP header? Will a collection tool catching the first n bytes always grab the relevant information? For this reason I advocate using full content collection, where possible, to save entire packets. I leave summarizing conversations to the discussion of session data in Chapter 7.
The second aspect of full content data, application relevance, refers to saving the information passed above the transport layer. When analysts have access to the data exchanged between applications, a whole new world of investigation is possible. While session data is excellent for recording the fact that a conversation took place, access to the content of that communication is invaluable. When full content application data is unencrypted, it's possible to fully understand the nature of an interaction between two computers. Analysts who once had only packet headers and cared when they saw an odd TCP flag now spend more time looking at an intruder's actions in a Telnet session. Rather than count sequence numbers, they inspect FTP transfers and rebuild the binaries downloaded by suspicious parties.
The tools in this chapter emphasize both aspects of full content data. I'll share how to collect this data, plus how to review it in various forms. I approach this chapter with the hope of finding the best tool for a specific task. These pages address the “core tools” used to collect and examine full content data. Chapter 6 presents supplementary tools that enhance full content data collection and manipulation.
A Note on Software
Assuming you've taken the steps discussed in Chapter 3, you have access to traffic on the wire or in the air. Collection and storage of that traffic is the next step. In this chapter I assume you're working in a UNIX environment, although some of the more popular tools sport Windows versions. The test platform for Part II is FreeBSD 4.9 RELEASE with security fixes applied.
To promote your ability to try these examples, in general I restrict my discussion to versions of tools packaged with FreeBSD 4.9 RELEASE.2 In some cases I opt for an alternative method to install the software. If an application offers a very useful feature or security fix not found in the version packaged with FreeBSD 4.9 RELEASE, I'll add a newer packaged version. If a newer packaged version doesn't exist, I'll build the application using the FreeBSD ports tree. If the application exists only in source code form, I'll build it from source.
Remember that any software that works on FreeBSD is bound to work on Linux. Most will even work on Mac OS X. Don't let the FreeBSD-specific nature of the tool descriptions scare you.
It's easy to date a book by looking at the versions of software it discusses. When reading about the tools, concentrate on the types of data they collect and not the tool's version. I selected each of the applications in Part II to meet a specific NSM need. As certain tools grow in capability, they may render competing applications redundant.
The focus of Part II is on the operational use of NSM tools. I try to give you the information needed to use a tool effectively, but I don't explain every option. One benefit of the UNIX way of doing business is the inclusion of manual pages with most open source software. Once you know the general capabilities of a tool, its manual page closes many knowledge gaps. In some cases I show only one or two uses for an application, although it or a tool packaged with it offers dozen of other features. This is a limitation of the number of pages allotted for this book, so I encourage you to find a tool that looks promising, check its Web site, and read any associated documentation.
In all cases the names shown within less than (<) and greater than (>) symbols, for example, <capfile.lpc>, indicate placeholders for the actual name of a file on your system; delete the < and > symbols and replace the name with one of your own.
Libpcap
Purpose: Packet capture library
Authors: Originally Van Jacobson, Craig Leres, and Steven McCanne
Internet site: http://www.tcpdump.org
FreeBSD installation: Packaged with the base system; port of the newest version available in /usr/ports/net/libpcap
Version demonstrated: libpcap 0.7.2 from the FreeBSD 4.9 RELEASE base system
Packet capture on UNIX systems begins and ends with the packet capture library libpcap. Originally developed by Van Jacobson, Craig Leres, and Steven McCanne at the Lawrence Berkeley National Laboratory, libpcap is now actively maintained by The Tcpdump Group at http://www.tcpdump.org.Libpcap is so ubiquitous almost every network capture tool uses it.
Most UNIX systems package libpcap in their base installation. Our reference FreeBSD 4.9 RELEASE system offers libpcap 0.7.2, a maintenance and bug fix version released on February 27, 2003. At the time of writing, libpcap version 0.8.3 has just been released (on March 30, 2004).3 The best way to begin using the new version is to install the new libpcap port in /usr/ports/net/libpcap.4 This port will install a new version of pcap.h in /usr/local/include/pcap.h. (The pcap.h file included with the base system is found in /usr/include/pcap.h.) Windows users can use the Winpcap library (written by coders from Italy's Politecnico di Torino), which can be found at http://winpcap.polito.it/. A tour of the libpcap source code at http://cvs.tcpdump.org/cgi-bin/cvsweb/libpcap/ shows that The Tcpdump Group is incorporating code from the Politecnico di Torino in modern libpcap distributions.5 The README.Win32 file includes instructions for compiling libpcap in Windows.6
For the purposes of this book, we'll use the libpcap library packaged with FreeBSD 4.9 RELEASE unless specified otherwise. It has the features we need to deploy the other software in Part II. Because libpcap is a library, users do not interact with it directly. Rather, programs that need to read packets call on the library.
Traces captured in binary libpcap format are recognized by using the UNIX file command.
-bash-2.05b$ file em0.lpc sf1.lpc
em0.lpc: tcpdump capture file (little-endian) - version 2.4
(Ethernet, capture length 1515)
sf1.lpc: tcpdump capture file (little-endian) - version 2.4
(Ethernet, capture length 1515)
As noted in Chapter 4, these two files are examined using different tools throughout Part II. They were created by the next tool, Tcpdump.
Tcpdump
Purpose: Packet capture and analysis utility
Author: Multiple
Internet site: http://www.tcpdump.org
FreeBSD installation: Packaged with the base system; port of newest version available in /usr/ports/net/tcpdump
Version demonstrated: Tcpdump 3.7.2 from the FreeBSD 4.9 RELEASE base system
Tcpdump is a packet capture utility deployed with libpcap and maintained by the libpcap developers.7 Both libpcap and Tcpdump undergo very active development, as demonstrated by the frequent posts to the three Tcpdump mailing lists.8 The version of Tcpdump packaged with the base FreeBSD 4.9 RELEASE system is 3.7.2, and a port for Windows called Windump is available from the Winpcap developers. With libpcap as its capture library, I've used Tcpdump on all of the BSDs, Linux, HP-UX, AIX, and Solaris.9
Basic Usage of Tcpdump
Engineers use Tcpdump to capture traffic, and analysts use it to parse and analyze traffic. To capture traffic and send the output to the screen (also known as standard out), use this syntax.
tcpdump –n –i <interface> -s <snaplen>
This syntax includes the following switches.
• –n tells Tcpdump to not resolve IP addresses to domain names and port numbers to service names.
• –i <interface> tells Tcpdump which interface to watch. On FreeBSD, this can be real interfaces like xl0, ed0, fxp0, em0, and so on, as well as pseudo-interfaces like ngeth0, lo0, vlan0, and tap0.Ethernet devices on Linux are usually designated eth0.
• –s <snaplen> tells Tcpdump how much of the packet to record. For Ethernet without VLAN tagging, a value of 1,515 bytes is sufficient.12 Modern versions of Tcpdump accept a snaplen value of 0, meaning “use the required length to catch whole packets.” When capturing traffic on 802.1q VLAN trunks, increase the default snaplen to accommodate the 4 extra bytes introduced by VLAN tags.
By default, modern versions of Tcpdump put the listening interface into promiscuous mode, meaning it will watch everything on the port to which the device is connected. A seldom-used –p switch disables this behavior. Beware that at least one edition of Tcpdump packaged with an older Red Hat release mandated the –p switch for promiscuous behavior.
I consider the use of the –n, –i, and –s switches mandatory. Using them religiously will prevent many problems. I just read a thread on the freebsd-net newsgroup in which a user complained of 40% packet loss. One of the first recommendations was disabling name resolution because the user was sending Tcpdump output to a text file. Specifying an interface with –i will ensure you're sniffing where you expect to sniff. I frequently deploy multi-NIC sensors and take care to record the interface associated with each segment. Finally, if you don't tell Tcpdump a snaplen value, it defaults to collect 68 bytes. With the average IP header being 20 bytes, and the TCP header being 20 bytes without options, only 28 bytes are left for application data. If 20 or more bytes of TCP options are present, hardly any application data might be seen. Nothing is more frustrating than deploying a sensor to log full content data only to find most of the “content” was lost.
On the other hand, capturing full content data is expensive. If you only need headers, don't bother collecting application data. Tcpdump can avoid dropping packets if it doesn't need to record 1,515 bytes for each one.
Using Tcpdump to Store Full Content Data
The syntax previously displayed will just write Tcpdump's interpretation of packets to the screen. The syntax to store packets in libpcap format with Tcpdump is simple, as shown here.
tcpdump –n –i <interface> –s <snaplen> –w <capfile.lpc>
Adding the –w switch sends Tcpdump's output to the specified file. I add the suffix .lpc to indicate a libpcap-formatted file. This is how we captured the data for the intrusion model presented in Chapter 4.
tcpdump –n –i sf1 –s 1515 –w sf1.lpc
tcpdump –n –i em0 –s 1515 –w em0.lpc
When you are running Tcpdump, it will happily continue writing to its specified location until the partition fills. It pays to use some sort of log rotation or file-watching strategy to avoid this fate. I always point Tcpdump and similar programs to a dedicated /nsm partition. If one of my monitoring programs goes astray and fills the partition, it will not affect the rest of the system.
Tcpdump does not have any built-in log-naming convention like Snort does. If I need to start Tcpdump for extended and regular usage, I do so using a small shell script like the following.
#!/bin/sh
DATE='/bin/date "+%Y%m%d-%H%M%S"'
HOSTNAME='hostname'
INTERFACE=ngeth0
SENSOR=172.27.20.3
PREFACE="$DATE.$HOSTNAME.$INTERFACE"
/usr/sbin/tcpdump –n -i $INTERFACE –s 1515 –w $PREFACE.lpc
While this script doesn't monitor for filling partitions, it does produce Tcpdump logs with meaningful names, like 20031228-205003.bourque.taosecurity.com.ngeth0.lpc. This helps me remember where a trace file came from and when it was started.
Some analysts like to see the traffic on the screen as they record it to a file. They advocate using a construct like this:
tcpdump –n –i ngeth0 –s 1515 –l | tee outfile.txt
The –l switch tells Tcpdump to make its output line-buffered, while piping the output to the tee utility sends output to the screen and to the outfile.txt file simultaneously. Although this command will indeed display packets on the screen while writing information to an output file, the outfile.txt file will not be in binary libpcap format. It will be an ASCII copy of everything displayed on the screen. This is better than nothing, but manipulating an ASCII text file is inferior to analyzing libpcap data. To preserve libpcap format, save packets to disk with one instance of Tcpdump and read that capture file with a second instance of Tcpdump.
Using Tcpdump to Read Stored Full Content Data
This section begins an exploration of the traffic captured in Chapter 4. Here and elsewhere we use the files sf1.lpc and em0.lpc to explain the capabilities of various network analysis tools. Because we already know the story behind the reference intrusion, we do not spend time scrutinizing the features of every packet for clues. Rather, we use sf1.lpc and em0.lpc as a common set of packets for exploration of tool usage and function.
Once Tcpdump has captured packets, we can use it to read trace files and see what they contain. Use the –r switch as shown here plus the name of the captured file to see its contents.
bourque# tcpdump -n -r sf1.lpc -c 4
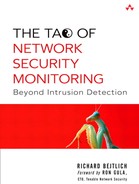
15:20:04.783092 172.27.20.4 > 192.168.60.3: icmp: echo request
15:20:04.783217 172.27.20.4 > 192.168.60.5: icmp: echo request
15:20:04.783322 192.168.60.3 > 172.27.20.4: icmp: echo reply
15:20:04.785244 192.168.60.5 > 172.27.20.4: icmp: echo reply
I added the –c switch to specify showing only four packets. An alternative is to pipe the results through more or less to show a screen's worth of output at a time.
tcpdump –n –r sf1 –r sf1.lpc | less
Since this trace file begins with ICMP, we'll use this protocol to explain Tcpdump's output conventions. Table 5.1 explains the fields in the first ICMP packet shown in sf1.lpc. Because ICMP has no concept of ports, the output is very simple for this example.
Table 5.1. Tcpdump representation of ICMP
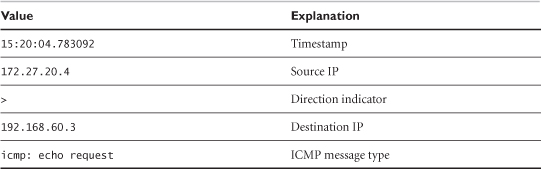
UDP traffic also appears in the trace file and is easy enough to interpret (see Table 5.2).
bourque# tcpdump -n -r sf1.lpc -c 2 udp
15:20:21.140457 172.27.20.4.41197 > 192.168.60.5.24: udp 300
15:46:24.436592 192.168.60.3.32772 > 172.27.20.5.9325: udp 9 (DF)
Table 5.2. Tcpdump representation of UDP
Because Tcpdump doesn't know how to interpret traffic to port 24 UDP, it presents the information we see. Elsewhere in the book we see Tcpdump make some sense of port 53 UDP traffic, because Tcpdump has the ability to decode DNS.
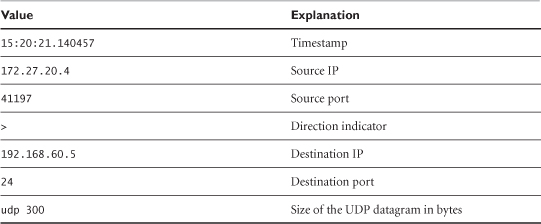
As shown in Table 5.3, TCP is more complicated than ICMP or UDP. (The packet number at the far left of the first output line was added for reference later.)
bourque# tcpdump –n –r em0.lpc –c 8 tcp
1. 16:21:24.174180 192.168.60.3.34720 > 10.10.10.3.3389:
S 2354677536:2354677536(0) win 5840
<mss 1460,sackOK,timestamp 25027249 0,nop,wscale 0> (DF)
Table 5.3. Tcpdump representation of TCP
Table 5.3 breaks down the values in this packet and gives a description for each field as interpreted by Tcpdump.
Packet 1 is the first step in a TCP three-way handshake. The next two steps are listed here (with numbers at the far left again added for reference).
2. 16:21:24.174299 10.10.10.3.3389 > 192.168.60.3.34720:
S 2306427300:2306427300(0) ack 2354677537 win 17520
<mss 1460,nop,wscale 0,nop,nop,timestamp 0 0,nop,nop,sackOK> (DF)
3. 16:21:24.174676 192.168.60.3.34720 > 10.10.10.3.3389:
. ack 2306427301 win 5840 <nop,nop,timestamp 25027249 0> (DF)
Since packets 1 and 2 do not represent the exchange of any application data, the value for the “sequence number of the next byte of application data expected by TCP” for each of those packets is not very interesting. While packet 3 shows ack 2306427301, this doesn't mean any application data has been passed yet. In reality, we say a sequence number was “consumed” by the three-way handshake. In order for the source host, 192.168.60.3, to finish the three-way handshake, it had to consume a TCP sequence number in its acknowledgment of packet 2. Be aware that the presence of the dot (.) in front of the ACK flag does not mean that no flags are set, as some have stated in the past. Rather, the dot means that neither the SYN, FIN, RST, nor PSH flags are set.
On the subject of TCP sequence numbers, the Tcpdump manual page says, “The notation is 'first:last(nbytes)' which means 'sequence numbers first up to but not including last which is nbytes bytes of user data.'” This wording has caused analysts and authors grief for years. Many have been seduced into thinking the value after the colon is the number of the last byte of data in the packet. Wrong! Consider the following packet from em0.lpc, which will make these values clearer. Note that the sequence numbers use relative values, not absolute values.
4. 16:21:24.174801 192.168.60.3.34720 > 10.10.10.3.3389:
P 1:40(39) ack 1 win 5840 <nop,nop,timestamp 25027249 0> (DF)
Here 1:40(39) means the first byte of application data included is byte 1, and the last is actually byte 39. The next byte of application data expected is byte 40. The (39) part means that this packet contains 39 bytes of application data.
The next four sample TCP packets are numbered here for easy reference.
5. 16:21:24.285634 10.10.10.3.3389 > 192.168.60.3.34720:
. ack 40 win 17481 <nop,nop,timestamp 1646230 25027249> (DF)
6. 16:21:24.744926 10.10.10.3.3389 > 192.168.60.3.34720:
P 1:12(11) ack 40 win 17481 <nop,nop,timestamp 1646234
25027249> (DF)
7. 16:21:24.745177 192.168.60.3.34720 > 10.10.10.3.3389:
. ack 12 win 5840 <nop,nop,timestamp 25027306 1646234> (DF)
8. 16:21:24.753419 192.168.60.3.34720 > 10.10.10.3.3389:
P 40:452(412) ack 12 win 5840
<nop,nop,timestamp 25027307 1646234> (DF)
These output lines convey the following information.
• Packet 5 is the acknowledgment that 10.10.10.3 has received 39 bytes of application data and expects to receive byte 40 from 192.168.60.3 next.
• Packet 6 contains 11 bytes of its own application data, starting with byte 1 and ending with byte 11. It will send byte 12 next.
• Packet 7 is the acknowledgment that 192.168.60.3 has received 11 bytes of application data and expects to receive byte 12 from 10.10.10.3 next.
• Packet 8 contains 412 more bytes of application data, starting with byte 40 and ending with byte 451. It will transmit byte 452 next.
By now you should realize that TCP sequence numbers count bytes of application data. They have no direct relationship with the packets themselves. Packets 1, 2, and 3 showed absolute sequence numbers, beginning with 2354677536 for 192.168.60.3. Packets 4 to 8 used relative sequence numbers. Tcpdump uses a sort of shorthand notation once the TCP three-way handshake is completed. This changes the absolute sequence numbers to a shorter relative form. We can show the previous eight packets using absolute values by passing Tcpdump the –S switch, as shown next.
bourque# tcpdump -n -r em0.lpc -S -c 8 tcp
1. 16:21:24.174180 192.168.60.3.34720 > 10.10.10.3.3389:
S 2354677536:2354677536(0) win 5840
<mss 1460,sackOK,timestamp 25027249 0,nop,wscale 0> (DF)
2. 16:21:24.174299 10.10.10.3.3389 > 192.168.60.3.34720:
S 2306427300:2306427300(0) ack 2354677537 win 17520
<mss 1460,nop,wscale 0,nop,nop,timestamp 0 0,nop,nop,sackOK> (DF)
3. 16:21:24.174676 192.168.60.3.34720 > 10.10.10.3.3389:
. ack 2306427301 win 5840 <nop,nop,timestamp 25027249 0> (DF)
4. 16:21:24.174801 192.168.60.3.34720 > 10.10.10.3.3389:
P 2354677537:2354677576(39) ack 2306427301 win 5840
<nop,nop,timestamp 25027249 0> (DF)
5. 16:21:24.285634 10.10.10.3.3389 > 192.168.60.3.34720:
. ack 2354677576 win 17481
<nop,nop,timestamp 1646230 25027249> (DF)
6. 16:21:24.744926 10.10.10.3.3389 > 192.168.60.3.34720:
P 2306427301:2306427312(11) ack 2354677576 win 17481
<nop,nop,timestamp 1646234 25027249> (DF)
7. 16:21:24.745177 192.168.60.3.34720 > 10.10.10.3.3389:
. ack 2306427312 win 5840
<nop,nop,timestamp 25027306 1646234> (DF)
8. 16:21:24.753419 192.168.60.3.34720 > 10.10.10.3.3389:
P 2354677576:2354677988(412) ack 2306427312 win 5840
<nop,nop,timestamp 25027307 1646234> (DF)
Notice how each side displays full ten-digit sequence numbers. Because this can render Tcpdump output more difficult to read, most people omit using the –S flag. To see Ethereal's view of similar sequence numbers, where the actual values are shown in packet contents, see Appendix A.
Timestamps in Stored Full Content Data
When Tcpdump captures packets in libpcap format, it adds a timestamp entry to the record representing each packet in the capture file. So far we've seen Tcpdump's default timestamp format. We can augment that data with the –tttt flag, which adds a date to the timestamp.
bourque# tcpdump -n -r em0.lpc -tttt -c 1 tcp
01/01/2004 21:21:24.174180 192.168.60.3.34720 > 10.10.10.3.3389:
S 2354677536:2354677536(0) win 5840
<mss 1460,sackOK,timestamp 25027249 0,nop,wscale 0> (DF)
Something just happened here—the hour portion of the timestamp increased from 16 to 21 (compared with the earlier output). This five-hour difference is the gap between Eastern Standard Time (EST), where the capture was made, and Coordinated Universal Time (UTC). Keep this in mind when using the –tttt flag. When using Tcpdump without –tttt to show the date, the program reports local time.
Analysts can use the –tt flag to report the number of seconds and microseconds since the UNIX epoch of 00:00:00 UTC on January 1, 1970.
bourque# tcpdump -n -r sf1.lpc -c 1 -tt
1072988404.783092 172.27.20.4 > 192.168.60.3: icmp: echo request
To verify this timestamp, use the date –r command:
bourque# date -r 1072988404
Thu Jan 1 15:20:04 EST 2004
This issue of time is important, so let's see how Tcpdump handles trace files on different systems. In the first example below, we have a trace file of a single packet captured at 14:06 EST. The system displaying the trace is in the same time zone. First we show the date and then the timestamps in default and UNIX formats, and finally we verify the UNIX format with the date command.
-bash-2.05b$ tcpdump -n -r time.lpc
14:06:54.966788 172.27.20.3.22 > 192.168.50.2.18876:
P 2393745530:2393745598(68) ack 4223523782 win 57960 (DF)
-bash-2.05b$ tcpdump -n -r time.lpc -tt
1074539214.966788 172.27.20.3.22 > 192.168.50.2.18876:
P 2393745530:2393745598(68) ack 4223523782 win 57960 (DF)
-bash-2.05b$ date -r 1074539214
Mon Jan 19 14:06:54 EST 2004
On the same system we run Tcpdump with the –tttt flag and see how the timestamp reports UTC.
-bash-2.05b$ tcpdump -n -r time.lpc -tttt
01/19/2004 19:06:54.966788 172.27.20.3.22 > 192.168.50.2.18876:
P 2393745530:2393745598(68) ack 4223523782 win 57960 (DF)
Now we copy the time.lpc trace to a system in the Pacific Standard Time (PST) time zone and run the same commands. Immediately we see the timestamp adjusts to suit the new machine's local PST zone.
[rbejtlich]$ tcpdump -n -r time.lpc
11:06:54.966788 172.27.20.3.22 > 192.168.50.2.18876:
P 2393745530:2393745598(68) ack 4223523782 win 57960 (DF)
However, the UNIX epoch timestamp is constant; 1074539214 seconds have passed since the UNIX epoch, and that isn't affected by time zones.
[rbejtlich]$ tcpdump -n -r time.lpc -tt
1074539214.966788 172.27.20.3.22 > 192.168.50.2.18876:
P 2393745530:2393745598(68) ack 4223523782 win 57960 (DF)
Finally, the –tttt timestamp shows the results in UTC format. This is consistent with the result from the system in the EST zone.
[rbejtlich]$ tcpdump -n -r time.lpc -tttt
01/19/2004 19:06:54.966788 172.27.20.3.22 > 192.168.50.2.18876:
P 2393745530:2393745598(68) ack 4223523782 win 57960 (DF)
When using Tcpdump, always be sure you understand the time differences. If you need to be absolutely sure you understand what's happening, use the –tt option to show seconds and microseconds since the UNIX epoch.
Increased Detail in Tcpdump Full Content Data
Three other flags give more information about the packets Tcpdump records. The –v flag adds increasing levels of verbosity, as shown here.
bourque# tcpdump -n -r em0.lpc -v -c 1 tcp
16:21:24.174180 192.168.60.3.34720 > 10.10.10.3.3389:
S [tcp sum ok] 2354677536:2354677536(0) win 5840
<mss 1460,sackOK,timestamp 25027249 0,nop,wscale 0>
(DF) (ttl 63, id 26001, len 60)
The new switch tells us this TCP segment's checksum is correct. We also get more information from the IP layer, such as the packet's TTL value of 63, IP identification value of 26001, and IP datagram length of 60 bytes.
Occasionally analysts want to see the link-level header (e.g., the Ethernet frame header). Use the –e switch for this.
bourque# tcpdump -n -r em0.lpc -e -c 1 tcp
16:21:24.174180 0:2:b3:a:cd:5b 0:c0:4f:1c:10:2b 0800 74:
192.168.60.3.34720 > 10.10.10.3.3389:
S 2354677536:2354677536(0) win 5840
<mss 1460,sackOK,timestamp 25027249 0,nop,wscale 0> (DF)
We learn that the source MAC address is 00:02:b3:0a:cd:5b and the destination MAC address is 00:c0:4f:1c:10:2b. (Tcpdump truncates unnecessary zeros, but I prefer showing the complete notation.) The next field is the EtherType, where 0800 designates IP traffic. An alternative would be 0806, which is the value for ARP traffic. Next, 74 refers to the frame size. With a 14-byte Ethernet frame header, an IP header of 20 bytes, and a TCP header of 40 bytes, the entire frame is 74 bytes long.
The last commonly used Tcpdump switch is –X, which causes the output to show the packet in hexadecimal notation on the left and ASCII on the right. The following example combines –X with the –e switch to show the link-level header. Note that although we can see the MAC addresses and EtherType in the output, the hexadecimal and ASCII output begins at layer 3 with the IP header value 4 for IP version 4 and 5 for the number of four-byte words in the IP header. These two values are in bold in the output, followed by the representation for the destination port.
bourque# tcpdump -n -r em0.lpc -X -e -c 1 tcp
16:21:24.174180 0:2:b3:a:cd:5b 0:c0:4f:1c:10:2b 0800 74:
192.168.60.3.34720 > 10.10.10.3.3389:
S 2354677536:2354677536(0) win 5840
<mss 1460,sackOK,timestamp 25027249 0,nop,wscale 0> (DF)
0x0000 4500 003c 6591 4000 3f06 c572 c0a8 3c03 E..<e.@.?..r..<.
0x0010 0a0a 0a03 87a0 0d3d 8c59 8720 0000 0000 .......=.Y......
0x0020 a002 16d0 93f8 0000 0204 05b4 0402 080a ................
0x0030 017d e2b1 0000 0000 0103 0300 .}..........
Keep in mind that although the ASCII representation is fairly meaningless here, the hexadecimal values are another form of shorthand for the 0 and 1 bits present in the IP packet. The 0x0d3d shown highlighted is the hexadecimal equivalent of the destination port for this packet. Multiply 0x0d (decimal 13) by 256 and add 0x3d (decimal 61) to get decimal 3389, the destination port.
Tcpdump and Berkeley Packet Filters
Effective use of Tcpdump requires knowledge of ways to focus its attention on the packets that matter. This section shows how to carve out packets of interest in the sf1.lpc and em0.lpc capture files using Berkeley Packet Filters (BPFs). Rather than present a listing of BPF options and leave the reader wondering if he or she implemented them properly, I present sample BPFs and their associated output. The purpose of the examples is to confirm proper BPF usage, not to closely examine the results.
BPFs are expressions that manipulate the sorts of data captured and displayed with Tcpdump. When the CHM Plans engineers in our intrusion scenario (introduced in Chapter 4) deployed Tcpdump, they did not pass any filters on the command line, as shown here.
tcpdump –n –i sf1 –s 1515 –w sf1.lpc
tcpdump –n –i em0 –s 1515 –w em0.lpc
This syntax says “capture everything.” BPFs can be applied at capture time and also at display time. The most common BPF expressions are for IP addresses or netblocks, protocols, and ports. We've already used filters to sample ICMP, UDP, and TCP traffic in the previous section. Here are explanations of those sorts of filters, with examples of each.
This command shows the first two packets of any protocol to or from 172.27.20.3 in sf1.lpc.
bourque# tcpdump -n -r sf1.lpc -c 2 host 172.27.20.3
15:20:44.261338 172.27.20.3.3307 > 192.168.60.5.21:
S 1304523122:1304523122(0) win 57344
<mss 1460,nop,wscale 0,nop,nop,timestamp 32587541 0> (DF)
15:20:44.262223 192.168.60.5.21 > 172.27.20.3.3307:
S 936116459:936116459(0) ack 1304523123 win 32120
<mss 1460,nop,nop,timestamp 24641314 32587541,nop,wscale 0> (DF)
This command displays the first two packets from 172.27.20.4 in sf1.lpc.
bourque# tcpdump -n -r sf1.lpc -c 2 src 172.27.20.4
15:20:04.783092 172.27.20.4 > 192.168.60.3: icmp: echo request
15:20:04.783217 172.27.20.4 > 192.168.60.5: icmp: echo request
The following command shows a functional equivalent that specifies the word “host” before the IP address.
bourque# tcpdump -n -r sf1.lpc -c 2 src host 172.27.20.4
15:20:04.783092 172.27.20.4 > 192.168.60.3: icmp: echo request
15:20:04.783217 172.27.20.4 > 192.168.60.5: icmp: echo request
This next command shows the first two packets to 10.10.10.3 in em0.lpc.
bourque# tcpdump -n -r em0.lpc -c 2 dst 10.10.10.3
16:21:24.174180 192.168.60.3.34720 > 10.10.10.3.3389:
S 2354677536:2354677536(0) win 5840
<mss 1460,sackOK,timestamp 25027249 0,nop,wscale 0> (DF)
16:21:24.174676 192.168.60.3.34720 > 10.10.10.3.3389:
. ack 2306427301 win 5840 <nop,nop,timestamp 25027249 0> (DF)
The following command displays the first two packets from netblock 10.10.10.0/24 in em0.lpc.
bourque# tcpdump -n -r em0.lpc -c 2 src net 10.10.10
16:21:24.174299 10.10.10.3.3389 > 192.168.60.3.34720:
S 2306427300:2306427300(0) ack 2354677537 win 17520
<mss 1460,nop,wscale 0,nop,nop,timestamp 0 0,
nop,nop,sackOK> (DF)
16:21:24.285634 10.10.10.3.3389 > 192.168.60.3.34720:
. ack 40 win 17481 <nop,nop,timestamp 1646230 25027249> (DF)
We can use protocol-based BPF expressions to see various protocols, like TCP, UDP, or ICMP in addition to traffic to or from specific hosts. The following command shows the first two TCP packets in the em0.lpc trace.
bourque# tcpdump -n -r em0.lpc -c 2 tcp
16:21:24.174180 192.168.60.3.34720 > 10.10.10.3.3389:
S 2354677536:2354677536(0) win 5840
<mss 1460,sackOK,timestamp 25027249 0,nop,wscale 0> (DF)
16:21:24.174299 10.10.10.3.3389 > 192.168.60.3.34720:
S 2306427300:2306427300(0) ack 2354677537 win 17520 <mss
1460,nop,wscale 0,nop,nop,timestamp 0 0,nop,nop,sackOK> (DF)
Next, look at the first two packets that are not TCP segments in em0.lpc.
bourque# tcpdump -n -r em0.lpc -c 2 not tcp
16:30:52.246994 192.168.60.3.32775 > 172.27.20.5.9325: udp 9 (DF)
16:31:28.358326 192.168.60.5.1050 > 172.27.20.5.9325: udp 9
Now show the first two ICMP packets in sf1.lpc.
bourque# tcpdump -n -r sf1.lpc -c 2 icmp
15:20:04.783092 172.27.20.4 > 192.168.60.3: icmp: echo request
15:20:04.783217 172.27.20.4 > 192.168.60.5: icmp: echo request
This command displays any packets that are not ICMP, UDP, or TCP in sf1.lpc.
bourque# tcpdump -n -r sf1.lpc not icmp and not udp and not tcp
Since we don't see any results, we know all of the packets in sf1.lpc are either ICMP, UDP, or TCP. To see a specific protocol using its protocol number, use proto <NUMBER>, where <NUMBER> is the decimal number for the protocol of interest, as defined in /etc/protocols. For example, 1 is ICMP, 6 is TCP, and 17 is UDP.
The following command shows the first two TCP packets in sf1.lpc using proto syntax.
bourque# tcpdump -n -r sf1.lpc -c 2 proto 6
15:20:07.945253 172.27.20.4.58173 > 192.168.60.3.21:
S 2986655065:2986655065(0) win 2048
15:20:07.945315 172.27.20.4.58173 > 192.168.60.3.22:
S 2986655065:2986655065(0) win 2048
Some protocols have their own keywords, like ARP. The following command shows the first two packets in em0.lpc that are not ARP. (You won't find any ARP traffic in either capture because I filtered it out before posting the capture files on the Web site.)
bourque# tcpdump -n -r em0.lpc -c 2 not arp
16:21:24.174180 192.168.60.3.34720 > 10.10.10.3.3389:
S 2354677536:2354677536(0) win 5840
<mss 1460,sackOK,timestamp 25027249 0,nop,wscale 0> (DF)
16:21:24.174299 10.10.10.3.3389 > 192.168.60.3.34720:
S 2306427300:2306427300(0) ack 2354677537 win 17520 <mss
1460,nop,wscale 0,nop,nop,timestamp 0 0,nop,nop,sackOK> (DF)
Port-based filters are just as easy to use. For example, to show the first two packets to port 22 TCP in sf1.lpc, use this syntax.
bourque# tcpdump -n -r sf1.lpc -c 2 tcp and dst port 22
15:20:07.945315 172.27.20.4.58173 > 192.168.60.3.22:
S 2986655065:2986655065(0) win 2048
15:20:07.945615 172.27.20.4.58173 > 192.168.60.3.22:
R 2986655066:2986655066(0) win 0
With the following command you can show the first two packets from port 3736 UDP in em0.lpc.
bourque# tcpdump -n -r em0.lpc udp and src port 3736
16:32:14.166455 172.27.20.5.3736 > 192.168.60.3.7983: udp 23
16:32:14.166465 172.27.20.5.3736 > 192.168.60.5.7983: udp 23
Because ICMP doesn't use ports, being specific about the ICMP traffic you'd like to see is a little trickier. For example, the following command shows how to obtain output on the first two ICMP echo request packets in sf1.lpc.
bourque# tcpdump -n -r sf1.lpc -c 2 'icmp[icmptype] = icmp-echo'
15:20:04.783092 172.27.20.4 > 192.168.60.3: icmp: echo request
15:20:04.783217 172.27.20.4 > 192.168.60.5: icmp: echo request
Show the first two ICMP packets that are not ICMP echo requests or replies in sf1.lpc by using this syntax.
bourque# tcpdump -n -r sf1.lpc –c 2 'icmp[icmptype] != icmp-echo
and icmp[icmptype] != icmp-echoreply'
15:20:21.142800 192.168.60.5 > 172.27.20.4: icmp: 192.168.60.5
udp port 24 unreachable [tos 0xc0]
15:37:44.402983 192.168.60.1 > 192.168.60.5: icmp:
host 10.10.10.2 unreachable (DF)
You can get pretty fancy with Tcpdump and BPFs. I've attended and taught classes that spend almost two days on the subject. I think the advent of Snort and its analyst-friendly rule language has practically ended the days of relying on bit-matching BPFs. In this chapter's section on Snort I provide examples of what I mean. I also show how Tethereal can be used to find odd bits set in packets.
You might think these BPFs are neat, but you want to see packets within a certain time frame. I cover that in the section on Tcpslice in Chapter 6.
Tcpdump is my tool of choice for collecting full content data for long-term storage and in-depth analysis. I also use Tcpdump for network troubleshooting and for quick looks at traffic on various sensor, workstation, and server interfaces. Refer to the various titles listed in the Preface for entire books on the subjects of troubleshooting and network health and performance monitoring. For NSM applications, Tcpdump can collect the full content data that is best used to solve detail-oriented cases like those in Chapter 16 or cases that require access to application-layer data like those in Chapter 14.
Tethereal
Purpose: Packet capture and analysis utility
Author: Originally Gerald Combs, with many contributors
Internet site: http://www.ethereal.com
FreeBSD installation: Installed via /usr/ports/net/ethereal
Version demonstrated: 0.10.0a, not version 0.9.14 packaged with FreeBSD 4.9 RELEASE because that version has security flaws listed at http://www.ethereal.com/appnotes/13
Tethereal is similar to Tcpdump in that it relies on libpcap and can both collect and display traffic captures. It's the command-line twin brother of the Ethereal protocol analyzer explained later in this chapter. Tethereal is best used in situations where Ethereal is not available, such as examining a large capture file on a remote sensor in a command-line environment. While Tcpdump can look at the same traffic, Tethereal's extensive range of protocol decoding options makes understanding certain protocols much easier. The program also supports a wider range of collection-friendly options, described next.
Basic Usage of Tethereal
Tethereal is invoked to capture packets and send results to standard output in much the same way as Tcpdump.
tethereal –n –i <interface> -s <snaplen>
Tethereal's default snaplen is 65,535 bytes, the maximum possible value allowed by the IP header. I recommend specifying 1,515 bytes anyway, as with Tcpdump. If you don't know the interfaces available for capture, use Tethereal's –D switch, which lists the interfaces for you.
bourque# tethereal -D
1. em0
2. fxp0
3. ngeth0
4. sf1
5. sf2
6. sf3
7. lo0
Using Tethereal to Store Full Content Data
In its most basic mode, Tethereal can write to a capture file just as Tcpdump does.
tethereal –n –i <interface> -s <snaplen> -w <capfile.lpc>
Whereas Tcpdump leaves file rotation to the engineer, Tethereal offers several very useful features. Combine the –a switch, which specifies a maximum capture size or duration, with the –b switch to trigger ring buffer mode. The –a switch, when used to specify a size, is a measure of kilobytes; when used to specify duration, its value is a number of seconds. The value after –b is the number of files to create.
Two examples will clarify the usage of these features. The first one creates 24 files, each containing one hour's worth of data. The oldest will be overwritten once the 25th hour after the capture begins.
tethereal –n –i <interface> -s <snaplen> -a duration:3600
–b 24 –w <capfile.lpc>
Tethereal will number the files in a sequential fashion, overwriting files as each hour passes. You'll always have the last 24 hours' worth of data, assuming your partition can accommodate the size of each file.
If you prefer to capture files based on size, try the following command to capture ten 10MB (or 10,000 KB) files on a rotating basis.
tethereal –n –i <interface> -s <snaplen> -a filesize:10000
–b 10 –w <capfile.lpc>
Tethereal uses 1,000KB, not 1,024KB, to equal 1MB when it makes its computations of file size. If the –b switch is used with a value of 0, Tethereal will continue writing files until the partition fills.
The second example demonstrates the file structure created when invoking the –a and –b switches to create ten 1MB files.
bourque# tethereal -a filesize:1000 -b 10 -i ngeth0
-w /tmp/tethereal/test.lpc
77 # Here tethereal shows a count of bytes collected.
Using the Cmdwatch utility,14 we can see Tethereal save a number of 1MB files. We see the first nine files as they are written.
Every 5s: ls -al /tmp/tethereal Mon Jan 5 19:32:30 2004
total 8420
drwxr-xr-x 2 root wheel 512 Jan 5 19:32 .
drwxrwxrwt 7 root wheel 1024 Jan 5 19:32 ..
-rw------- 1 1000736 Jan 5 19:31 test_00001_20040105193148.lpc
-rw------- 1 1001274 Jan 5 19:31 test_00002_20040105193153.lpc
-rw------- 1 1000798 Jan 5 19:32 test_00003_20040105193158.lpc
-rw------- 1 1001024 Jan 5 19:32 test_00004_20040105193203.lpc
-rw------- 1 1000064 Jan 5 19:32 test_00005_20040105193207.lpc
-rw------- 1 1000798 Jan 5 19:32 test_00006_20040105193213.lpc
-rw------- 1 1000926 Jan 5 19:32 test_00007_20040105193218.lpc
-rw------- 1 1001304 Jan 5 19:32 test_00008_20040105193223.lpc
-rw------- 1 344064 Jan 5 19:32 test_00009_20040105193228.lpc
Once ten files have been written, Tethereal starts erasing the oldest and adding new files in their place. Already we see that files 1 through 4 are gone:
Every 5s: ls -al /tmp/tethereal Mon Jan 5 19:32:55 2004
total 9300
drwxr-xr-x 2 512 Jan 5 19:32 .
drwxrwxrwt 7 1024 Jan 5 19:32 ..
-rw------- 1 1000064 Jan 5 19:32 test_00005_20040105193207.lpc
-rw------- 1 1000798 Jan 5 19:32 test_00006_20040105193213.lpc
-rw------- 1 1000926 Jan 5 19:32 test_00007_20040105193218.lpc
-rw------- 1 1001304 Jan 5 19:32 test_00008_20040105193223.lpc
-rw------- 1 1001326 Jan 5 19:32 test_00009_20040105193228.lpc
-rw------- 1 1001074 Jan 5 19:32 test_00010_20040105193233.lpc
-rw------- 1 1001112 Jan 5 19:32 test_00011_20040105193238.lpc
-rw------- 1 1000100 Jan 5 19:32 test_00012_20040105193244.lpc
-rw------- 1 1001104 Jan 5 19:32 test_00013_20040105193249.lpc
-rw------- 1 212992 Jan 5 19:32 test_00014_20040105193254.lpc
This sort of behavior, when scaled up to larger capture sizes or used to collect traffic on hourly intervals, is incredibly useful for collecting full content data in an organized manner. You can only use the ring buffer feature to capture libpcap data; Snoop and other formats are not supported.
By default Tethereal stores data in binary libpcap format. If for some reason you wish to store the data in another format, you can specify one of the following formats by passing Tethereal the –F switch plus one of these keywords:
• libpcap: libpcap (Tcpdump, Ethereal, and so on)
• rh6_1libpcap: Red Hat Linux 6.1 libpcap (Tcpdump)
• suse6_3libpcap: SuSE Linux 6.3 libpcap (Tcpdump)
• modlibpcap: modified libpcap (Tcpdump)
• nokialibpcap: Nokia libpcap (Tcpdump)
• lanalyzer: Novell LANalyzer
• ngsniffer: Network Associates Sniffer (DOS-based)
• snoop: Sun Snoop
• netmon1: Microsoft Network Monitor 1.x
• netmon2: Microsoft Network Monitor 2.x
• ngwsniffer_1_1: Network Associates Sniffer (Windows-based) 1.1
• ngwsniffer_2_0: Network Associates Sniffer (Windows-based) 2.00x
• visual: Visual Networks traffic capture
• 5views: Accellent 5Views capture
• niobserverv9 : Network Instruments Observer version 9
The following example saves traffic in the Sun Snoop format. Notice that we pass Tethereal the tcp filter, so it ignores everything but TCP when it saves data.
bourque# tethereal -n -i ngeth0 -s 1515 -F snoop -w test.snoop tcp
10 ^C
bourque# file test.snoop
test.snoop: Snoop capture file - version 2 (Ethernet)
Snoop on Solaris reads the capture file without a problem.
bash-2.03$ snoop -i test.snoop
1 0.00000 pcp02347462pcs.manass01.va.comcast.net ->
freebsd.isc.org FTP C port=16396
2 0.00002 pcp02347462pcs.manass01.va.comcast.net ->
freebsd.isc.org FTP C port=16396
3 0.07572 freebsd.isc.org ->
pcp02347462pcs.manass01.va.comcast.net FTP R port=16396
4 0.00002 freebsd.isc.org ->
pcp02347462pcs.manass01.va.comcast.net FTP R port=16396
Tethereal solves the “capture and watch” conundrum by offering the –S switch. For example, the following syntax sends three TCP packets to the screen and to the file /tmp/tethereal_simultaneous.lpc.
bourque# tethereal -n -i ngeth0 -s 1515 -c 3 -S -w
/tmp/tethereal_simultaneous.lpc tcp
0.000000 68.84.6.72 -> 207.171.166.25 TCP 16512 > 80
[FIN, ACK] Seq=0 Ack=0 Win=16969 Len=0
0.000033 68.84.6.72 -> 207.171.166.25 TCP [TCP Retransmission]
16512 > 80 [FIN, ACK] Seq=0 Ack=0 Win=16969 Len=0
0.072234 207.171.166.25 -> 68.84.6.72 TCP 80 > 16512
[FIN, ACK] Seq=0 Ack=1 Win=8190 Len=0
Using Tethereal to Read Stored Full Content Data
As the text-mode version of the graphical protocol analyzer Ethereal, Tethereal offers a powerful alternative to Tcpdump for decoding packets. Tethereal's output is slightly different than Tcpdump's. Let's use it to look at the same packets seen earlier through the eyes of Tcpdump.
In the following sample ICMP output, notice that displaying the date and time of capture in Tethereal requires the –t ad switch. Tethereal also understands the same BPF syntax used earlier. We cannot use the –c switch because that only applies to collecting live traffic. There is no switch to stop after a specified number of packets when reading from a libpcap trace. By default, Tethereal shows the packet number in the first position of each line. If you've compressed the libpcap trace into .gz format, Tethereal can still read it. This is useful when analyzing archived traces. Notice that Tethereal reports local time when playing traces.
bourque# tethereal -n -t ad -r sf1.lpc icmp
1 2004-01-01 15:20:04.783092 172.27.20.4 -> 192.168.60.3
ICMP Echo (ping) request
2 2004-01-01 15:20:04.783217 172.27.20.4 -> 192.168.60.5
ICMP Echo (ping) request
3 2004-01-01 15:20:04.783322 192.168.60.3 -> 172.27.20.4
ICMP Echo (ping) reply
4 2004-01-01 15:20:04.785244 192.168.60.5 -> 172.27.20.4
ICMP Echo (ping) reply
This ICMP output is as enlightening as the Tcpdump version. Let's see how UDP fares.
bourque# tethereal -n -V -t ad -r sf1.lpc udp
30 2004-01-01 15:20:21.140457 172.27.20.4 -> 192.168.60.5
UDP Source port: 41197 Destination port: 24
36 2004-01-01 15:20:21.142800 192.168.60.5 -> 172.27.20.4
ICMP Destination unreachable
8686 2004-01-01 15:46:24.436592 192.168.60.3 -> 172.27.20.5
UDP Source port: 32772 Destination port: 9325
This is odd. Why do we see an ICMP message in packet 36? Apparently this is the ICMP “destination unreachable” message generated by 192.168.60.5 in response to the UDP packet shown in frame 30. Now let's see how Tethereal handles TCP.
bourque# tethereal -n -t ad -r em0.lpc tcp
1 2004-01-01 16:21:24.174180 192.168.60.3 -> 10.10.10.3
TCP 34720 > 3389 [SYN] Seq=0 Ack=0 Win=5840 Len=0
MSS=1460 TSV=25027249 TSER=0 WS=0
2 2004-01-01 16:21:24.174299 10.10.10.3 -> 192.168.60.3
TCP 3389 > 34720 [SYN, ACK] Seq=0 Ack=1 Win=17520 Len=0
MSS=1460 WS=0 TSV=0 TSER=0
3 2004-01-01 16:21:24.174676 192.168.60.3 -> 10.10.10.3
TCP 34720 > 3389 [ACK] Seq=1 Ack=1 Win=5840 Len=0
TSV=25027249 TSER=0
4 2004-01-01 16:21:24.174801 192.168.60.3 -> 10.10.10.3
TCP 34720 > 3389 [PSH, ACK] Seq=1 Ack=1 Win=5840 Len=39
TSV=25027249 TSER=0
5 2004-01-01 16:21:24.285634 10.10.10.3 -> 192.168.60.3
TCP 3389 > 34720 [ACK] Seq=1 Ack=40 Win=17481 Len=0
TSV=1646230 TSER=25027249
6 2004-01-01 16:21:24.744926 10.10.10.3 -> 192.168.60.3
TCP 3389 > 34720 [PSH, ACK] Seq=1 Ack=40 Win=17481 Len=11
TSV=1646234 TSER=25027249
7 2004-01-01 16:21:24.745177 192.168.60.3 -> 10.10.10.3
TCP 34720 > 3389 [ACK] Seq=40 Ack=12 Win=5840 Len=0
TSV=25027306 TSER=1646234
8 2004-01-01 16:21:24.753419 192.168.60.3 -> 10.10.10.3
TCP 34720 > 3389 [PSH, ACK] Seq=40 Ack=12 Win=5840 Len=412
TSV=25027307 TSER=1646234
Tethereal's structure seems more formal, with many fields taking a “name = value” format. We can correctly assume that TSV means Time Stamp Value, and TSER means Time Stamp Echo Reply. We mentioned these fields in relation to Tcpdump, but here they are easier to understand. Frame 1 shows that 192.168.60.3 sets a timestamp field right away, but 10.10.10.3 doesn't do so until frame 4. In frame 5, 10.10.10.3 shows viaits TSER value that it recognizes the time on 192.168.60.3, and 192.168.60.3 responds in kind in frame 7. This information was included in the Tcpdump trace, but it was slightly more difficult to interpret.
Getting More Information from Tethereal
Tethereal really shines when one needs to peer deep into the contents of packets. Tethereal offers the –x switch to show hexadecimal and ASCII values. (Remember, Tcpdump used a capital X for its switch, –X.) The following listing shows the contents of a TCP packet from 192.168.60.3 to 10.10.10.3. Note that this and similar listings in this section are edited slightly to fit page-width restrictions; the hexadecimal line numbers at the far left were removed.
bourque# tethereal -n -t ad -x -r em0.lpc tcp
...edited...
4 2004-01-01 16:21:24.174801 192.168.60.3 -> 10.10.10.3
TCP 34720 > 3389 [PSH, ACK] Seq=1 Ack=1 Win=5840
Len=39 TSV=25027249 TSER=0
00 c0 4f 1c 10 2b 00 02 b3 0a cd 5b 08 00 45 00 ..O..+.....[..E.
00 5b 65 93 40 00 3f 06 c5 51 c0 a8 3c 03 0a 0a .[e.@.?..Q..<...
0a 03 87 a0 0d 3d 8c 59 87 21 89 79 49 a5 80 18 .....=.Y.!.yI...
16 d0 8b 4e 00 00 01 01 08 0a 01 7d e2 b1 00 00 ...N.......}....
00 00 03 00 00 27 22 e0 00 00 00 00 00 43 6f 6f .....'"......Coo
6b 69 65 3a 20 6d 73 74 73 68 61 73 68 3d 61 64 kie: mstshash=ad
6d 69 6e 69 73 74 72 0d 0a ministr..
Notice the bolded elements. These first 14 bytes comprise the link-level header of the Ethernet frame. You can usually quickly find the beginning of any IP header by scanning for 0x45, which corresponds to IP version 4 and 5 four-byte words of the IP header, totaling 20 bytes. After the 14 bytes of the link-level header, we see the IP header begin as expected with 0x45.
This additional detail is a step in the right direction, but Tethereal's –V switch takes the game to a higher level.
bourque# tethereal -n -t ad -V -r em0.lpc tcp
...edited...
Frame 4 (105 bytes on wire, 105 bytes captured)
Arrival Time: Jan 1, 2004 16:21:24.174801000
Time delta from previous packet: 0.000125000 seconds
Time since reference or first frame: 0.000621000 seconds
Frame Number: 4
Packet Length: 105 bytes
Capture Length: 105 bytes
Ethernet II, Src: 00:02:b3:0a:cd:5b, Dst: 00:c0:4f:1c:10:2b
Destination: 00:c0:4f:1c:10:2b (00:c0:4f:1c:10:2b)
Source: 00:02:b3:0a:cd:5b (00:02:b3:0a:cd:5b)
Type: IP (0x0800)
Internet Protocol, Src Addr: 192.168.60.3 (192.168.60.3),
Dst Addr: 10.10.10.3 (10.10.10.3)
Version: 4
Header length: 20 bytes
Differentiated Services Field: 0x00 (DSCP 0x00: Default;
ECN: 0x00)
0000 00.. = Differentiated Services Codepoint: Default
(0x00)
.... ..0. = ECN-Capable Transport (ECT): 0
.... ...0 = ECN-CE: 0
Total Length: 91
Identification: 0x6593 (26003)
Flags: 0x04
.1.. = Don't fragment: Set
..0. = More fragments: Not set
Fragment offset: 0
Time to live: 63
Protocol: TCP (0x06)
Header checksum: 0xc551 (correct)
Source: 192.168.60.3 (192.168.60.3)
Destination: 10.10.10.3 (10.10.10.3)
Transmission Control Protocol, Src Port: 34720 (34720),
Dst Port: 3389 (3389), Seq: 1, Ack: 1, Len: 39
Source port: 34720 (34720)
Destination port: 3389 (3389)
Sequence number: 1
Next sequence number: 40
Acknowledgement number: 1
Header length: 32 bytes
Flags: 0x0018 (PSH, ACK)
0... .... = Congestion Window Reduced (CWR): Not set
..0. .... = Urgent: Not set
.0.. .... = ECN-Echo: Not set
...1 .... = Acknowledgment: Set
.... 1... = Push: Set
.... .0.. = Reset: Not set
.... ..0. = Syn: Not set
.... ...0 = Fin: Not set
Window size: 5840
Checksum: 0x8b4e (correct)
Options: (12 bytes)
NOP
NOP
Time stamp: tsval 25027249, tsecr 0
Data (39 bytes)
00 c0 4f 1c 10 2b 00 02 b3 0a cd 5b 08 00 45 00 ..O..+.....[..E.
00 5b 65 93 40 00 3f 06 c5 51 c0 a8 3c 03 0a 0a .[e.@.?..Q..<...
0a 03 87 a0 0d 3d 8c 59 87 21 89 79 49 a5 80 18 .....=.Y.!.yI...
16 d0 8b 4e 00 00 01 01 08 0a 01 7d e2 b1 00 00 ...N.......}....
00 00 03 00 00 27 22 e0 00 00 00 00 00 43 6f 6f .....'"......Coo
6b 69 65 3a 20 6d 73 74 73 68 61 73 68 3d 61 64 kie: mstshash=ad
6d 69 6e 69 73 74 72 0d 0a ministr..
We now have a full protocol decode of the packet, with every layer explained in its full glory. Tethereal offers one other hidden gem. If we let it crunch through a capture file, it will produce statistics on the sort of traffic it sees with the –z io,phs switch (phs stands for Protocol Hierarchy Statistics).
bourque# tethereal -n -r sf1.lpc -z io,phs
...edited...
===================================================================
Protocol Hierarchy Statistics
Filter: frame
frame frames:17604 bytes:4946916
eth frames:17604 bytes:4946916
ip frames:17604 bytes:4946916
icmp frames:10 bytes:1004
tcp frames:17580 bytes:4944760
ftp frames:156 bytes:23647
ssh frames:5266 bytes:1052768
unreassembled frames:123 bytes:184822
ftp-data frames:2071 bytes:2992643
data frames:1955 bytes:365422
udp frames:14 bytes:1152
data frames:14 bytes:1152
===================================================================
I've come to appreciate Tethereal's capabilities. The major advantage Tcpdump has appears to be its ubiquity. It's more likely to be installed by default in more UNIX distributions, but Tethereal is available for dozens of platforms at http://www.ethereal.com/download.html.
Snort as Packet Logger
Purpose: Packet capture and analysis utility
Author: Martin Roesch, lead developer
Internet site: http://www.snort.org
FreeBSD installation: Installed via /usr/ports/net/snort
Version demonstrated: 2.1.0
Snort is most famous for being a network-based intrusion detection system, but it can also be used to collect and view packets. Legend has it that Marty Roesch wrote Snort because he wanted a sniffer that would display packet contents more uniformly than other software available in 1998. By default, Snort's output is fairly different from Tcpdump and Tethereal.
Basic Usage of Snort as Packet Logger
If started with the -v switch and told to listen on interface xl0 with –i, as shown in the following output, Snort will display traffic to standard output. The most notable departure from the output of Tcpdump and Tethereal is Snort's tendency to display certain values in hexadecimal format. Watch for that in this section.
janney# snort –v –i xl0
Running in packet dump mode
Log directory = /var/log/snort
Initializing Network Interface xl0
--== Initializing Snort ==--
Initializing Output Plugins!
Decoding Ethernet on interface xl0
--== Initialization Complete ==--
-*> Snort! <*-
Version 2.1.0 (Build 9)
By Martin Roesch ([email protected], www.snort.org)
01/05-22:41:23.877019 192.168.50.2 -> 172.27.20.5
ICMP TTL:126 TOS:0x0 ID:60004 IpLen:20 DgmLen:60
Type:8 Code:0 ID:588 Seq:0 ECHO
=+=+=+=+=+=+=+=+=+=+=+=+=+=+=+=+=+=+=+=+=+=+=+=+=+=+=+=+=+=+=+=+=
01/05-22:41:23.877070 172.27.20.5 -> 192.168.50.2
ICMP TTL:64 TOS:0x0 ID:40429 IpLen:20 DgmLen:60
Type:0 Code:0 ID:588 Seq:0 ECHO REPLY
=+=+=+=+=+=+=+=+=+=+=+=+=+=+=+=+=+=+=+=+=+=+=+=+=+=+=+=+=+=+=+=+=
Snort understands BPF syntax just as Tcpdump and Tethereal do. You limit the number of packets it collects by using the –n switch and use –X to dump headers and application data. In the following command, we use these two switches and also tell Snort to read five packets to or from port 21 TCP or UDP. As was the case with Tethereal, Snort's output has been slightly modified (line numbers were removed) to accommodate page width.
janney# snort -v -X -i xl0 -n 5 port 21
Running in packet dump mode
Log directory = /var/log/snort
Initializing Network Interface xl0
--== Initializing Snort ==--
Initializing Output Plugins!
Decoding Ethernet on interface xl0
--== Initialization Complete ==--
-*> Snort! <*-
Version 2.1.0 (Build 9)
By Martin Roesch ([email protected], www.snort.org)
01/05-22:50:00.827572 192.168.50.2:16859 -> 172.27.20.5:21
TCP TTL:126 TOS:0x0 ID:61227 IpLen:20 DgmLen:48 DF
******S* Seq: 0xAABA1871 Ack: 0x0 Win: 0x4000 TcpLen: 28
TCP Options (4) => MSS: 1260 NOP NOP SackOK
00 10 4B 98 70 71 00 02 B3 0A CD 5B 08 00 45 00 ..K.pq.....[..E.
00 30 EF 2B 40 00 7E 06 5A D1 C0 A8 32 02 AC 1B .0.+@.~.Z...2...
14 05 41 DB 00 15 AA BA 18 71 00 00 00 00 70 02 ..A......q....p.
40 00 8C 00 00 00 02 04 04 EC 01 01 04 02 @.............
=+=+=+=+=+=+=+=+=+=+=+=+=+=+=+=+=+=+=+=+=+=+=+=+=+=+=+=+=+=+=+=+=
01/05-22:50:00.827730 172.27.20.5:21 -> 192.168.50.2:16859
TCP TTL:64 TOS:0x0 ID:41473 IpLen:20 DgmLen:44 DF
***A**S* Seq: 0xB829C716 Ack: 0xAABA1872 Win: 0xE000 TcpLen: 24
TCP Options (1) => MSS: 1460
00 02 B3 0A CD 5B 00 10 4B 98 70 71 08 00 45 00 .....[..K.pq..E.
00 2C A2 01 40 00 40 06 00 00 AC 1B 14 05 C0 A8 .,..@.@.........
32 02 00 15 41 DB B8 29 C7 16 AA BA 18 72 60 12 2...A..).....r`.
E0 00 B2 E9 00 00 02 04 05 B4 ..........
=+=+=+=+=+=+=+=+=+=+=+=+=+=+=+=+=+=+=+=+=+=+=+=+=+=+=+=+=+=+=+=+=
01/05-22:50:00.833212 192.168.50.2:16859 -> 172.27.20.5:21
TCP TTL:126 TOS:0x0 ID:61228 IpLen:20 DgmLen:40 DF
***A**** Seq: 0xAABA1872 Ack: 0xB829C717 Win: 0x44E8 TcpLen: 20
00 10 4B 98 70 71 00 02 B3 0A CD 5B 08 00 45 00 ..K.pq.....[..E.
00 28 EF 2C 40 00 7E 06 5A D8 C0 A8 32 02 AC 1B .(.,@.~.Z...2...
14 05 41 DB 00 15 AA BA 18 72 B8 29 C7 17 50 10 ..A......r.)..P.
44 E8 33 C3 00 00 00 00 00 00 00 00 D.3.........
=+=+=+=+=+=+=+=+=+=+=+=+=+=+=+=+=+=+=+=+=+=+=+=+=+=+=+=+=+=+=+=+=
01/05-22:50:00.848399 172.27.20.5:21 -> 192.168.50.2:16859
TCP TTL:64 TOS:0x10 ID:41477 IpLen:20 DgmLen:103 DF
***AP*** Seq: 0xB829C717 Ack: 0xAABA1872 Win: 0xE268 TcpLen: 20
00 02 B3 0A CD 5B 00 10 4B 98 70 71 08 00 45 10 .....[..K.pq..E.
00 67 A2 05 40 00 40 06 00 00 AC 1B 14 05 C0 A8 .g..@.@.........
32 02 00 15 41 DB B8 29 C7 17 AA BA 18 72 50 18 2...A..).....rP.
E2 68 B3 24 00 00 32 32 30 20 6A 61 6E 6E 65 79 .h.$..220 janney
2E 74 61 6F 73 65 63 75 72 69 74 79 2E 63 6F 6D .taosecurity.com
20 46 54 50 20 73 65 72 76 65 72 20 28 56 65 72 FTP server (Ver
73 69 6F 6E 20 36 2E 30 30 4C 53 29 20 72 65 61 sion 6.00LS) rea
64 79 2E 0D 0A dy...
=+=+=+=+=+=+=+=+=+=+=+=+=+=+=+=+=+=+=+=+=+=+=+=+=+=+=+=+=+=+=+=+=
01/05-22:50:00.987205 192.168.50.2:16859 -> 172.27.20.5:21
TCP TTL:126 TOS:0x0 ID:61242 IpLen:20 DgmLen:40 DF
***A**** Seq: 0xAABA1872 Ack: 0xB829C756 Win: 0x44A9 TcpLen: 20
00 10 4B 98 70 71 00 02 B3 0A CD 5B 08 00 45 00 ..K.pq.....[..E.
00 28 EF 3A 40 00 7E 06 5A CA C0 A8 32 02 AC 1B .(.:@.~.Z...2...
14 05 41 DB 00 15 AA BA 18 72 B8 29 C7 56 50 10 ..A......r.).VP.
44 A9 33 C3 00 00 00 00 00 00 00 00 D.3.........
=+=+=+=+=+=+=+=+=+=+=+=+=+=+=+=+=+=+=+=+=+=+=+=+=+=+=+=+=+=+=+=+=
Run time for packet processing was 2.341 seconds
...edited...
Snort exiting
When Snort exits gracefully, it prints statistics on the traffic seen. Because this trace included five TCP packets captured live, there's not a lot to observe. The highlighted fields in the last packet are an example of Snort's use of hexadecimal values for certain fields. We see the IP type of service, TCP sequence and acknowledgment numbers, and window size all listed by their hexadecimal values. Snort's roots as a security tool cause this behavior. Occasionally it's easier to detect patterns in hexadecimal representations of packet header fields due to the way values are encoded.
Using Snort to Store Full Content Data
Snort can log in two modes: ASCII and binary. Including the –l (lowercase letter l) switch tells Snort to write its output in ASCII form. Using the –b switch tells Snort to use binary (i.e., libpcap) format. I have never personally found a reason to log in ASCII format; it's slow, and it prevents usage of most of the other tools described in Part II. I recommend always logging in binary format. A simple example follows.
janney# snort -i xl0 -b -l /tmp
Snort will create a file in the /tmp directory in the format snort.log.TIMESTAMP, where TIMESTAMP is the start time in the number of seconds that have passed since the UNIX epoch (January 1, 1970). The UNIX date command can convert the timestamp to a human-readable value.
bash-2.05b# file snort.log.1073361971
snort.log.1073361971: tcpdump capture file (little-endian) –
version 2.4 (Ethernet, capture length 1514)
bash-2.05b# date -j -r 1073361971
Mon Jan 5 23:06:11 EST 2004
Passing Snort the –D switch tells it to run as a daemon in the background. Tcpdump and Tethereal can be told to run in the background by appending the ampersand character (&) to the end of their command lines.
Using Snort to Read Stored Full Content Data
Pass Snort a libpcap file to read using the –r switch and it will display what it finds with ease. In the following command we add the –ve switch to tell Snort to act as a sniffer and show link-level headers in the output.
janney# snort -ve -X -r em0.lpc tcp | less
Running in packet dump mode
Log directory = /var/log/snort
TCPDUMP file reading mode.
Reading network traffic from "em0.lpc" file.
snaplen = 1515
--== Initializing Snort ==--
Initializing Output Plugins!
--== Initialization Complete ==--
-*> Snort! <*-
Version 2.1.0 (Build 9)
By Martin Roesch ([email protected], www.snort.org)
01/01-16:21:24.174180 0:2:B3:A:CD:5B -> 0:C0:4F:1C:10:2B
type:0x800 len:0x4A
192.168.60.3:34720 -> 10.10.10.3:3389 TCP TTL:63 TOS:0x0 ID:26001
IpLen:20 DgmLen:60 DF
******S* Seq: 0x8C598720 Ack: 0x0 Win: 0x16D0 TcpLen: 40
TCP Options (5) => MSS: 1460 SackOK TS: 25027249 0 NOP WS: 0
00 C0 4F 1C 10 2B 00 02 B3 0A CD 5B 08 00 45 00 ..O..+.....[..E.
00 3C 65 91 40 00 3F 06 C5 72 C0 A8 3C 03 0A 0A .<e.@.?..r..<...
0A 03 87 A0 0D 3D 8C 59 87 20 00 00 00 00 A0 02 .....=.Y. ......
16 D0 93 F8 00 00 02 04 05 B4 04 02 08 0A 01 7D ...............}
E2 B1 00 00 00 00 01 03 03 00 ..........
=+=+=+=+=+=+=+=+=+=+=+=+=+=+=+=+=+=+=+=+=+=+=+=+=+=+=+=+=+=+=+=+=
In this example we see the MAC addresses in bold, followed by the EtherType and frame length in hexadecimal. Snort's output is compact yet detailed, and very helpful to analysts.
Finding Specific Parts of Packets with Tcpdump, Tethereal, and Snort
Suppose you wanted to find all TCP packets with only the SYN flag set. With Tcpdump, you'd have to know where in the TCP header to look.15 (Appendix A contains a protocol reference for this purpose.) Tcpdump starts counting bytes of header information at byte 0, so the 13th byte contains the TCP flags, as shown here.
If only the SYN flag is set in byte 13, the byte will have the following binary values.
This 00000010 binary value is the same as decimal 2. We can write a special BPF to look at this particular bit inside byte 13. We search for packets to or from 192.168.60.5, as shown here.
bourque# tcpdump -n -r sf1.lpc -c 10 'tcp[13] == 2'
and host 192.168.60.5
1. 15:20:07.982850 172.27.20.4.58173 > 192.168.60.5.21:
S 411816905:411816905(0) win 2048
2. 15:20:07.982889 172.27.20.4.58173 > 192.168.60.5.22:
S 411816905:411816905(0) win 2048
3. 15:20:21.121740 172.27.20.4.41197 > 192.168.60.5.22:
S 9884012:9884012(0) win 4096
4. 15:20:21.121764 172.27.20.4.41197 > 192.168.60.5.24:
S 9884012:9884012(0) win 4096
...truncated...
The filter 'tcp[13] == 2' specifies to look for byte 13 in the TCP header to have value decimal 2, so we see four SYN packets in the first ten packets of trace sf1.lpc. To look for packets with only SYN ACK, we would use 'tcp[13] == 18' because decimal 18 corresponds to binary 00010010. We could also specify the hexadecimal value 0x12, shown next.
bourque# tcpdump -n -r sf1.lpc -c 10 'tcp[13] == 0x12'
15:20:07.945429 192.168.60.3.22 > 172.27.20.4.58173:
S 2769807338:2769807338(0) ack 2986655066 win 5840
<mss 1460> (DF)
15:20:07.984590 192.168.60.5.21 > 172.27.20.4.58173:
S 895499275:895499275(0) ack 411816906 win 32696
<mss 536> (DF)
15:20:07.984837 192.168.60.5.22 > 172.27.20.4.58173:
S 898061893:898061893(0) ack 411816906 win 32696
<mss 536> (DF)
BPF primitives make this a little easier if we substitute tcpflags for 13 in the previous filter.
bourque# tcpdump -n -r sf1.lpc -c 10 'tcp[tcpflags] == 2'
and host 192.168.60.5
15:20:07.982850 172.27.20.4.58173 > 192.168.60.5.21:
S 411816905:411816905(0) win 2048
15:20:07.982889 172.27.20.4.58173 > 192.168.60.5.22:
S 411816905:411816905(0) win 2048
15:20:21.121740 172.27.20.4.41197 > 192.168.60.5.22:
S 9884012:9884012(0) win 4096
15:20:21.121764 172.27.20.4.41197 > 192.168.60.5.24:
S 9884012:9884012(0) win 4096
...truncated...
If we want to see packets that have the SYN flag with any other flags set, we have to be a bit more clever. We combine a logical AND with a bitmask to achieve the required result. (The bitmask process is explained in the Tcpdump manual page.)
bourque# tcpdump -n -r sf1.lpc -c 10 'tcp[13] & 2 == 2'
and host 192.168.60.5
1. 15:20:07.982850 172.27.20.4.58173 > 192.168.60.5.21:
S 411816905:411816905(0) win 2048
2. 15:20:07.982889 172.27.20.4.58173 > 192.168.60.5.22:
S 411816905:411816905(0) win 2048
3. 15:20:07.984590 192.168.60.5.21 > 172.27.20.4.58173:
S 895499275:895499275(0) ack 411816906
win 32696 <mss 536> (DF)
4. 15:20:07.984837 192.168.60.5.22 > 172.27.20.4.58173:
S 898061893:898061893(0) ack 411816906
win 32696 <mss 536> (DF)
5. 15:20:21.121740 172.27.20.4.41197 > 192.168.60.5.22:
S 9884012:9884012(0) win 4096
6. 15:20:21.121764 172.27.20.4.41197 > 192.168.60.5.24:
S 9884012:9884012(0) win 4096
7. 15:20:21.122437 192.168.60.5.22 > 172.27.20.4.41197:
S 909358547:909358547(0) ack 9884013 win 32696 <mss 536> (DF)
8. 15:20:21.140123 172.27.20.4.41204 > 192.168.60.5.22:
SE 862230825:862230825(0) win 4096
<wscale 10,nop,mss 265,timestamp 1061109567 0,eol>
9. 15:20:21.140231 172.27.20.4.41206 > 192.168.60.5.22:
SFP 862230825:862230825(0) win 4096 urg 0
<wscale 10,nop,mss 265,timestamp 1061109567 0,eol>
That filter yields interesting results, namely the SYN ACK flags of packets 3, 4, and 7, plus the odd SYN ECE packet 8 and SYN FIN PSH URG packet 9.
We can again use BPF primitives to make that filter easier to read. We substitute tcpflags for 13 and tcp-syn for the 2 used in the earlier command. Only the first three results are shown, but the SYN ACK of packet 3 indicates that we see packets with SYN and any other flags set.
bourque# tcpdump -n -r sf1.lpc -c 10 'tcp[tcpflags] &
tcp-syn == tcp-syn' and host 192.168.60.5
1. 15:20:07.982850 172.27.20.4.58173 > 192.168.60.5.21:
S 411816905:411816905(0) win 2048
2. 15:20:07.982889 172.27.20.4.58173 > 192.168.60.5.22:
S 411816905:411816905(0) win 2048
3. 15:20:07.984590 192.168.60.5.21 > 172.27.20.4.58173:
S 895499275:895499275(0) ack 411816906 win 32696 <mss 536> (DF)
...truncated...
What if we wanted to look for packets with either the SYN flag set or the ACK flag set, plus any other flags? Try the following command. It says, “Check the TCP flags, and if either the SYN or ACK flags are not equal to zero, match.”
bourque# tcpdump -n -r sf1.lpc -c 10 'tcp[tcpflags] &
(tcp-syn|tcp-ack) !=0' and host 192.168.60.5
15:20:07.982850 172.27.20.4.58173 > 192.168.60.5.21:
S 411816905:411816905(0) win 2048
...edited...
15:20:07.984590 192.168.60.5.21 > 172.27.20.4.58173:
S 895499275:895499275(0) ack 411816906 win 32696 <mss 536> (DF)
...edited...
15:20:21.122672 192.168.60.5.24 > 172.27.20.4.41197:
R 0:0(0) ack 9884013 win 0
15:20:21.140123 172.27.20.4.41204 > 192.168.60.5.22:
SE 862230825:862230825(0) win 4096
<wscale 10,nop,mss 265,timestamp 1061109567 0,eol>
15:20:21.140231 172.27.20.4.41206 > 192.168.60.5.22:
SFP 862230825:862230825(0) win 4096 urg 0
<wscale 10,nop,mss 265,timestamp 1061109567 0,eol>
Here's how to use Tethereal to search for all packets with the SYN flag and any other flags set. Tethereal has a capture filter syntax that uses BPF syntax and its own feature-rich read filter syntax. We can use read filter expressions like tcp.flags.syn to check the status of the single SYN bit in the TCP header. The tcp.flags.syn expression checks to see if the SYN bit is either present (value 1) or not (value 0).
bourque# tethereal -n -r sf1.lpc tcp.flags.syn == 1
5 3.162161 172.27.20.4 -> 192.168.60.3 TCP 58173 > 21
[SYN] Seq=0 Ack=0 Win=2048 Len=0
6 3.162223 172.27.20.4 -> 192.168.60.3 TCP 58173 > 22
[SYN] Seq=0 Ack=0 Win=2048 Len=0
8 3.162337 192.168.60.3 -> 172.27.20.4 TCP 22 > 58173
[SYN, ACK] Seq=0 Ack=1 Win=5840 Len=0 MSS=1460
10 3.199758 172.27.20.4 -> 192.168.60.5 TCP 58173 > 21
[SYN] Seq=0 Ack=0 Win=2048 Len=0
That was easier than the BPF! To show how to use Tethereal's language, here is a check for packets that do not have the SYN flag set.
bourque# tethereal -n -r sf1.lpc tcp.flags.syn == 0
7 3.162245 192.168.60.3 -> 172.27.20.4 TCP [TCP ZeroWindow]
21 > 58173 [RST, ACK] Seq=0 Ack=0 Win=0 Len=0
9 3.162523 172.27.20.4 -> 192.168.60.3 TCP [TCP ZeroWindow]
58173 > 22 [RST] Seq=1 Ack=1525159958 Win=0 Len=0
14 3.201750 172.27.20.4 -> 192.168.60.5 TCP [TCP ZeroWindow]
58173 > 21 [RST] Seq=1 Ack=3399468021 Win=0 Len=0
But what about seeing packets that have only the SYN flag? Unfortunately, we have to again remember the decimal value for the 13th byte when only the SYN flag is set (i.e., decimal 2). Then we can use the following syntax.
bourque# tethereal -n -r sf1.lpc tcp.flags == 2
5 3.162161 172.27.20.4 -> 192.168.60.3 TCP 58173 > 21
[SYN] Seq=0 Ack=0 Win=2048 Len=0
6 3.162223 172.27.20.4 -> 192.168.60.3 TCP 58173 > 22
[SYN] Seq=0 Ack=0 Win=2048 Len=0
10 3.199758 172.27.20.4 -> 192.168.60.5 TCP 58173 > 21
[SYN] Seq=0 Ack=0 Win=2048 Len=0
11 3.199797 172.27.20.4 -> 192.168.60.5 TCP 58173 > 22
[SYN] Seq=0 Ack=0 Win=2048 Len=0
This is getting ridiculous. Surely there must be an easier way to check for these flags. This is where Snort can rescue our sanity. First we'll create the following Snort rule to watch only for packets with the SYN flag set.
alert tcp any any -> any any (msg:"SYN flag only set"; flags: S;)
That is the only line we need in our snort.conf file. Now we run Snort against sf1.lpc to see what it finds.
janney# snort -c /usr/local/etc/snort.conf -b -l . -r ../sf1.lpc
Running in IDS mode
Log directory = .
TCPDUMP file reading mode.
Reading network traffic from "../sf1.lpc" file.
snaplen = 1515
--== Initializing Snort ==--
Initializing Output Plugins!
Initializing Preprocessors!
Initializing Plug-ins!
Parsing Rules file /usr/local/etc/snort.conf
+++++++++++++++++++++++++++++++++++++++++++++++++++
Initializing rule chains...
1 Snort rules read...
1 Option Chains linked into 1 Chain Headers
0 Dynamic rules
+++++++++++++++++++++++++++++++++++++++++++++++++++
+-----------------------[thresholding-config]--------------------
| memory-cap : 1048576 bytes
+-----------------------[thresholding-global]--------------------
| none
+-----------------------[thresholding-local]---------------------
| none
+-----------------------[suppression]----------------------------
| none
-----------------------------------------------------------------
Rule application order: ->activation->dynamic->alert->pass->log
--== Initialization Complete ==--
-*> Snort! <*-
Version 2.1.0 (Build 9)
By Martin Roesch ([email protected], www.snort.org)
Run time for packet processing was 0.134808 seconds
...edited...
Snort exiting
When done, we have two files, alert and snort.log.TIMESTAMP. The alert file is an ASCII representation of packets with only the SYN flag set, as shown here.
[**] [1:0:0] SYN flag only set [**]
[Priority: 0]
01/01-15:20:07.945253 172.27.20.4:58173 -> 192.168.60.3:21
TCP TTL:40 TOS:0x0 ID:33344 IpLen:20 DgmLen:40
******S* Seq: 0xB204BD59 Ack: 0x0 Win: 0x800 TcpLen: 20
[**] [1:0:0] SYN flag only set [**]
[Priority: 0]
01/01-15:20:07.945315 172.27.20.4:58173 -> 192.168.60.3:22
TCP TTL:40 TOS:0x0 ID:38606 IpLen:20 DgmLen:40
******S* Seq: 0xB204BD59 Ack: 0x0 Win: 0x800 TcpLen: 20
[**] [1:0:0] SYN flag only set [**]
[Priority: 0]
01/01-15:20:07.982850 172.27.20.4:58173 -> 192.168.60.5:21
TCP TTL:40 TOS:0x0 ID:55624 IpLen:20 DgmLen:40
******S* Seq: 0x188BD3C9 Ack: 0x0 Win: 0x800 TcpLen: 20
[**] [1:0:0] SYN flag only set [**]
[Priority: 0]
01/01-15:20:07.982889 172.27.20.4:58173 -> 192.168.60.5:22
TCP TTL:40 TOS:0x0 ID:10034 IpLen:20 DgmLen:40
******S* Seq: 0x188BD3C9 Ack: 0x0 Win: 0x800 TcpLen: 20
The snort.log.TIMESTAMP file is the binary record of those same files; Tcpdump can read it if you use the following syntax.
janney# tcpdump -n -r snort.log.1073402357
15:20:07.945253 172.27.20.4.58173 > 192.168.60.3.21:
S 2986655065:2986655065(0) win 2048
15:20:07.945315 172.27.20.4.58173 > 192.168.60.3.22:
S 2986655065:2986655065(0) win 2048
15:20:07.982850 172.27.20.4.58173 > 192.168.60.5.21:
S 411816905:411816905(0) win 2048
15:20:07.982889 172.27.20.4.58173 > 192.168.60.5.22:
S 411816905:411816905(0) win 2048
Snort made finding these SYN-only packets easy. How about SYN plus any other flag? That's simple. Change the rule in the snort.conf file to the following.
alert tcp any any -> any any (msg:"SYN flag and any
others set"; flags: S+;)
Rename the old alert file to alert.old or something similar to avoid confusion, then rerun Snort and check the alert file. It should look similar to this output.
[**] [1:0:0] SYN flag and any others set [**]
[Priority: 0]
01/01-15:20:07.945253 172.27.20.4:58173 -> 192.168.60.3:21
TCP TTL:40 TOS:0x0 ID:33344 IpLen:20 DgmLen:40
******S* Seq: 0xB204BD59 Ack: 0x0 Win: 0x800 TcpLen: 20
[**] [1:0:0] SYN flag and any others set [**]
[Priority: 0]
01/01-15:20:07.945315 172.27.20.4:58173 -> 192.168.60.3:22
TCP TTL:40 TOS:0x0 ID:38606 IpLen:20 DgmLen:40
******S* Seq: 0xB204BD59 Ack: 0x0 Win: 0x800 TcpLen: 20
[**] [1:0:0] SYN flag and any others set [**]
[Priority: 0]
01/01-15:20:07.945429 192.168.60.3:22 -> 172.27.20.4:58173
TCP TTL:64 TOS:0x0 ID:0 IpLen:20 DgmLen:44 DF
***A**S* Seq: 0xA517E7EA Ack: 0xB204BD5A Win: 0x16D0 TcpLen: 24
TCP Options (1) => MSS: 1460
[**] [1:0:0] SYN flag and any others set [**]
[Priority: 0]
01/01-15:20:07.982850 172.27.20.4:58173 -> 192.168.60.5:21
TCP TTL:40 TOS:0x0 ID:55624 IpLen:20 DgmLen:40
******S* Seq: 0x188BD3C9 Ack: 0x0 Win: 0x800 TcpLen: 20
The snort.log.TIMESTAMP file has the binary libpcap versions of these packets. Snort offers unprecedented access to the packet headers using simple keywords, so I recommend using it to find packets of interest like this.
Ethereal
Purpose: Graphical packet capture and analysis utility
Author: Originally Gerald Combs, with many contributors
Internet site: http://www.ethereal.com
FreeBSD installation: Installed via /usr/ports/net/ethereal
Version demonstrated: 0.10.0, not version 0.9.14 packaged with FreeBSD 4.9 RELEASE because that version has security flaws listed at http://www.ethereal.com/appnotes/
We conclude this chapter on full content tools by discussing one of the greatest open source networking tools available: Ethereal. Detail-oriented readers probably observed that most of the Ethereal screenshots that appear in this book were made using the Windows version of Ethereal. This is proof that UNIX can serve as the ultimate capture platform, while Windows can act as an adequate analysis platform.
With an entire book on Ethereal already on the shelves,16 I will lay out the essentials for how I use Ethereal to analyze full content data. I turn to Ethereal when I need to quickly browse through a subset of packets. I never load a trace file bigger than a few megabytes. As we'll see in forthcoming chapters, there are better techniques for analyzing traffic than taking a packet-by-packet approach. Ethereal's strength lies in its decoding ability and its potential for rapid visual comparisons. When hundreds or thousands of megabytes of packets need to be understood, turn to session data as explained in Chapter 7.
Basic Usage of Ethereal
Ethereal can capture packets in real time by using the Capture Options window shown in Figure 5.1. (To access this window, select the Capture→Start menu item.)
Figure 5.1. Telling Ethereal to start capturing packets
Here we tell Ethereal to sniff on the 3Com interface and only capture packets to or from host 10.10.10.2. Note that this BPF syntax is not used in the Filter field at the bottom of the screen (outside the Capture Options window). (I will explain that shortly.) Once the OK button is pushed, packets matching the filter will appear in the windows. If I had entered a value in the File field, Ethereal would have written what it sees to the specified file in libpcap format. Note the options for ring buffers, file capture rotation and size, and promiscuous sniffing as offered by Tethereal.
I never use Ethereal to capture NSM data using this graphical method. I always use Tcpdump, Tethereal, or Snort because it is easier to remotely interface with a system running those programs. I cannot script interaction with Ethereal as I can with the command-line alternatives. When I do run Ethereal to capture traffic, I do so to demonstrate live network traffic in classroom settings.
Using Ethereal to Read Stored Full Content Data
Ethereal can read in a capture file via a command-line invocation, as shown here. Figure 5.2 shows the result in the Ethereal graphical user interface (GUI).
ethereal –n –r em0.lpc
Figure 5.2. Reading a capture file into Ethereal
Ethereal can also open a trace using the standard File→Open sequence loved by GUI fans. We're going to look at the em0.lpc trace and search for evidence of the DDoS attack launched during the reference intrusion model in Chapter 4. Once the trace is loaded, we must use a different filter syntax to focus our analysis efforts. To see traffic to or from port 7793 UDP, for example, use udp.port == 7783 in the Filter field at the bottom of the main window, as shown in Figure 5.3
Figure 5.3. Setting the Ethereal filter on port 7783 UDP
The output displayed in Figure 5.3 shows an odd UDP packet. The content of the application data reads mstream/172.27.20.2/10, followed by 0x0a. This is the command sent from the Mstream DDoS master daemon running on 172.27.20.5 to the Mstream server process running on 192.168.60.3. The second packet in the screen capture is similar, with source IP 172.27.20.5 and destination IP 192.168.60.5. These commands explain why 172.27.20.2 was subjected to a denial-of-service attack.
This sort of detail is possible only when full content data is collected. While we could infer a relationship between 172.27.20.5 and the two systems 192.168.60.3 and .5, we can't positively understand the nature of that relationship without access to the content of their communications. Had the payload of these UDP packets been encrypted, the full content data would have less significance. We would be left guessing about the interaction between these hosts. Once that sort of calculation needs to be made, we could just as easily work with session data.
Table 5.4 shows other examples of filters to try in Ethereal. Note in each example that two equal signs are used in the syntax.
Table 5.4. Sample Ethereal filters
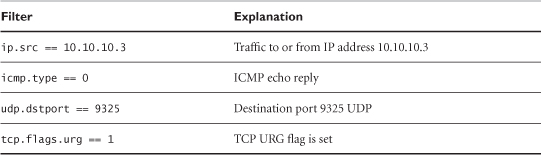
To understand the vast number of Ethereal filters available, browse to Analyze→Display Filters→Add Expression and peruse the choices listed (see Figure 5.4). To eliminate all filters in use, be sure to hit the Reset button at the bottom of the main window.
Figure 5.4. Building Ethereal filter expressions
Once you understand this lingo, you can use Ethereal's Edit→Find Packet sequence to, say, look for the next packet with TCP port 20, as shown in Figure 5.5
Figure 5.5. Finding packets with Ethereal
Ethereal is most useful for displaying all of the pertinent data about a packet in an easy-to-browse form. This is particularly useful for packets with odd headers, like the FIN SYN PSH URG packet shown in Figure 5.6. This combination of flags was caused by an Nmap operating system fingerprint scan. The packet before the displayed entry, with no TCP flags set, is another characteristic Nmap test.
Figure 5.6. A FIN SYN PSH URG packet
This FIN SYN PSH URG packet is an example of the “ground truth” nature of full content data. Only by seeing the original packet can we really understand what it means. Tools to collect session data might be completely fooled by this odd collection of TCP flags. An alert generation application might report seeing the SYN and FIN flags set but ignore the PSH and URG combination. Statistical data collection might report the odd packet in an “other” category but not give details on its nature.
Using Ethereal to Rebuild Sessions
The feature that really excites users who haven't seen Tcpflow (discussed in Chapter 6) is Ethereal's ability to rebuild TCP sessions. Right-click on a packet that belongs to a session of interest and select Follow TCP Stream from the Tools menu. When the process is done, an ASCII representation of the TCP application data will appear, as shown in Figure 5.7.
Figure 5.7. Ethereal stream reconstruction

The session rebuilt in Figure 5.7 depicts the buffer overflow exploit launched by 172.27.20.3 against port 21 TCP on 192.168.60.3 in our reference intrusion scenario. Looking at the very bottom of the screenshot, you'll see that Ethereal has implemented a filter to show only the packets associated with this stream. To return to the “big picture,” hit Reset.
If the stream consists of data suitable for storage in its rebuilt form, such as an FTP data channel, use Save As to save the application content to disk.
Other Ethereal Features
Ethereal sports a few other features that I find useful to NSM practitioners. Just as Tethereal shows statistics with a certain flag combination, Ethereal shows the same with its Analyze→Protocol Hierarchy Statistics sequence (see Figure 5.8).
Figure 5.8. Ethereal protocol hierarchy
Ethereal can also generate a form of session data called a conversation list after reading all of the data available (see Figure 5.9). You can access it by using Analyze→Statistics→ Conversation List. From here, the TCP option is useful.
Figure 5.9. Ethereal TCP conversations
Ethereal is very powerful. My major feature request is integration of application-level session reconstruction. In other words, display an IRC communication, rather than the raw TCP session. For example, a Perl script like Privmsg extracts IRC traffic and prints it in a user-friendly manner.17
A Note on Commercial Full Content Collection Options
Beyond the open source software discussed in this chapter, certain vendors offer commercial packet capture products. These include products from Network Associates, Sandstorm Enterprises, and Niksun. These products sport huge hard drives and custom NICs designed to handle high-traffic loads.
Another option involves deploying probes that support the Remote Monitoring (RMON) Management Information Base (MIB). RMON uses SNMP to transmit statistics, alarms, and even packet captures, hence the mention of RMON in this chapter.18 RMON is an Internet Engineering Task Force (IETF) standard supported by several RFCs, and it still undergoes active development.19 RMON is implemented by two components.
• An RMON probe watches traffic and generates SNMP messages based on what it sees.
• An RMON collector receives the SNMP messages and interprets the results for analysts.
Many routers, such as those made by Cisco, can be configured to generate RMON data. Cisco's documentation claims this sort of data collection puts an unnecessary strain on its products, especially when in packet capture mode. Routers were designed to pass packets, not capture and forward them via SNMP. Some vendors deploy probes dedicated to generate RMON data and consoles to interpret that data.
I do not cover RMON-based full content data collection because no open source RMON probe exists at the time of writing this chapter. A search for “RMON” at SourceForge.net yielded several projects to develop open source RMON probes, but none have released any software. I know of at least several financial institutions that use RMON probes to collect full content data on an irregular basis. Given the lack of open source solutions, from the standpoint of both probes and interfaces, I recommend avoiding RMON as a primary full content data capture solution.
Conclusion
This chapter introduced the core tools for collecting and analyzing full content data. The libpcap library is the most commonly used packet capture library in open source software. Tcpdump is the most popular packet capture tool available, with capture and display capabilities used far and wide. Tethereal offers more features and greater range of packet decodes. Snort can be used as a packet logger as well as a NIDS. Ethereal is the Cadillac of open source protocol analyzers, with features that beat those of commercial competitors. The chapter concluded with a brief discussion of RMON.
This chapter has focused on collection and interpretation. Chapter 6 introduces tools to augment analysis of full content data.