
7. Session Data
Session data represents a summary of a conversation between two parties. It's so important I devote all of Chapter 15 to a case study using this form of information. Here I explain multiple ways to collect session data. Once you see how easy it is to collect and work with it, I expect you will be anxious to try any one of the methods explained here.
A session, also known as a flow, a stream, or a conversation, is a summary of a packet exchange between two systems. Connection-oriented protocols like TCP are most suited to representation in session form because there is usually a clear beginning, middle, and end to a TCP session. Connectionless protocols like UDP and ICMP are not as structured as TCP, but those in request-response format can be approximated in session format as well. Even one-way “conversations,” such as a series of SYN packets sent to multiple hosts during a reconnaissance sweep, can be recognized as a certain type of conversation.
The basic elements of session data include the following:
• Source IP
• Source port
• Destination IP
• Destination port
• Timestamp, generally when the session began
• Measure of the amount of information exchanged during the session
While more detail can be extracted by many of the tools presented in this chapter, these six elements are the core of any session data collection strategy. In the context of this chapter, we care about session data for its ability to track intruder activities in a content-neutral way. Unlike alert data tools (e.g., intrusion detection systems), which rely on triggering a threshold or matching a pattern, session data applications collect everything they see. The ability to track everything, or everything up to the limits of your session application, is invaluable for tracking stealthy intruders.
From a network investigation standpoint, full content data is more valuable than session data. Full content data can be sliced and diced in any number of ways by multiple tools. But because collecting full content data can be nearly impossible on high-traffic links, we turn to session data as the next best approximation of conversations between networked parties. Support for session data collection is built in to many common pieces of networking infrastructure.
Session data has seen more use for accounting and billing purposes, but many analysts are realizing the security aspects of this important form of network audit data, especially as traffic loads increase. Some thoughtful pioneers have been using session data for years to detect intruders. Since the mid-1990s the Air Force Computer Emergency Response Team's (AFCERT) Automated Security Incident Measurement (ASIM) sensors have collected session data. Analysts have queried or manually perused records of exchanges between Air Force systems and the world, finding novel intrusions not detected by ASIM's signature-matching logic. In the late 1990s, Paul Myrick, then an officer in the Air Force Communications Agency, wrote a tool called Profiler to independently collect session data at Air Force bases. In 1993, Carter Bullard, then with Carnegie Mellon, began work on the Audit Record Generation and Utilization System (Argus) program.
There are many ways to use session data on operational networks, but this book focuses on security. We take an even more narrow approach when we use session data to track the activities of intruders. We care about the intruder's IP address and the protocols he or she uses; we don't care so much about the bandwidth the intruder consumed. I present enough information to get the tools running under normal circumstances, and then help decipher their output.
Forms of Session Data
There are two main ways to generate session data. The first method requires collecting full content data or a subset consisting of packet headers. This information is parsed in batch mode (i.e., once collection has ended) to summarize the traffic. In Chapter 5 we saw how Ethereal creates a conversation list by crunching through all of the full content data loaded into memory. This method is used by the two leading commercial full content collection products, Niksun's NetDetector and Sandstorm's NetIntercept.1
This “collect everything, then summarize” method is the most accurate way to generate session data, assuming the collection device gathers all of the traffic needed to reassemble a conversation. Unfortunately, the cost of collecting every packet is often too high. In many environments it's difficult to collect all packets of interest. Keeping up with the traffic load and saving the necessary information to disk can tax most open source and many commercial solutions.
The second way to generate session data recognizes the limitations of the “collect everything, then summarize” approach. This “session first” method listens to network traffic and records conversations in a compact format. Full content data collection is not required when the recording conversation keeps its own records of what it sees. The “session first” method performs better in high-traffic-load environments and is used to monitor various high-speed links, such as the Abilene backbone of Internet2 and the Swiss Education and Research Network (SWITCH).2 “Session first” introduces another trade-off, however. The session data generation tool must see as much traffic as possible and then accurately represent that traffic in flow format.
Within the “session first” method, there are competing ideas of how best to generate flow data. A comprehensive approach watches all packets passing by the flow monitor, summarizing what it sees. Argus and Cisco's NetFlow use this method. NetFlow version 9 is the basis for the IP Flow Information Export (IPFIX) system, a proposed IETF standard flow format.3 Juniper and Foundry Networks routers export NetFlow data as well.4 A sampling-based approach collects a sample of packet headers and interface statistics and forwards them to a centralized server. This centralized server decodes the sampled packet headers and makes flow inferences. InMon Corporation's sFlow uses a sampling-based approach.5 The sFlow standard is supported by Extreme Networks, Foundry Networks, and HP (in its ProCurve line).
Other flow formats are available, albeit less widely adopted. Luca Deri, creator of the nTop traffic profiling system, offers nFlow on his nProbe system and nBox embedded solution.6 Riverstone Networks touts its Lightweight Flow Accounting Protocol (LFAP).7 XACCT Technologies developed the Common Reliable Accounting for Network Element (CRANE) protocol.8 These last two protocols, plus NetFlow and several others, all competed to be the standard supported by IPFIX.9
This chapter cannot discuss all of the forms of session data available. I start with Cisco's NetFlow because of Cisco product ubiquity and the availability of completely open source solutions to produce and parse NetFlow data. I discuss sFlow briefly, but only to demonstrate the code provided by the InMon Corporation. I conclude with products that use their own formats, such as Argus and Tcptrace.
Defining a few terms is necessary to understand session data. First, a probe is a system that is deployed to watch traffic and export session data records. Second, a collector is a product that receives the exported conversations. Third, a console interprets and makes sense of the records. Using the tools presented in this chapter, you will be able to implement each session data analysis component with open source software.
Often throughout this chapter we'll refer to the sf1.lpc and em0.lpc traces captured in Chapter 4. If you want to follow along with the analysis, be sure to download them from the book's Web site.
Cisco's NetFlow
Purpose: Session data protocol
Author: Multiple
Internet site: http://www.cisco.com/go/netflow
FreeBSD installation: Not available
Version demonstrated: NetFlow version 5
Before describing tools to collect and analyze NetFlow records, we should understand NetFlow itself. NetFlow is Cisco's patented method for network accounting.10 Cisco defines a flow as:
a unidirectional stream of packets between a given source and destination—both defined by a network-layer IP address and transport-layer source and destination port numbers. Specifically, a flow is identified as the combination of the following seven key fields:
• Source IP address
• Destination IP address
• Source port number
• Destination port number
• Layer 3 protocol type
• Type of Service byte
• Input logical interface (ifIndex)11
Because NetFlow builds session data in a unidirectional manner, most sessions are represented as a flow from the client to the server and as a flow from the server to the client. Argus, described later in this chapter, offers the advantage of characterizing flows in a bidirectional manner. NetFlow is usually available on Cisco routers running a variety of IOS 12.x releases; Argus must run on a stand-alone platform with visibility to network traffic. NetFlow is becoming increasingly popular. Richard Blundell started NetFlowGuide.com in December 2003, providing advice on building an open source interface for NetFlow data.
In addition to Cisco routers, certain Juniper and Foundry Networks devices export NetFlow data.12 InMon's sFlow Probe produces both sFlow data and NetFlow records. A completely open source NetFlow record generator called Fprobe (covered later in this chapter) can also be deployed on generic UNIX monitoring platforms.
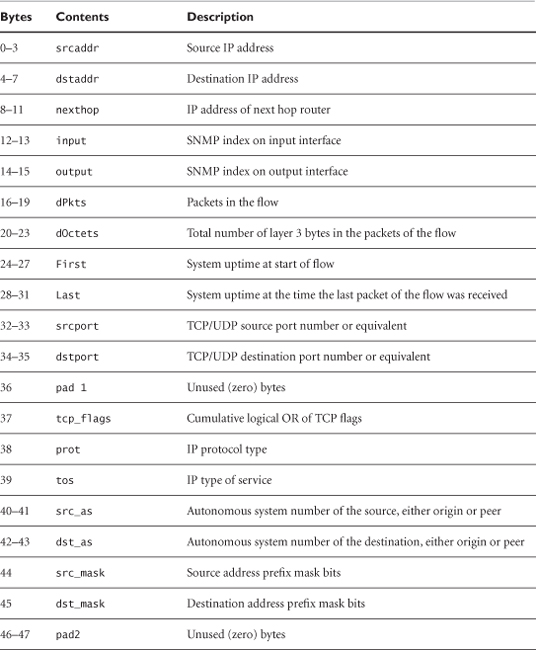
There are several versions of NetFlow records, including versions 1, 5, 7, 8, and 9. This chapter demonstrates version 5 because that is supported by common equipment and is read by the open source tools explained in this chapter. Tables 7.1 and 7.2 list the components of the NetFlow version 5 header and flow record.13 This gives an idea of the sort of information available through NetFlow.
Table 7.1. NetFlow version 5 flow format
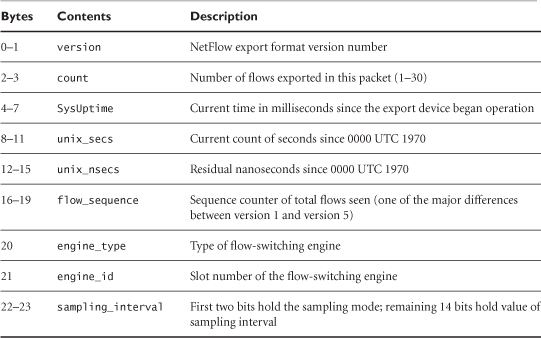
Table 7.2. NetFlow version 5 header format
Cisco routers act as probes. They watch packets on one or more interfaces and export NetFlow data to a collector. Configuring a Cisco router to export NetFlow is fairly simple. In the following listing we configure a router gill to send NetFlow version 5 records to an NSM sensor on port 9995 UDP at 172.27.20.3.14 We configure NetFlow for interface FastEthernet 0/0, which is the interface closest to the Internet. FastEthernet 0/1 is closest to the internal network.15
gill#show version
Cisco Internetwork Operating System Software
IOS (tm) C2600 Software (C2600-IK9S-M), Version 12.2(11)T10,
RELEASE SOFTWARE (fc3)
TAC Support: http://www.cisco.com/tac
Copyright (c) 1986-2003 by cisco Systems, Inc.
Compiled Sat 25-Oct-03 21:38 by eaarmas
Image text-base: 0x8000809C, data-base: 0x817E2F0C
ROM: System Bootstrap, Version 12.2(7r) [cmong 7r],
RELEASE SOFTWARE (fc1)
gill uptime is 3 weeks, 3 days, 5 hours, 23 minutes
System returned to ROM by power-on
System image file is "flash:c2600-ik9s-mz.122-11.T10.bin"
cisco 2651XM (MPC860P) processor (revision 0x100) with
60416K/5120K bytes of memory.
Processor board ID JAE071601DV (2514262155)
M860 processor: part number 5, mask 2
Bridging software.
X.25 software, Version 3.0.0.
2 FastEthernet/IEEE 802.3 interface(s)
32K bytes of non-volatile configuration memory.
16384K bytes of processor board System flash (Read/Write)
Configuration register is 0x2102
gill#configure terminal
Enter configuration commands, one per line. End with CNTL/Z.
gill(config)#interface fa0/0
gill(config-if)#ip route-cache flow
gill(config-if)#exit
gill(config)#ip flow-export destination 172.27.20.3 9995
gill(config)#ip flow-export version 5
gill(config)#exit
gill#
3w3d: %SYS-5-CONFIG_I: Configured from console by console
Once the sensor has been exporting NetFlow records for a while, we can check the statistics to see how the sensor is performing.
gill#show ip flow export
Flow export v5 is enabled for main cache
Exporting flows to 172.27.20.3 (9995)
Exporting using source IP address 192.168.40.2
Version 5 flow records
241506 flows exported in 75097 udp datagrams
0 flows failed due to lack of export packet
36404 export packets were sent up to process level
0 export packets were dropped due to no fib
0 export packets were dropped due to adjacency issues
0 export packets were dropped due to fragmentation failures
0 export packets were dropped due to encapsulation fixup
failures
Figure 7.1 shows information available via the show ip cache flow command, including packet size distribution, protocols seen, and the four flows active at the time the command was run.
Figure 7.1. Results of the show IP cache flow command on a Cisco router
Once the router starts exporting flows, we can confirm them with Tcpdump as demonstrated here.
bourque# tcpdump -n -i fxp0 -X -s 1515 port 9995
tcpdump: listening on fxp0
15:52:59.374089 192.168.40.2.52903 > 172.27.20.3.9995: udp 120
0x0000 4500 0094 56bd 0000 fd11 bdd2 c0a8 2802 E...V.........(.
0x0010 ac1b 1403 cea7 270b 0080 f0ff 0005 0002 ......'.........
0x0020 7cd2 d9af 2bb1 4670 3779 3c82 0003 af75 |...+.Fp7y<....u
0x0030 0000 0000 4456 da8b 4454 0648 0000 0000 ....DV..DT.H....
0x0040 0001 0000 0000 0001 0000 005c 7cd2 9e9a ...........|...
0x0050 7cd2 9e9a 0000 0800 0e10 0100 0000 0000 |...............
0x0060 0000 96cf 42c0 0005 4454 0648 0000 0000 ....B...DT.H....
0x0070 0001 0000 0000 0002 0000 0050 7cd2 ec03 ...........P|...
0x0080 7cd2 ec03 01bb 6ae7 d311 0600 0000 0000 |.....j.........
0x0090 0000 8fa7 ....
Now that we know how to export Cisco NetFlow data from a router acting as a probe, we have to deploy a collector that can process those records. I don't want to disappoint those of you who don't have Cisco routers, however. Before talking about how to handle NetFlow data, let's look at Fprobe.
Fprobe
Author: Slava Astashonok
Internet site: http://fprobe.sourceforge.net/
FreeBSD installation: Installed via /usr/ports/net/fprobe
Version demonstrated: 1.0.4
Fprobe allows a stand-alone NSM platform to export NetFlow records just as a Cisco router would. Installed on a server, the application listens for traffic and generates NetFlow records based on what it sees. Fprobe is a good alternative for analysts who want to create NetFlow data without adding to the processing load of their routers or whose routers don't support NetFlow due to lack of memory or an old Cisco IOS version.
The following command tells Fprobe to listen on the ngeth0 monitoring interface and export NetFlow data to a collector on port 2055 UDP at 172.27.20.3.
/usr/local/bin/fprobe -i ngeth0 –f ip 172.27.20.3:2055
The default export format is NetFlow version 5, although Fprobe also supports versions 1, 5, and 7. The –f ip switch tells Fprobe to use the BPF ip as a filter. Although the –f switch is optional, the Fprobe manual page advocates its use. In the configuration I use, I have Fprobe run on the NSM platform and export NetFlow data to a collector also running on the NSM platform.
When exchanging e-mail with the Fprobe author, I learned that he has started a new project called Flow Agent, located at http://sourceforge.net/projects/flag. At that site he describes Flow Agent as “a modular network flow agent to capture traffic via various methods (libpcap, ulog, etc.) and export accumulated information in various ways (NetFlow, IPFIX, sFlow, etc).”
Ng_netflow
Author: Gleb Smirnof
Internet site: http://sourceforge.net/projects/ng-netflow
FreeBSD installation: Installed via /usr/ports/net/ng_netflow
Version demonstrated: 0.2.1
While visiting SourceForge.net, I queried for NetFlow and found ng_netflow, a netgraph-based loadable kernel module for FreeBSD.16 (The project name is ng-netflow, and the kernel module is called ng_netflow.) The author warns that this early version is for demonstration only because the method ng_netflow uses to time out flow records can be extremely slow. With ng_netflow in the kernel, however, this method has the possibility for being much faster than user-space implementations like Fprobe.
As I installed the port I received the following messages.
bourque:/usr/ports/net/ng_netflow# make install
===> Installing for ng_netflow-0.2.1
===> Generating temporary packing list
===> Checking if net/ng_netflow already installed
===> ng_netflow
install -o root -g wheel -m 555 ng_netflow.ko /modules
===> flowctl
install -s -o root -g wheel -m 555 flowctl /usr/local/sbin
install -o root -g wheel -m 444 ng_netflow.4.gz
/usr/local/man/man4
install -o root -g wheel -m 444 flowctl.8.gz /usr/local/man/man8
*****************************************************************
This port contains a prebuilt kernel module. Due to the ever
changing nature of FreeBSD it may be necessary to rebuild the
module after a kernel source update. To do this reinstall
the port.
*****************************************************************
This message means that recompiling the FreeBSD kernel might require reinstalling the ng_netflow port. This involves changing to the /usr/ports/net/ng_netflow directory and running make deinstall followed by make reinstall.
I tested ng_netflow on a FreeBSD 4.9 STABLE system named janney, with IP address 172.27.20.5. To enable the kernel module, I used the following syntax. Interface em0 is the interface that will listen for traffic to be represented as NetFlow data, and 172.27.20.3 is the NetFlow collector, bourque.17
janney# kldload ng_ether
janney# kldload ng_tee
janney# kldload ng_netflow
janney# ngctl -f - << EOF
? mkpeer em0: tee lower right
? connect em0: em0:lower upper left
? mkpeer em0:lower netflow right2left iface0
? name em0:lower.right2left netflow
? msg netflow: setifindex { iface=0 index=1 }
? mkpeer netflow: ksocket export inet/dgram/udp
? msg netflow:export connect inet/172.27.20.3:4444
? EOF
I then checked the status of the ng_netflow kernel module with the following command.
janney# flowctl netflow show
SrcIf SrcIPaddress DstIf DstIPaddress Pr SrcP DstP Pkts
em0 192.168.1.2 em0 192.168.1.1 6 03f8 006f 5
These results show flows between 192.168.1.1 and 192.168.1.2. These are the IP addresses in the lab system for which monitoring interface em0 on janney has visibility. Once enabled and once traffic is flowing past the em0 interface on janney, the ng_netflow probe emits NetFlow records to the collector. I verified this with Tcpdump on the collector, bourque.
bourque# tcpdump -n -s 1515 -i fxp0 -X port 4444
tcpdump: listening on fxp0
08:15:08.271115 172.27.20.5.1064 > 172.27.20.3.4444: udp 72
0x0000 4500 0064 0842 0000 4011 f208 ac1b 1405 E..d.B..@.......
0x0010 ac1b 1403 0428 115c 0050 f86c 0005 0001 .....(..P.l....
0x0020 0000 03c5 3ffe a98c 0004 df9c 0000 0000 ....?...........
0x0030 0000 0000 c0a8 0102 c0a8 0101 0000 0000 ................
0x0040 0001 0001 0000 0001 0000 0054 0000 03b2 ...........T....
0x0050 0000 03b2 0000 0000 0000 0100 0000 0000 ................
0x0060 1818 0000 ....
As you can see, janney (172.27.20.5) is emitting NetFlow records to port 4444 UDP on 172.27.20.3.
Besides Fprobe and the new ng_netflow loadable kernel module, other open source NetFlow probes include the following:
• Softflowd (http://mindrot.org/softflowd.html) for OpenBSD and Linux
• Pfflowd (http://mindrot.org/pfflowd.html), which relies on OpenBSD's Pf firewall
• Ntop (http://www.ntop.org), which can act as both NetFlow probe and collector
Now that we've seen three options for NetFlow probes—one using Cisco routers, one using the open source Fprobe tool, and one using the kernel module ng_netflow—we can see what NetFlow records look like. For that we turn to another set of open source applications: Flow-tools.18
Flow-tools
Purpose: NetFlow collector and processing tool
Authors: Mark Fullmer and contributors
Internet site: http://www.splintered.net/sw/flow-tools/
FreeBSD installation: Installed via package
Version demonstrated: 0.66
So far we've figured out two ways to generate NetFlow records. With Flow-tools, we finally have a way to collect those records. Flow-tools consists of a collection of applications for collecting and processing NetFlow data. Cisco and other vendors sell commercial applications to process NetFlow records, but I prefer presenting open source solutions in this book. Flow-tools is not a lightweight set of toys in search of a commercial replacement. These tools are used to collect NetFlow records from the Abilene backbone of Internet2.
Flow-capture
The Flow-capture program is a NetFlow collector program with advanced file management capabilities. We can use it to gather and store records from Cisco router and Fprobe NetFlow probes. Flow-capture's syntax involves specifying a location to store the NetFlow records via the –w switch, followed by a list in this format: local_IP/remote_IP/UDP_port.
The local_IP element determines the IP address on which Flow-capture will listen. Entering 0 means listen on all interfaces. The remote_IP element restricts Flow-capture to accepting NetFlow exports only from the specified IP address. Entering 0 means Flow-capture will accept records from any sender. UDP_port is self-explanatory.
Two examples clarify the use of Flow-capture. In the first example, the following command collects NetFlow data generated by our Fprobe implementation on the 172.27.20.3 sensor.
flow-capture –w /nsm/netflow/fprobe/external
172.27.20.3/172.27.20.3/2055
Now let's look at a collection of the Cisco router's NetFlow records. Although the router is collecting information from the external, Internet-facing Fa0/0 interface, it is exporting this data by using the 192.168.40.2 interface. You can verify this by inspecting this snippet of output from the show ip flow export command shown earlier in the chapter.
Exporting using source IP address 192.168.40.2
In the second example, the following command collects NetFlow data generated by the Cisco router with internal IP address 192.168.40.2.
flow-capture -w /nsm/netflow/router/external
172.27.20.3/192.168.40.2/9995
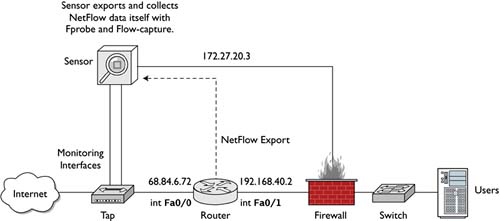
Figure 7.2 shows the router, Fprobe, and Flow-capture components at work. Deployed this way, they provide fairly redundant coverage of traffic as it approaches the external router interface.
Figure 7.2. Sample NetFlow deployment
To collect records exported from the ng_netflow kernel module mentioned earlier, we could use the following syntax. This is not depicted in the diagram, but I include the syntax to satisfy your curiosity.
flow-capture -w /nsm/netflow/ng_netflow/test/ 0/0/4444
Let's say we did not have any NetFlow probes or collectors listening when the CHM Plans scenario (see Chapter 4) occurred. We do have the sf1.lpc and em0.lpc libpcap traces to analyze. This is where Tcpreplay comes to the rescue. We will set up a single-box traffic replay system (janney, 172.27.20.5) to retransmit and process the data in sf1.lpc and em0.lpc.
• Tcpreplay will retransmit sf1.lpc and em0.lpc to the tap0 interface.
• Fprobe will listen on tap0 for traffic and export NetFlow records.
• Flow-capture will accept NetFlow records from Fprobe.
First we set up a tap0 interface as described in the Tcpreplay section in Chapter 6. Next, we start a new instance of Flow-capture on the sensor, dedicated to the new Tcpreplay process. I recommend creating one instance for each trace because they see different vantage points. Remember to make suitable directories to contain the NetFlow records stored by Flow-capture.
janney# mkdir -p /nsm/netflow/fprobe/chm_sf1
janney# mkdir -p /nsm/netflow/fprobe/chm_em0
janney# flow-capture -w /nsm/netflow/fprobe/chm_sf1/ 0/0/7777
janney# flow-capture -w /nsm/netflow/fprobe/chm_em0/ 0/0/8888
Now we create the Fprobe process to listen on tap0 for traffic. The following one listens for the traffic from sf1.lpc that we will soon transmit with Tcpreplay.
janney# fprobe -i tap0 -f ip 172.27.20.5:7777
Finally, we tell Tcpreplay to send the sf1.lpc file. This will take as much time as the original scenario, unless we tell Tcpreplay to speed up its actions.19 The sf1.lpc file lasts for over 4,329 seconds, or over 72 minutes, at normal speed. A multiplier of 10 reduces the replay time to just over 7 minutes.
janney# tcpreplay -i tap0 sf1.lpc
sending on tap0
17604 packets (4946916 bytes) sent in 4329.40 seconds
1142.6 bytes/sec 0.01 megabits/sec 4 packets/sec
366 write attempts failed from full buffers and were repeated
The output above shows 366 write attempts failed and were repeated, even at normal speed. Keep this in mind when using multipliers to shorten processing time.
Flow-capture creates files in the specified directory. These session records bear names associated with the date and time when you are following these instructions; the original dates and times are not used. In its default mode, Flow-capture creates new flows every 15 minutes. The ft files are closed flow records, while the tmp file is the current, open record. It is essentially empty because there is no other data arriving via Fprobe and Tcpreplay.
janney# ls –l /nsm/netflow/fprobe/chm_sf1/2004/2004-01/2004-01-09
total 24
-rw-r--r-- 1 1071 Jan 9 17:45 ft-v05.2004-01-09.173434-0500
-rw-r--r-- 1 638 Jan 9 18:00 ft-v05.2004-01-09.174501-0500
-rw-r--r-- 1 720 Jan 9 18:15 ft-v05.2004-01-09.180001-0500
-rw-r--r-- 1 8579 Jan 9 18:30 ft-v05.2004-01-09.181501-0500
-rw-r--r-- 1 444 Jan 9 18:45 ft-v05.2004-01-09.183001-0500
-rw-r--r-- 1 100 Jan 9 18:45 tmp-v05.2004-01-09.184501-0500
When Tcpreplay reports it is done, we kill the first Fprobe process and start a new one to accommodate em0.lpc. In the example here, we see Fprobe is running as process ID (PID) 1007, which we kill.
janney# ps -auxww | grep fprobe
root 1007 1.5 1.2 6876 6248 ?? Ss 5:33PM 1:38.10
fprobe -i tap0 -f ip 172.27.20.5:7777
root 823 0.0 0.3 2096 1540 ?? Ss 5:31PM 0:00.21
flow-capture -w /nsm/netflow/fprobe/chm_sf1/ 0/0/7777
root 825 0.0 0.2 1448 896 ?? Ss 5:32PM 0:00.15
flow-capture -w /nsm/netflow/fprobe/chm_em0/ 0/0/8888
root 5527 0.0 0.0 304 156 p0 R+ 6:48PM 0:00.00
grep fprobe
janney# kill 1007
We start a new instance of Fprobe listening on tap0 and sending NetFlow records to port 8888 UDP on the 172.27.20.5 system (janney).
janney# fprobe -i tap0 -f ip 172.27.20.5:8888
janney# tcpreplay -i tap0 /home/richard/em0.lpc
sending on tap0
1136 packets (160785 bytes) sent in 650.10 seconds
247.4 bytes/sec 0.00 megabits/sec 1 packets/sec
The second trace, em0.lpc, lasted slightly less than 11 minutes. Fprobe has no more data to process once Tcpreplay is done, so we can safely kill it.
janney# ps -auxww | grep fprobe
root 5529 1.5 1.2 6876 6232 ?? Ss 6:48PM 2:02.42
fprobe -i tap0 -f ip 172.27.20.5:8888
root 7852 0.0 0.0 304 156 p1 R+ 8:22PM 0:00.00
grep fprobe
janney# kill 5529
The Flow-capture files look like the following. The first two files contain data of interest, while the third is essentially an empty file.
janney# ls –l /nsm/netflow/fprobe/chm_em0/2004/2004-01/2004-01-09
total 10
-rw-r--r-- 1 582 Jan 9 19:00 ft-v05.2004-01-09.185031-0500
-rw-r--r-- 1 187 Jan 9 19:15 ft-v05.2004-01-09.190001-0500
-rw-r--r-- 1 100 Jan 9 19:15 tmp-v05.2004-01-09.191501-0500
Once we've given Flow-capture enough time to write the last ft file containing Tcpreplay data, we can kill all instances of Flow-capture.
janney# ps -auxww | grep flow-capture
root 823 0.0 0.3 2096 1540 ?? Ss 5:31PM 0:00.41
flow-capture -w /nsm/netflow/fprobe/chm_sf1/ 0/0/7777
root 825 0.0 0.3 2096 1532 ?? Ss 5:32PM 0:00.34
flow-capture -w /nsm/netflow/fprobe/chm_em0/ 0/0/8888
root 7845 0.0 0.0 304 156 p1 R+ 8:22PM 0:00.00
grep flow-capture
janney# kill 823 825
In the example we didn't care about properly flushing any remaining data from Flow-capture because we waited long enough for the pertinent data to be written into the permanent ft files. If you're not sure that your flows have been written to disk, use the kill –QUIT <PID> command rather than a generic kill <PID> command to stop Flow-capture.
Thanks to Flow-capture, we have NetFlow records to review. Let's take a look at them with two other applications included with Flow-tools.
Flow-cat and Flow-print
Flow-cat and Flow-print work together to display session data in multiple capture files. If we change into the directory /nsm/netflow/fprobe/chm_sf1, we can see what sort of data Fprobe exported and Flow-capture collected. We call upon Flow-cat to concatenate all of the flow records in the directory and pipe the results to the Flow-print program.
janney# pwd
/nsm/netflow/fprobe/chm_sf1
janney# flow-cat 2004/2004-01/2004-01-09/ | flow-print
srcIP dstIP prot srcPort dstPort octets pckts
1 172.27.20.4 192.168.60.3 1 8 0 46 1
2 192.168.60.3 172.27.20.4 1 0 0 46 1
3 192.168.60.3 172.27.20.4 6 22 58173 46 1
4 192.168.60.3 172.27.20.4 6 21 58173 46 1
5 192.168.60.5 172.27.20.4 6 21 58173 46 1
6 192.168.60.5 172.27.20.4 6 22 58173 46 1
7 172.27.20.4 192.168.60.5 6 58173 21 92 2
8 172.27.20.4 192.168.60.5 6 58173 22 92 2
9 172.27.20.4 192.168.60.3 6 58173 22 92 2
10 172.27.20.4 192.168.60.3 6 58173 21 46 1
11 192.168.60.5 172.27.20.4 6 22 41204 60 1
12 192.168.60.5 172.27.20.4 6 24 41209 46 1
13 192.168.60.5 172.27.20.4 6 22 41207 46 1
14 192.168.60.5 172.27.20.4 6 24 41208 46 1
15 192.168.60.5 172.27.20.4 6 22 41197 46 1
16 192.168.60.5 172.27.20.4 6 24 41197 46 1
17 172.27.20.4 192.168.60.5 1 8 0 92 2
18 192.168.60.5 172.27.20.4 1 0 0 92 2
19 192.168.60.5 172.27.20.4 1 3 3 356 1
20 172.27.20.4 192.168.60.5 17 41197 24 328 1
21 172.27.20.4 192.168.60.5 6 41204 22 106 2
22 172.27.20.4 192.168.60.5 6 41209 24 60 1
...truncated...
What exactly are we looking at? As I explain these lines, remember that NetFlow treats a session as a unidirectional flow. You may want to refer to Chapter 4 to refresh your memory regarding the activity from which these flows were extracted.
Records 1 and 2 show an ICMP echo request followed by an ICMP echo reply. Records 3–6 are actually responses from reconnaissance targets; records 7–10 show the original packet flows that solicited the replies seen in records 3–6. Records 11–16 are replies to operating system fingerprinting activity. Records 17 and 18 show an ICMP echo request followed by an ICMP echo reply. Record 19 is an ICMP destination unreachable, port unreachable message. It was probably prompted by record 20, which shows a packet to port 24 UDP. Finally, records 21 and 22 are two of the operating system fingerprinting packets that prompted records 11–16.
After reading this rendering of the NetFlow data, you're probably wondering how on earth you could know what the flows mean without having preexisting knowledge. The point is that you have a great deal of information presented in compact form. For security applications we are more concerned with IP addresses, protocols, and ports, which we have in abundance. We can say where the intruder came from, where the intruder went, and what services were affected. These flows were all reconnaissance-related, as is apparent from the low octet and packet counts. Compare those to a representative flow from later in the same batch of records.
srcIP dstIP prot srcPort dstPort octets pckts
192.168.60.5 172.27.20.5 6 1035 20 1517180 1071
This record shows an active FTP transfer, indicated by the use of port 20 TCP. (Protocol 6 is TCP.) The exchange of 1,517,180 bytes (in the octets count) shows that something more substantial than a small text file or script was downloaded.
If you remember the introduction to flows, you'll notice that these records have no timestamp data. Flow-print supports a variety of output formats, controlled by the –f switch. By adding –f 1 we see timestamps. The extra information extends the results to two lines. A few of the fields shown in the output need explanation.
• Sif and DIf: source and destination Interface ifIndex, which identify the source of the flow
• SrcP and DstP: source and destination ports, in hexadecimal (e.g., 0xe33d is 58173 decimal). For ICMP (protocol 1), SrcP is ICMP type and DstP is ICMP code
• Active: time in milliseconds that the flow was active
• B/Pk: bytes per packet
• TS: type of service
• Fl: flags; for TCP, the cumulative logical OR of the TCP flags
Here's the output created by using Flow-print along with Flow-cat.
janney# flow-cat 2004/2004-01/2004-01-09/ | flow-print -f 1
Sif SrcIPaddress DIf DstIPaddress Pr SrcP DstP Pkts Octs
StartTime EndTime Active B/Pk Ts Fl
0000 172.27.20.4 0000 192.168.60.3 01 8 0 1 46
0109.17:33:26.697 0109.17:33:26.697 0.000 46 00 00
0000 192.168.60.3 0000 172.27.20.4 01 0 0 1 46
0109.17:33:26.697 0109.17:33:26.697 0.000 46 00 00
0000 192.168.60.3 0000 172.27.20.4 06 16 e33d 1 46
0109.17:33:29.877 0109.17:33:29.877 0.000 46 00 12
0000 192.168.60.3 0000 172.27.20.4 06 15 e33d 1 46
0109.17:33:29.877 0109.17:33:29.877 0.000 46 00 14
This is not exactly the easiest data with which to work. Besides being somewhat arcane, we see multiple records for each flow. The advantage to collecting NetFlow data is its source. We can often pull this information from routers in key locations, where no one is willing to deploy a dedicated sensor platform. Analysts like Rob Thomas are well known for their ability to make good use of NetFlow data for tracking bot nets.20
When I have to work with NetFlow data, I essentially “grep” for IPs or ports of interest, then use that information to confirm or deny theories of an intruder's actions. More sophisticated interfaces to NetFlow data make searching for this information easy, but anyone can do it if the flows are recorded in a format similar to that used by Flow-tools.
So far this chapter has concentrated on using NetFlow data to identify patterns of activity by IP address and port. NetFlow can be used for many other applications, especially those involving network health and performance. If one of the solutions in these NetFlow-related sections didn't meet your needs, I recommend visiting the Swiss Education and Research Network's Network Monitoring and Analysis site at http://www.switch.ch/tf-tant/floma/. This organization documents other software for collecting and processing flow data. Researchers at the CERT have also gotten in on the NetFlow act with the System for Internet-Level Knowledge (SiLK) NetFlow analysis project at http://silktools.sourceforge.net/. For advanced applications of NetFlow data, visit the Team Cymru site at http://www.cymru.com.21
sFlow and sFlow Toolkit
Purpose: Session data protocol
Author: Multiple
Internet site: http://www.sflow.org
FreeBSD installation: Installed from source code
Version demonstrated: Reference implementation of an sFlow agent provided by InMon Corporation
sFlow is a competing flow format promoted by the InMon Corporation along with HP and Foundry Networks.22 The sFlow format is documented in RFC 3176, but its penetration into the open source community is limited compared to NetFlow.23 Numerous vendors sell equipment to export sFlow data, but sFlow is a packet-sampling system touted as being “inexpensive enough to embed in every switch port and scalable enough to monitor thousands of ports at 10Gbps speeds.”24
To promote sFlow, InMon offers developer tools as reference implementations of sFlow probes and collectors.25 I tried the InMon_Agent-4.0 sFlow probe and the sFlowtool collector, as demonstrated here.
bourque# tar -xzf InMon_Agent-4.0.tar.gz
bourque# tar -xzf sflow_tools-3.1.tar.gz
After downloading the appropriate archives, I unpacked them. The InMon Agent compiled without any trouble.
bourque# cd InMon_Agent-4.0
bourque# ls
ChangeLog inmon_agent.C inmon_sampler.C
Makefile inmon_api.h inmon_target.C
RCS inmon_dataSource.C inmsp.C
README inmon_pkt.h
bourque# make
gcc -D_GNU_SOURCE -DSTDC_HEADERS -I. -I/usr/include/pcap
-g -W -c inmon_agent.C
gcc -D_GNU_SOURCE -DSTDC_HEADERS -I. -I/usr/include/pcap
-g -W -c inmon_dataSource.C
gcc -D_GNU_SOURCE -DSTDC_HEADERS -I. -I/usr/include/pcap
-g -W -c inmon_sampler.C
gcc -D_GNU_SOURCE -DSTDC_HEADERS -I. -I/usr/include/pcap
-g -W -c inmon_target.C
gcc -D_GNU_SOURCE -DSTDC_HEADERS -I. -I/usr/include/pcap
-g -W -c inmsp.C
gcc -D_GNU_SOURCE -DSTDC_HEADERS -I. -I/usr/include/pcap
-g -W -o inmsp inmon_agent.o inmon_dataSource.o
inmon_sampler.o inmon_target.o inmsp.o –lpcap
The sFlowtool collector, on the other hand, didn't like the make command. I compiled it by hand after running configure.
bourque# cd sflow_tools-3.1
bourque# ./configure
creating cache ./config.cache
checking for a BSD compatible install... /usr/bin/install -c
checking whether build environment is sane... yes
checking whether make sets ${MAKE}... yes
...edited...
updating cache ./config.cache
creating ./config.status
creating Makefile
creating config.h
bourque# gcc sflowtool.c -o sflowtool
Next I downloaded the sFlowTest.awk script, a sort of Flow-print for sFlow. I modified the script to accommodate the location of awk on my FreeBSD system (in /usr/bin/awk) and told the script to output its results to /usr/local/www/data/sflow/stats.html. I then created a /usr/local/www/data/sflow/ directory because the sFlowTest.awk script creates an HTML file to be published by a Web server like Apache.
With all of these components compiled or modified, I started each one. I knew to have sFlowtool listen on port 6343 UDP after watching the InMon Agent export its sFlow records there in an earlier test.
bourque# ./sflowtool -p 6343 | ./sflowTest.awk &
bourque# ./inmsp -d ngeth0 -c 172.27.20.3 &
With the data from sFlowtool being piped into sFlowTest.awk, I should have seen some results in the stats.html Web page. Figure 7.3 shows what I saw when I visited my Web server. These results did not look promising.
Figure 7.3. sFlow test results
The sFlow reference code is only designed to show developers how to manipulate sFlow data. It is not designed for use in the wild. I include it here because sFlow is a format supported by many vendors, so you may come across it.
Argus
Purpose: Session data probe, collector, and analysis tool
Author: Carter Bullard
Internet site: http://www.qosient.com/argus
FreeBSD installation: Installed via source code
Version demonstrated: 2.0.6
Beginning with this section we depart the land of NetFlow and sFlow, and turn to products that support their own session data formats. The first is Argus, a project started by Carter Bullard in 1993 while he worked at the CERT. Argus is a real-time flow monitor (RTFM), as defined by RFC 2724. It differs from NetFlow in that its flows are bidirectional, unlike NetFlow's unidirectional flows. Argus subscribes to the flow definition found in RFC 2724: “The RTFM Meter architecture views a flow as a set of packets between two endpoints (as defined by their source and destination attribute values and start and end times), and as BI-DIRECTIONAL (i.e., the meter effectively monitors two sub-flows, one in each direction).”26
Argus implements the flow types that conform to the IETF Framework for IP Performance Metrics, described in RFC 2330.27 Analysts use Argus for security, accounting, network management, and performance functions. Here we focus on generating session records from libpcap data using Argus, but I will also show how to run Argus in live collection mode.
I consider Argus to be the single most important tool in the emergency NSM arsenal. If I had to choose one application to deploy in an incident response scenario, it would be Argus. I would almost choose Argus collecting session data over Tcpdump collecting full content data because hard drives saving full content data fill much too quickly. I can deploy Argus on commodity hardware running FreeBSD and not worry about excessive packet loss or ring buffers of packet capture data emptying every few hours.
Like Flow-tools, Argus consists of a suite of applications. I will demonstrate two applications here: the Argus probe/collector and the Ra analysis tool.
Argus Server
The Argus daemon serves as both probe and collector; it watches network traffic and writes session records to file. Argus is typically started using the following syntax.
argus -c -d -i <interface> -w <capfile> – ip
Let me explain the switches.
• –c tells Argus to create a PID file, typically in /var/run.
• –d tells Argus to run as a daemon in the background.
• –i specifies an interface on which to listen.
• –w specifies the name of the output file.
• – ip (note the space) tells Argus to collect only IP traffic; ARP, for example, is ignored.
Besides the simple – ip filter, Argus understands all of the BPFs you know and love from your Tcpdump days. This means you can target Argus against IPs or ports of interest, and you can make Argus ignore unwanted IPs or ports. Argus offers many other features, including the ability to capture a specified amount of user data via the –U switch. Once started, Argus typically spawns multiple copies of itself, as demonstrated on this live system.
bourque# ps -auxww | grep argus
root 150 0.0 0.3 2568 1484 ?? Ss 5:16PM 0:03.06
argus -c -d -i ngeth0 -w /nsm/argus/20040109-171622.bourque.taosecurity.com.ngeth0.arg – ip
root 152 0.0 0.2 2240 1108 ?? S 5:16PM 0:04.63
argus -c -d -i ngeth0 -w /nsm/argus/20040109-171622.bourque.taosecurity.com.ngeth0.arg – ip
root 153 0.0 0.2 2376 1244 ?? S 5:16PM 0:02.47
argus -c -d -i ngeth0 -w /nsm/argus/20040109-171622.bourque.taosecurity.com.ngeth0.arg – ip
Three instances of Argus are running, each writing results to files with the convention DATE.HOSTNAME.INTERFACE.arg. This is a format I chose by starting Argus within a shell script with the following variables.
#!/bin/sh
DATE=`/bin/date "+%Y%m%d-%H%M%S"`
HOSTNAME=`hostname`
INTERFACE=ngeth0
SENSOR=172.27.20.3
PREFACE="$DATE.$HOSTNAME.$INTERFACE"
argus -c -d -i $INTERFACE -w /nsm/argus/$PREFACE.arg – ip
I find using formats like these makes it easy to remember where a trace file originated, should it be copied to another system for analysis.
In addition to running Argus against live interfaces, we can also run Argus against libpcap-formatted trace files. As we did for NetFlow data, we can create Argus records. First we create the necessary directories to store the results, then tell Argus to read the sf1.lpc and em0.lpc trace files.
bourque# mkdir –p /nsm/argus/chm_sf1
bourque# mkdir –p /nsm/argus/chm_em0
bourque# argus -r sf1.lpc -w /nsm/argus/chm_sf1/sf1.arg
bourque# argus -r em0.lpc -w /nsm/argus/chm_em0/em0.arg
The results are the two files sf1.arg and em0.arg.
bourque# ls -alR
./chm_em0:
total 8
drwxr-xr-x 2 root wheel 512 Jan 9 23:44 .
drwxr-xr-x 4 root wheel 2048 Jan 9 23:41 ..
-rw-r--r-- 1 root wheel 2968 Jan 9 23:43 em0.arg
./chm_sf1:
total 484
drwxr-xr-x 2 root wheel 512 Jan 9 23:43 .
drwxr-xr-x 4 root wheel 2048 Jan 9 23:41 ..
-rw-r--r-- 1 root wheel 471212 Jan 9 23:43 sf1.arg
Ra Client
Argus records can be read only by the Ra client. Ra offers an impressive array of features, but here we concentrate on those that help us track the intruder via IP address, protocol, and ports. The –n flag in the following command disables resolution of IPs and ports, and –L0 (capital L and number zero) prints column headers. I removed the date (01 Jan 04) from the far-left column to fit within the book's margins.
bourque# ra -n -r sf1.arg -L0
09 Jan 04 23:43:10 man version=2.0 probeid=3848370891 STA
Start Type SrcAddr Sport Dir DstAddr Dport State
1 15:20:07 tcp 172.27.20.4.58173 -> 192.168.60.3.21 RST
2 15:20:21 tcp 172.27.20.4.41197 -> 192.168.60.5.24 RST
3 15:20:21 tcp 172.27.20.4.41208 -> 192.168.60.5.24 RST
4 15:20:07 tcp 172.27.20.4.58173 -> 192.168.60.3.22 RST
5 15:20:07 tcp 172.27.20.4.58173 -> 192.168.60.5.21 RST
6 15:20:07 tcp 172.27.20.4.58173 -> 192.168.60.5.22 RST
7 15:20:21 tcp 172.27.20.4.41206 ?> 192.168.60.5.22 EST
8 15:20:21 tcp 172.27.20.4.41197 -> 192.168.60.5.22 RST
9 15:20:25 tcp 172.27.20.4.41200 -> 192.168.60.5.22 RST
10 15:20:21 tcp 172.27.20.4.41204 -> 192.168.60.5.22 RST
11 15:20:21 tcp 172.27.20.4.41205 ?> 192.168.60.5.22 TIM
12 15:20:25 tcp 172.27.20.4.41198 -> 192.168.60.5.22 RST
13 15:20:21 tcp 172.27.20.4.41207 ?> 192.168.60.5.22 RST
14 15:20:21 tcp 172.27.20.4.41209 ?> 192.168.60.5.24 RST
15 15:20:26 tcp 172.27.20.4.41201 -> 192.168.60.5.22 RST
16 15:20:21 tcp 172.27.20.4.41210 ?> 192.168.60.5.24 TIM
17 15:20:21 udp 172.27.20.4.41197 -> 192.168.60.5.24 TIM
18 15:20:25 tcp 172.27.20.4.41199 -> 192.168.60.5.22 RST
19 15:20:21 icmp 192.168.60.5 -> 172.27.20.4 URP
20 15:20:26 tcp 172.27.20.4.41203 -> 192.168.60.5.22 RST
...truncated...
Note that because we generated Argus data directly from libpcap files, Ra shows the true date and time as contained in the packet traces. This makes Argus very handy for network investigations compared to deriving NetFlow data from traces. NetFlow data generated directly from live traffic as it happens doesn't suffer this limitation.
As with Flow-print, I will explain each sample entry. Session records 1, 4, 5, and 6 are evidence of reconnaissance. Although they are slightly out of order chronologically, the fact that they share 15:20:07 timestamps indicates they happened concurrently. All remaining records except for record 19 are associated with operating system fingerprinting. The State column shows the state of the session when Argus made the session data record. Session 7 was recorded as EST or “established.” Later if Argus sees the session closed via RST, it makes a new session data record with a RST value. For sessions that show no additional activity, Argus eventually records a TIM or “time out” entry. Certain entries, like the ICMP one in record 19, contain protocol-specific information; URP means “port unreachable.” All of the state entries are documented in the Argus manual page bundled with the program.
These reconnaissance-related records are not the most exciting to investigate. When looking at “sessions” that consist of more than a SYN and RST ACK, we see more important behavior.
Start Type SrcAddr Sport Dir DstAddr Dport State
21 15:27:22 tcp 192.168.60.5.1032 -> 172.27.20.5.21 FIN
22 15:27:40 tcp 172.27.20.5.20 -> 192.168.60.5.1037 FIN
23 15:28:02 tcp 172.27.20.5.20 -> 192.168.60.5.1038 FIN
24 15:35:09 tcp 192.168.60.5.1039 -> 172.27.20.5.21 FIN
25 15:35:21 tcp 172.27.20.5.20 -> 192.168.60.5.1040 FIN
26 15:35:27 tcp 172.27.20.5.20 -> 192.168.60.5.1041 FIN
Records 21 and 24 show two separate FTP control channels between the same hosts. Although they share destination port 21 TCP, their source ports (1032 and 1039 TCP, respectively) are different. Records 22, 23, 25, and 26 indicate active FTP data sessions. Again, observe the different ports to distinguish unique sessions.
Just as the Argus daemon has many other options not shown here, Ra can jump through a few more hoops. To see the counts of bytes and packets passed by both sides and to see TCP flags passed by both sides, use syntax like the following.
bourque# ra -n -r sf1.arg -L0 -c -Z b
Start_Time Type SrcAddr Sport Dir DstAddr Dport SrcP
kt Dstpkt SrcBytes DstBytes Status
15:27:22 tcp 192.168.60.5.1032 -> 172.27.20.5.21 15
14 1120 1336 FPA_FPA
15:27:40 tcp 172.27.20.5.20 -> 192.168.60.5.1037 10
6 9370 404 FSPA_FSA
15:28:02 tcp 172.27.20.5.20 -> 192.168.60.5.1038 14
8 16601 536 FSPA_FSA
15:28:55 tcp 172.27.20.3.3307 -> 192.168.60.5.21 17
15 1237 1284 PA_PA
15:29:59 tcp 172.27.20.3.3307 -> 192.168.60.5.21 12
11 875 1020 PA_PA
15:33:44 tcp 172.27.20.105.32819 -> 192.168.60.5.22 203
132 16378 14071 SPA_SPA
15:34:44 tcp 172.27.20.105.32819 -> 192.168.60.5.22 227
144 17338 16216 PA_PA
15:35:09 tcp 192.168.60.5.1039 -> 172.27.20.5.21 20
15 1447 1439 FSPA_FSPA
15:35:21 tcp 172.27.20.5.20 -> 192.168.60.5.1040 4
3 1295 206 FSPA_FSA
15:35:27 tcp 172.27.20.5.20 -> 192.168.60.5.1041 335
171 502724 11294 FSPA_FSA
These records are harder to read, but we see the counts of packets passed by source and destination, followed by the bytes of data passed by source and destination. The notation at the end of each line represent the TCP flags seen during that session. For most of the records we see what we would expect for a normal TCP connection. Look at the last record and imagine how the session might have happened, and then look at Figure 7.4.
Figure 7.4. A complete active FTP session
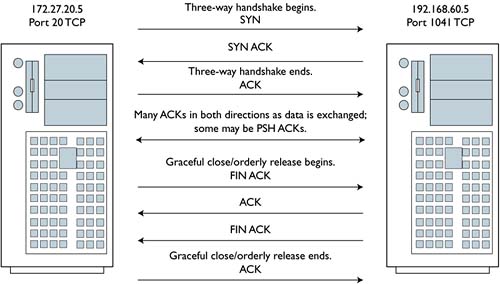
We see that Figure 7.4 theorizes that some of the ACKs in each direction may be PSH ACKs. We can be sure that 172.27.20.5 sent at least one PSH ACK while 192.168.60.5 did not. How? If each side sent at least one PSH ACK, Argus would have recorded FSPA_FPSA in the last record. It did not, recording instead FSPA_FSA. We assume that the server, 172.27.20.5, initiated the graceful close with a FIN ACK, because it would consider itself done once it finished transferring a file of interest.
This sort of detail shows you the power of session data to concisely represent granular details in a single record. Like the Argus daemon, the Ra client also accepts BPFs. You could easily check the session data for all FTP control channel sessions with this command:
bourque# ra -n -r sf1.arg -L0 port 21
You zoom in on a particular machine with this command:
bourque# ra -n -r sf1.arg -L0 host 172.27.20.3
You could ignore certain ports and IPs with this command:
bourque# ra -n -r sf1.arg -L0 not host 172.27.20.4 and
not port 3389
Argus and Ra are extremely powerful. Visits to the Argus mailing list reveal people running the pair on very busy networks to perform security and performance monitoring.28 The Argus suite includes other tools like Racount, which can provide statistics on Argus-produced files. Every column should be self-explanatory, except for the rd column; it stands for “records” and represents the number of packets of each protocol seen.
racount rd tot_pkts src_pkts dst_pkts tot_bytes src_byte dst_byte
tcp 2857 17580 10928 6652 4917776 1862148 3055628
udp 14 14 14 0 1051 1051 0
icmp 7 10 7 3 896 770 126
sum 2878 17604 10949 6655 4919723 1863969 3055754
How accurate is Argus? These counts are obtained by Racount checking data in the Argus session file obtained by analyzing the sf1.lpc trace. We can check the record counts easily by analyzing the original sf1.lpc file with the wc or word count command.
bourque# tcpdump -n -r sf1.lpc tcp| wc -l
17580
bourque# tcpdump -n -r sf1.lpc udp | wc -l
bourque# tcpdump -n -r sf1.lpc icmp | wc -l
14
10
bourque# tcpdump -n -r sf1.lpc | wc -l
17604
Argus fared very well. Besides the compiled binaries, Argus ships with Perl scripts developed by long-time Argus users like Russell Fulton, in argus-2.0.6/contrib/Argus-perl-2.00.29 Argus is an excellent tool, with applications far beyond security. A visit to the mailing list archive shows John Studarus is working on a Ramysql program to send Argus data to a MySQL database. This is a longtime Argus user's wish, so watch for that in the future.
Tcptrace
Purpose: Multipurpose traffic analysis tool
Author: Shawn Ostermann
Internet site: http://www.tcptrace.org/
FreeBSD installation: Installed via /usr/ports/net/tcptrace
Version demonstrated: 6.6.0
Tcptrace is an extremely powerful traffic analysis tool. I introduce it briefly here because I originally discovered it for its session data capabilities. Using Tcptrace solely for producing session records is a little like using a thoroughbred for pony rides, but we don't have the space in this book to thoroughly investigate this program.30 Shawn Ostermann and his colleagues at the Internetworking Research Group (IRG) at Ohio University use Tcptrace and other tools in their research.31 It's mainly a TCP performance analysis tool, with the ability to create plots, statistics, and other information of value to researchers.
We can use Tcptrace as follows to check out sessions in the em0.lpc trace.
bourque# tcptrace -n -r em0.lpc
1 arg remaining, starting with 'em0.lpc'
Ostermann's tcptrace -- version 6.6.0 -- Tue Nov 4, 2003
1136 packets seen, 1132 TCP packets traced
elapsed wallclock time: 0:00:00.007234, 157036 pkts/sec analyzed
trace file elapsed time: 0:10:49.992285
TCP connection info:
1: 192.168.60.3:34720 - 10.10.10.3:3389 (a2b) 583> 452<
2: 192.168.60.3:34717 - 10.10.10.3:3389 (c2d) 3> 6< (reset)
3: 10.10.10.3:1075 - 172.27.20.5:21 (e2f) 46> 36<
** Warning, e2f: detected 23 hardware duplicate(s)
(same seq # and IP ID)
** Warning, f2e: detected 18 hardware duplicate(s)
(same seq # and IP ID)
4: 172.27.20.5:21 - 10.10.10.3:1070 (g2h) 4> 2<
** Warning, g2h: detected 2 hardware duplicate(s)
(same seq # and IP ID)
** Warning, h2g: detected 1 hardware duplicate(s)
(same seq # and IP ID)
What's going on here? Returning to the full content data already presented in the em0.lpc trace, you'll see entries like the following ones.
bourque# tcpdump -n -r em0.lpc port 21
16:22:12.655676 10.10.10.3.1075 > 172.27.20.5.21:
S 2318648083:2318648083(0) win
16384 <mss 1460,nop,nop,sackOK> (DF)
16:22:12.655682 10.10.10.3.1075 > 172.27.20.5.21:
S 2318648083:2318648083(0) win
16384 <mss 1460,nop,nop,sackOK> (DF)
16:22:12.655922 172.27.20.5.21 > 10.10.10.3.1075:
S 1774414795:1774414795(0) ack
2318648084 win 57344 <mss 1460> (DF)
16:22:12.655927 172.27.20.5.21 > 10.10.10.3.1075:
S 1774414795:1774414795(0) ack
2318648084 win 57344 <mss 1460> (DF)
16:22:12.656047 10.10.10.3.1075 > 172.27.20.5.21:
. ack 1 win 17520 (DF)
16:22:12.656052 10.10.10.3.1075 > 172.27.20.5.21:
. ack 1 win 17520 (DF)
We're seeing double! Apparently the manner in which we spanned ports caused two copies of every packet sent between 10.10.10.3 and 172.27.20.5 to be recorded in em0.lpc. Tcptrace detected this and reports seeing the same sequence number and IP ID for several packets. Rather than filter out the extra entries before providing you the trace, I decided to leave the duplicates as an example of the real-life problems encountered when collecting traffic.
Understanding Tcptrace output requires recognizing its shorthand notations. Tcptrace assigns alphanumeric codes to the sessions it sees. The first session, a2b, represents the connection from 192.168.60.3 port 34720 TCP to 10.10.10.3 port 3389 TCP; session c2d is the second connection, and so forth. The nice aspect of Tcptrace is its ability to reduce all traffic to a single session record. NetFlow generated flow records for each direction because it is a unidirectional system. Argus produced multiple bidirectional records but could generate one or more per flow depending on session timeouts. Tcptrace tends to represent sessions with a single record, period.
The counts after the session notation are the numbers of packets sent in each direction. For session a2b, 583 packets were sent from a to b, while 452 were sent from b to a. If the session closed via orderly release, Tcptrace will report it “complete”; this is not seen here. We do see session c2d closed via RST, and Tcptrace could make no determination for the other sessions.
Because Tcptrace works only on libpcap files, its timestamps are faithful to the original data. The program can also attempt to analyze UDP sessions by passing the –u flag. Using the –l flag produces extremely detailed statistics on each TCP session seen. Here is one as an example.
================================
TCP connection 2:
host c: 192.168.60.3:34717
host d: 10.10.10.3:3389
complete conn: RESET (SYNs: 0) (FINs: 1)
first packet: Thu Jan 1 16:21:40.138186 2004
last packet: Thu Jan 1 16:21:40.155794 2004
elapsed time: 0:00:00.017608
total packets: 9
filename: em0.lpc
c->d: d->c:
total packets: 3 total packets: 6
resets sent: 0 resets sent: 1
ack pkts sent: 3 ack pkts sent: 5
pure acks sent: 0 pure acks sent: 1
sack pkts sent: 0 sack pkts sent: 0
dsack pkts sent: 0 dsack pkts sent: 0
max sack blks/ack: 0 max sack blks/ack: 0
unique bytes sent: 34 unique bytes sent: 195
actual data pkts: 2 actual data pkts: 4
actual data bytes: 34 actual data bytes: 195
rexmt data pkts: 0 rexmt data pkts: 0
rexmt data bytes: 0 rexmt data bytes: 0
zwnd probe pkts: 0 zwnd probe pkts: 0
zwnd probe bytes: 0 zwnd probe bytes: 0
outoforder pkts: 0 outoforder pkts: 0
pushed data pkts: 2 pushed data pkts: 4
SYN/FIN pkts sent: 0/1 SYN/FIN pkts sent: 0/0
req 1323 ws/ts: N/Y req 1323 ws/ts: N/Y
urgent data pkts: 0 pkts urgent data pkts: 0 pkts
urgent data bytes: 0 bytes urgent data bytes: 0 bytes
mss requested: 0 bytes mss requested: 0 bytes
max segm size: 17 bytes max segm size: 147 bytes
min segm size: 17 bytes min segm size: 16 bytes
avg segm size: 16 bytes avg segm size: 48 bytes
max win adv: 41992 bytes max win adv: 16706 bytes
min win adv: 41992 bytes min win adv: 16689 bytes
zero win adv: 0 times zero win adv: 0 times
avg win adv: 41992 bytes avg win adv: 13910 bytes
initial window: 17 bytes initial window: 0 bytes
initial window: 1 pkts initial window: 0 pkts
ttl stream length: NA ttl stream length: NA
missed data: NA missed data: NA
truncated data: 0 bytes truncated data: 0 bytes
truncated packets: 0 pkts truncated packets: 0 pkts
data xmit time: 0.001 secs data xmit time: 0.002 secs
idletime max: 8.0 ms idletime max: 8.4 ms
throughput: 1931 Bps throughput: 11075 Bps
RTT samples: 3 RTT samples: 2
RTT min: 0.1 ms RTT min: 0.1 ms
RTT max: 1.0 ms RTT max: 6.4 ms
RTT avg: 0.7 ms RTT avg: 3.2 ms
RTT stdev: 0.5 ms RTT stdev: 0.0 ms
RTT from 3WHS: 0.0 ms RTT from 3WHS: 0.0 ms
RTT full_sz smpls: 2 RTT full_sz smpls: 2
RTT full_sz min: 1.0 ms RTT full_sz min: 0.1 ms
RTT full_sz max: 1.0 ms RTT full_sz max: 6.4 ms
RTT full_sz avg: 1.0 ms RTT full_sz avg: 3.2 ms
RTT full_sz stdev: 0.0 ms RTT full_sz stdev: 0.0 ms
post-loss acks: 0 post-loss acks: 0
segs cum acked: 0 segs cum acked: 2
duplicate acks: 0 duplicate acks: 0
triple dupacks: 0 triple dupacks: 0
max # retrans: 0 max # retrans: 0
min retr time: 0.0 ms min retr time: 0.0 ms
max retr time: 0.0 ms max retr time: 0.0 ms
avg retr time: 0.0 ms avg retr time: 0.0 ms
sdv retr time: 0.0 ms sdv retr time: 0.0 ms
Although Tcptrace is mainly aimed at the network engineering crowd, in some cases it may provide the extra horsepower and insight needed for in-depth security investigations.32
Conclusion
This chapter has introduced session data in many formats, ranging from NetFlow to sFlow to proprietary but effective formats used by Argus and others. Even more options exist. John Curry's Security Analyst Network Connection Profiler (SANCP) appeared in Sguil 0.4.0 as a supplement or replacement to conversations recorded by Snort's stream4 preprocessor. IPAudit is another contender, with a sharp new Web page and updated releases.33 The future seems bright for session data!
In the next chapter, we'll look at statistical data about network traffic. These statistics won't be used to predict activity, as is the case with mathematical probability cases. Rather, we'll use statistical tools to get an overview of the sorts of traffic seen by a network probe. Just as session data is a step above the detail of full content data, statistical data is a way of moving above session data to understand network activity.