
Chapter 7. Creating Custom Queries
IN THE PREVIOUS CHAPTER, you learned everything you need to construct queries, but the ones you’ve seen so far have been fairly simple ones. After all, you were only asking the database simple questions. Next, to paraphrase that popular TV chef, you’re gonna kick it up a notch—by creating queries that ask tougher questions. You’re also going to learn how to extract information from your database that isn’t explicitly stated there—that is, you’ll learn how to build calculations in Access that add, multiply, divide, and process your information to generate new data right in the query.
But first, you’re going to work outside those helpful but sometimes limiting Access wizards to create your own queries using the Query Design window. The more complex and powerful your queries get, the more likely you’ll need the flexibility the design window offers over a wizard.
Creating Queries in the Query Design Window
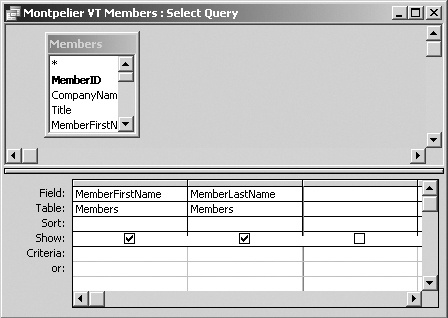
The Query Design window, as shown in Figure 7-1, isn’t a completely foreign critter to you: It looks very much like the Database Design window used for creating filters. The table or tables used as the data source for a query appear in the upper half of the Query Design window. If only one table is used, a box listing the fields available in that table appears at the top left; if multiple tables are used, then each table gets its own listing box spread out across the top half of the window. The lower half of the window—called the Query by Example (QBE) section or QBE grid—sits below.
As you’ve done before, you can choose a field from the table list and drag it down, and then drop it into an empty Field box, or you can click within a Field box, and then select a table field from the drop-down menu. Once your query is complete, you click the Run (red exclamation mark) button in the toolbar or select Query → Run.
But first, you need to be familiar with all the options you can designate here as part of your query. It’s time to review, and expand on, the criteria, expressions, and operators you first tackled at the end of Chapter 5.
Using Criteria in Queries
Criteria, also referred to as selection criteria, help you target only those records in your database that meet one or more specific conditions you set, just as you saw before with filters. You may recall that back when you worked with filters, you heard the term “expression.” The criteria you set in queries can be one of two major types:
A simple value, where you provide a straightforward name, number, and date for the query to match.
An expression, which combines a number of different elements, including simple values, functions, and calculations.
Expressions are made up of different entities or a combination of elements, including:
Identifiers. Specific values of a field; a common type of identifier is the actual name of a field, like MemberLastName or City.
Operators. Either words or symbols used to indicate what kind of operation (example: a math operation like multiplication) is going to be performed on one or more parts of the expression.
Symbols. Designated characters like asterisks (*), colons (:), question mark wildcards (?), and quotation marks (”), as well as special characters (Using wildcards in filters).
Values. Simple, literal values like the name of a city or a person, a designated number (like 100), a date, a mathematical constant (a preset value that doesn’t change, like a True or False flag on a record), the result of a function or calculation (like adding two values together and dividing them by another number), or an identifier.
Through setting criteria, you’ve already been able to find just those members in your OurClub database that live in a particular city, as an example of a fairly simple selection process where you’re filtering records based on a single criterion (records have to match the city you specify). You can also set multiple criteria, just as you did when you searched the Our Club database for both a particular city name and state. Then you used wildcards, which are symbols, to match just part of a name to help you locate records even when someone may have misspelled a name or address when entering the record.
But you can get far more sophisticated when establishing criteria. For example, you can perform calculations you provide in the Field box that then add, multiply, divide, subtract, count, or average (to name a few possibilities) all records that match the condition you set in the Criteria field. You can also use criteria to look for only the top or bottom performers or the average grade for all students taking a particular test.
To give you a better idea of what’s involved, you’ll build some custom queries using the Query Design window, set up criteria and calculations and craft your expressions. After that, you can run the queries and see the results for yourself.
Tip
If you’ve used Microsoft Excel, you’re probably familiar with formulas, which are the way you tell Excel to perform calculations. Formulas in Excel are basically the same thing as expressions in Access databases. Just be aware that the syntax (the structure of the calculation) in Access may be different.
Crafting a Custom Query Using the Query Design Window
In the OurClub database you worked with in the past couple chapters, you may have noticed that the main Members table includes a field detailing information on when each person’s membership expires. One common type of database query determines who needs to be contacted at a particular time with a reminder notice. In this case, the query would look for everyone whose membership expires this month so you can send them a renewal notice. But this same kind of query works if you’re working in a busy medical or dental office and you want to remind people that it’s time for their regular checkup or, for a vet’s office, tell the owners that it’s time to get Fido or Fluffy his yearly shots.
To learn how to create this kind of query yourself, download the example folder for this chapter from the Missing Manuals Web site (Example Databases), and open the OurClub3 database. Next, follow these steps:
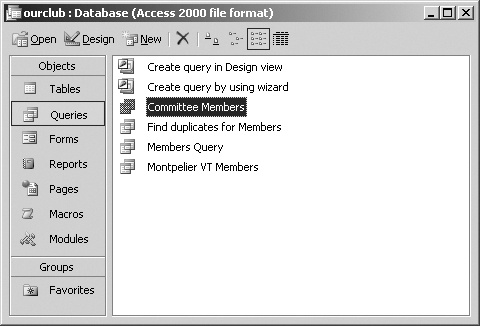
In the Database window’s Objects bar, click Queries.
You can also select View → Database Objects → Queries as another way to open the Queries panel.
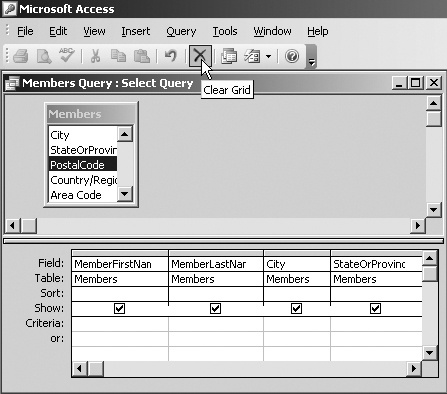
In the toolbar, click Design, as shown in Figure 7-2.
When clicked, the Design tool opens the Query Design window.
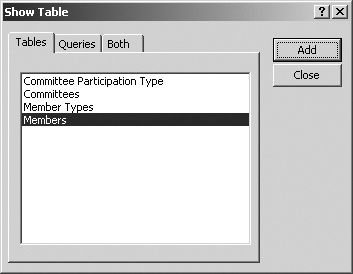
Figure 7-2. When you create a new query, Access starts by asking you to choose a table as a data source. As explained in step 3 below, you can find all members whose subscriptions need renewing just from the information in the Members table. For more complex queries, you can choose additional tables here and click Add.When the Show Table window opens, select the Members table, and then click Add (see Figure 7-3).
Here, you’re working only from a single table. To reach the Query Design window proper, in the Show Table window, click Close.
Figure 7-3. If you need to add additional tables (or even another query) as a data source for your query design, select the next table, and then click Add again, and continue until you have all your data sources chosen. To choose both tables and queries, select the Both tab, and then click Close when you’re ready to move to the Query Design window proper.From the Table fields list at the top left, select MemberFirstName, and then drag it down to the first blank Field box. (You can also double-click the field, and then move it down.)
Since you want to see the full name and mailing address, along with the membership expiration date for all records that match the criteria you set later in these steps, repeat this step to add the MemberLast Name field to the next available Field box and so on, until you’ve added BillingAddress, City, State/Province, Postal Code, and Member Expiration Date, in that order, to each available Field box. The end result should look like Figure 7-4.
Locate the empty Criteria box beneath the column starting Member Expiration Date. Click inside it and type: 02/28/2006.
By typing this date, you’re setting a simple value of a date to look for all members whose member registration expires on the last day of February 2006. Also, note that dates in Access are set off by the pound (#) sign.
In the Access toolbar, click Run (the red exclamation mark icon).
You can also select Query → Run to start your query. The query runs and results appear in a new window.
Note
If you happen to have other queries set up and saved for your database, and one of them is selected in Query view when you open Design view, the selected query is what opens on your Access desktop. While you can always edit the existing query, you may not want to do that. Instead, you may prefer a spanking new query you’re about to design. To avoid opening an existing query in the list, from the Queries menu, simply double-click “Create a query in Design view.”
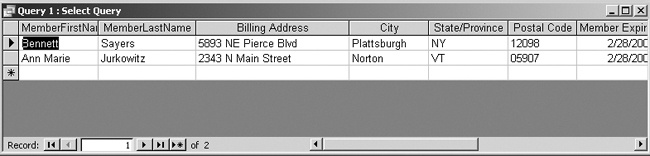
Assuming you followed the directions to the letter, your results should show two members who are due for your friendly renewal notice, as shown in Figure 7-5. Look at the title bar at the top of your results window and you’ll see the query doesn’t have a very distinctive name (here, Query1, and it’s identified as a Select query). This default name occurs because you didn’t specify a name for this customized query, which then becomes the name of the customized query results.
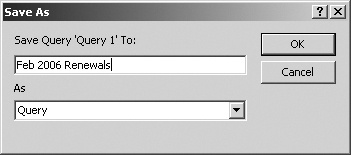
If you want to save your actual query results using a different name, select File → Save As (see Figure 7-6) with your query results window still open. Next, click inside the Save Query: Query 1 box, type instead Feb06 Renewals, and click OK.
Tweaking Your Custom Query
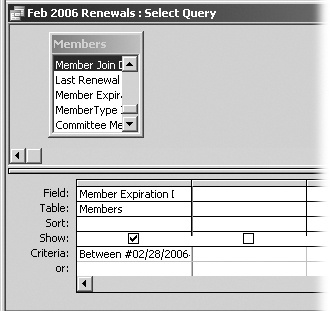
With the last exercise fresh in your mind, suppose you want to locate all members whose memberships expire this month and over the next 90 days. You need to tweak your query criteria slightly. In the Query Design window, just edit the date criteria from the simple, specific date of 02/28/2006 to an expression that gives a range of dates between 02/28/2006 and 05/31/2006.
Here’s how to create the expression and rerun your query in the OurClub database:
Click Query to open the Query view, and then double-click Feb06 Renewals.
This step opens your existing query in Query Design view, where you can make the necessary change to the dates you filter for.
Click inside the Criteria field in the Member Expiration Date field column, and delete the existing criteria.
Next, since you’re still using the set date of 02/28/2006, you could just leave the text in place and edit the field to add the rest of the expression. Do whichever causes you the least finger fatigue.
In the same Criteria box, type this expression: Between #02/28/2006# And #05/31/2006#.
Figure 7-7 illustrates the expression. It’s a formal way of telling Access, “Look for and display any records where the expiration dates occur between the last day of February and the last day of May 2006.”
Select File → Save As, and rename this query Feb-May 2006 Renewals.
By saving the query with a new name here, you aren’t overwriting the first query where you looked for just those records expiring in February 2006. You also changed the query name to more accurately reflect what the query does, so you could use it later as the basis for yet another newly tweaked query where you look for all members up for renewal, say, between June and August 2006.
On the toolbar, click the Run button.
Access runs your query and returns results that include the two additional months you specified when you changed the specific date of 02/28/2006 to a range of dates from that last day of February until the final day of May 2006.
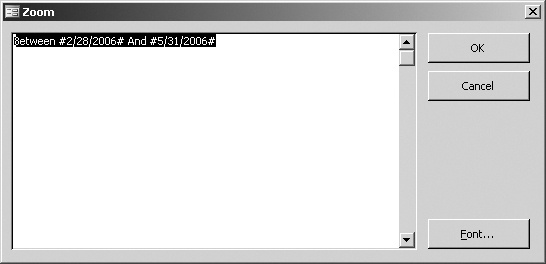
If you glance back at Figure 7-7 (or you were watching your screen when you typed the expression), you may have noticed that the expression is larger than the Criteria box, so you can’t see the entire expression at a glance. That’s inconvenient, and makes it more likely you’ll make an error that you can’t see. Fortunately, there’s a way to zoom in on the box and see the entire contents at once. To do so, right-click the box and choose Zoom. A separate window opens and shows you the exact contents of this box, as shown in Figure 7-8. When you’re done viewing the contents of the window, click OK or Close to return to the Query Design window proper.
Getting Sums, Totals, and Averages from Your Database
You’ve already gotten a hint of Access’s calculation capacity. Once you get into Expression Builder in the next section, you’ll see how you can perform just about any math function on your data to get cumulative information you just can’t get from viewing each record in your database individually.
With calculation capabilities in mind, you can have Access:
Count the number of records that fit your criteria so you know how many you have that fit a category you’re looking at.
Identify the top or bottom performers overall or in a segment of data (example: looking at top or bottom students in an entire class or in a portion of a class).
Figure 7-8. You can also edit a criteria’s expression by typing right in the Zoom window. Right-click the Criteria box (Figure 7-7) to open it.Add up records and calculate averages either for the total or a group of records.
Calculate a subtotal or a grand total.
Create totals by a group of records.
Add up a running sum.
Add up two or more columns and have the results appear in a new row.
Right now, it’s easier for you to appreciate how all this calculating works if you try some real-life examples. While the following calculations focus on simple and straightforward math, you can take the ball and run with it to do more advanced work as your skills with Access grow.
Calculating averages
Calculating an average for a group of records is a cinch. To try it, download and open the ClassGrades database (Example Databases). Assume for a moment you’re a teacher, and you’ve set up a small database where student information is in one table (Students) and their grades for various tests, quizzes, projects, and class participation are in a separate table (Individual Grades).
Say you want to figure out the average grade for each of the four tests your students took. You have that information in the Individual Grades table, but there’s no record that shows it explicitly, since the table lists each grade for each test by StudentID. Instead, you must sit with a calculator and work it out yourself by adding up all the grades for each test and then dividing them by the number of students. Or, you can let Access do the job for you. Here’s how to create the query:
In the Database window’s Objects bar, click Queries, and then double-click “Create query in Design view.”
Again, opening Query Design view this way makes sense because if you have other queries established for this database, you’ll end up opening an existing query by mistake if you click Design from the toolbar instead.
When the Show Table window appears, click the Tables tab, select Individual Grades, and then click Add. Click Close.
If you want to add actual student information to this query, click Add again before closing the Show Table window, so you can include the Students table as well. But here, you just want averages without details by student. Once Show Table closes, you’re back in Query Design.
In the top left Tables field list, click Test1 and drag it down to the first blank field in the QBE grid. Repeat to add Test2, Test3, and Test 4 to the next three blank fields.
Since you’re just looking for averages, there’s no need to establish a Sort order. Remember, too, that you can also click a blank field to choose the table fields rather than dragging and dropping.
On the Access toolbar, click the Greek E (Sum) icon.
Once you do this, look back at the QBE grid and you’ll see a new row has been added, labeled “Grouped by.”
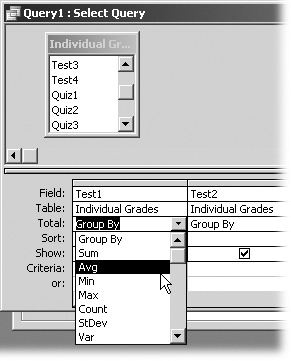
On the right side of the “Group by” box beneath Test 1, click the down-pointing arrow, and then choose Avg, as shown in Figure 7-9. Repeat this step for the “Group by” boxes beneath Test2, Test3, and Test4.
This step tells Access to calculate the grades for each of the tests and divide each total by the number of students taking the test to provide you with the average grade. Glance again at the “Group by” field and you’ll see a number of other functions you could also choose, like Count (which would show you 16 students took this test), Min (to see the lowest grade), Max (to view the highest test grade received), and so on.
Figure 7-9. The Total → “Group by” field lets you perform a number of different common functions without the need for putting together an expression yourself or getting too complicated within the query design. For example, you can just choose Avg instead of typing out an expression that averages all students’ grades.From the toolbar, click Run, or select Query → Run.
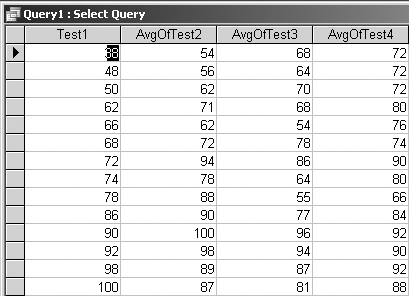
After the query runs and delivers the results (see Figure 7-10), you’ve got the answers you need. Clearly, this approach is much faster than adding up four different columns of 16 grades each, and then performing division to reach the average grade for each of the four tests. If a grade happens to change (because a student begs you for a retest, for example), you can rerun the query and get updated results far faster than you can if you work manually.
Using the numbers in two columns to create a third one
One thing you may have done frequently in spreadsheet software like Microsoft Excel, as well as on paper is to take the figures found in two columns and produce a third column that’s the result of multiplying, adding, dividing, or subtracting the first two. You can do the same thing using a query. You can, for example:
Add the cost of a product to the shipping price or tax for the product to get a final price.
Calculate sales tax (where the price is in one column and the tax rate in the second).
Multiply the number of hours it took to complete a project by your hourly labor rate.
Determine the value of your on-hand inventory by multiplying the cost or price of the products against the number of units you have on hand.
Let’s use that last example as the basis for your next query. Download (Example Databases) and open the FarmShopProducts database. Assume you’re creating records to document the products sold by a small farm stand (the kind that opens along roadsides across the country in the spring). The information contained in the database includes the retail prices for each item this stand sells, along with the units in stock for each.
One detail the shop must know as it opens is the value of the product inventory it has on hand. You’re going to create a query that lets you multiply the retail price found in one field in each product record by the number of units in stock. The result will give you a by-each-product value in a new column in your query. Later, you’ll total all these individual products to get the full value of the inventory.
The query you’re about to create is very general purpose. As you work, consider the ways in which you can apply this kind of query in your own databases. Here are the steps to create the initial query:
In the Database window’s Objects bar, click Queries, and then, in the toolbar, click Design.
The Show Table window opens. The FarmShopProducts database has only one table set up. It also has no existing queries. You’re going to add the first one.
In the Show Table window, select Products, click Add, and then click Close.
At last, Query Design view appears, ready for you to set up your query.
In the Products table, select Product Name and drag and drop it into the first blank Field box in the QBE grid. Do the same to add Units in Stock to the second blank Field box and Unit Price to the third blank Field box.
You added the Product Name because it’s the easiest way to differentiate one product from another in the query results you’ll get at the end of the process.
Right-click the next blank field column (the fourth column), and then choose Zoom.
The Zoom window opens, making it easier to see the entire expression as you’re typing it. Otherwise, part of the expression disappears from view as it grows too long for the Field box.
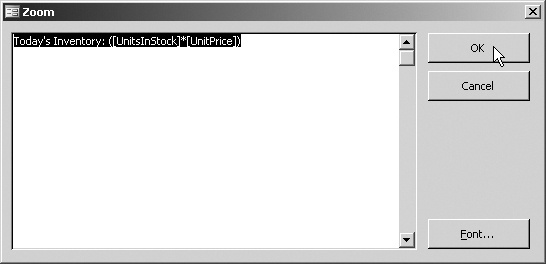
In the Zoom window, type: Today’s Inventory: ([Units in Stock]*[Unit Price]). Click OK.
Your expression should look identical to that shown in Figure 7-11. Here’s what each detail means:
Today’s Inventory sets up the name that will appear on this newly created column in your query results.
The parentheses tell Access that you’re going to group certain fields together for calculation; in a more complex expression, you may have two or more groupings and sets of parentheses, each specifying to Access what fields go together for calculation.
The brackets are used to identify field names found in your database records and the query.
The asterisk (*) is the symbol for multiplication, telling Access to multiply the value of the Units in Stock field against the value of the Unit Price field.
Click Run from the Access toolbar, or select Query → Run.
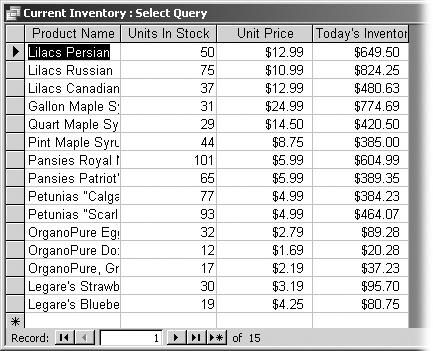
You’ve done everything right, so the query will run and display your results, as shown in Figure 7-12. If you made a mistake in your expression, you may get an error message. The error message basically tells you to go back, review your expression, and make changes to get it to run properly. Unfortunately, the error messages don’t give you much indication of what’s wrong.
Next, save and name your query results. Here’s how:
Select File → Save As.
The Save As window opens, where you can supply a personalized name for your query and its results.
Click inside the top box, delete the existing name, and type: Current Inventory. Click OK.
When you go back to look at your Queries list for this database, you’ll see the query listed there with the name you specified.
Close the query results by clicking the Close box at the top-right corner of the window.
This step returns you to the Queries view on your Access desktop.
Creating a subtotal, total, or grand total
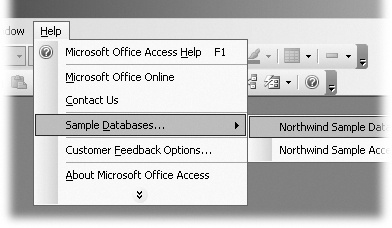
For this example, you’ll use the Northwind sample database that comes free with every copy of Access (see the box in Gem in the Rough: Northwind Database). Select Help → Sample Databases → Northwind Sample Database (see Figure 7-13). Either the file will open directly, or, if it’s not installed, Access will pull it off your Access or Office installation CD, and then open it on your desktop. Once you see the opening screen, click OK. When a window opens called Main Switchboard, select Database View. The main Access window opens in Tables view, giving you an idea of how well developed this sample is with its many tables.
You’re going to use Northwind to look up a specific piece of information: how much one particular customer spent on her last order through Northwind. If you went through the various tables of the database, you could get different pieces of the puzzle, like how many of one particular product this person ordered, but you want to see a subtotal of how much they spent overall.
The fastest way to get the subtotal is to create a custom query that performs a calculation of records stored in the Order Details table. You limit the search to just the OrderID for the customer’s last order, and then add up all the different products (and quantities) in that order. For the sake of argument, assume you’ve looked up this customer’s last OrderID—11066. Next, follow these steps:
In the Objects bar, from the Objects menu, click Queries.
You’ll see that the Northwind database has a whole slew of existing queries, which you can (later) explore at will. For now, you’re going to create your own just looking up the records associated with a particular Order ID and calculate a subtotal.
In the Queries panel, double-click “Create a query in Design view.”
As you’ve seen before, Access first displays the Show Tables window with its three tabs. You’re interested in Tables.
Select the Order Details table, click Add, and then click Close.
This step opens the now-familiar Query Design window.
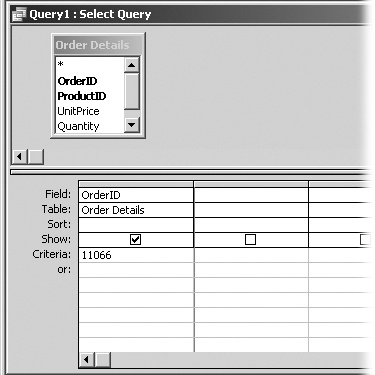
In the Order Details table window, click OrderID and drag this down to the first field in the QBE grid.
You’ve chosen this field from this table because it lets you look just at the piece of information you have: the unique OrderID. Next, you’ll limit your records to the OrderID you want to subtotal.
In the Criteria box below Order ID, type 11066, as shown in Figure 7-14.
Although a horde of other orders are listed in this database, you’re telling Access to pay attention only to those products and prices detailed for this one OrderID.
To the right of Order ID, right-click in the blank field, and select Zoom.
Remember the column you added to your query in the previous exercise? You’re going to do something similar here to add a subtotal column that’s not available anywhere else in this database, to report back how much this customer spent on this order.
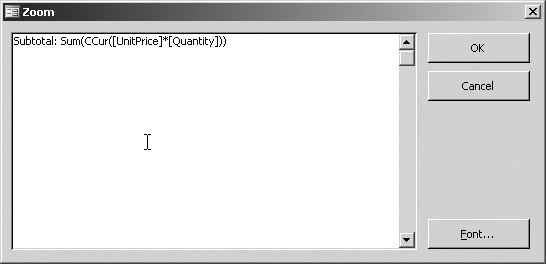
Type Subtotal: Sum(CCur([UnitPrice]*[Quantity])).
With this expression (see Figure 7-15), you’re creating a new column labeled Subtotal (with a colon just to its right telling Access this is a new column title) that sums up (Sum) your subtotal from the values of the Unit Price field (in brackets) multiplied (*) by the Quantity ordered field (also in brackets).
The CCur part tells Access to return the results in currency format so you see the $ and decimal points separating dollars from cents. Notice that there’s a parenthesis before CCur, which creates a general grouping around the expression here, and after CCur to close it out, as well as a set of parentheses grouping the math operation that multiplies the two different table fields.
On the toolbar, click the E (Sum) button.
Access adds a Total row. While you’ve created an expression to do the math required for your subtotal, you need to inform Access to treat it as an expression, which you’ll do next.
Click in the “Group by” listing in the Total row in your new Subtotal column, and select Expression.
If you omitted this step, it’s very likely you’ll receive an error message from Access if you try to run the query.
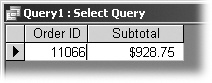
On the toolbar, click the Run button, or choose Query → Run.
Your query instantly finds the specific OrderID you’ve listed and returns your results, as shown in Figure 7-16. You have your answer—the customer tied to OrderID 11066 spent $928.75 (a nice chunk of change).
Since you probably won’t need either this query or its results again, you can close the query results window and, when prompted whether to save it, click No.
Using Expression Builder
Expression Builder (see Figure 7-17) is a special tool found on Access’s toolbar (it’s the icon with a magic wand called Build) to help you create expressions using buttons labeled for commonly used operators like greater than (>), less than (<), AND, OR, LIKE, and math operators like add (+), subtract (-), divide (/), and multiply (*).
To give you some experience using Expression Builder, you’re going to use the Northwind database again. If Northwind is still open on your Access desktop, you’re set to go. If not, reopen it by selecting Help → Sample databases → Northwind sample database.
Once you get a chance to really explore the Northwind database, you’ll notice that this phantom company sells food products, including beverages, condiments, seafood, and dairy products. Each of these has its own category ID, and most categories feature several different items. Using Expression Builder, you’re going to design two different queries:
You’ll start by creating the by-category totals using Expression Builder where you look specifically at sales totals for three categories: Dairy (Category ID 4, according to the Categories table), Meat and Poultry (Category ID 6), and Seafood (Category ID 8). Here’s the procedure:
In the Database window’s Objects bar, click Queries, and then double-click “Create query in Design view.”
For this exercise, you need to create a new query from scratch.
In the Show Tables window, select Order Details, and click Add. Next, choose Products, and click Add again. Then click Close.
When the Query Design window opens, you’ll see both tables listed above the QBE grid.
From the Products table list, drag the Category ID field down and drop it into the first Field box in the first column.
You make this selection first because your primary job here is to identify and limit your results to specific categories.
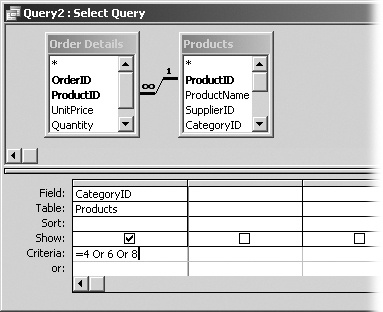
Click in the Criteria box below Category ID, and type =4 Or 6 Or 8 (see Figure 7-18).
These values correspond to the Category ID for each of the designated products you’re targeting. In targeting specific categories, you won’t include sales for other categories like Condiments, Beverages, or Produce.
Figure 7-18. Syntax with expressions and criteria can make all the difference in how you get your results. If you substituted the “And” logical operator for “Or,” the results would combine all the sales figures for each of these three categories into a single total, instead of three separate per-category totals.At the top of the second column, click the blank field, and then click the Build icon on the Access toolbar.
With this step, you’re creating a new column to display in your query results, which will list the sales totals, and opening the Expression Builder to help you in designing the expression you need to arrive at your total sales for each specified category.
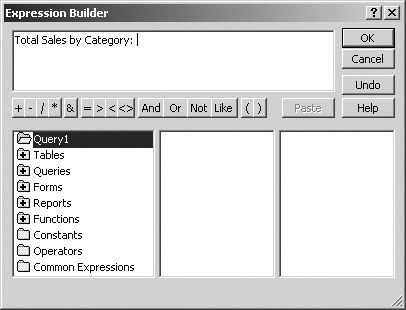
First, in the top window in Expression Builder, type the label that you’ll use for this new column: Total Sales by Category.
The colon separates the label from the expression itself.
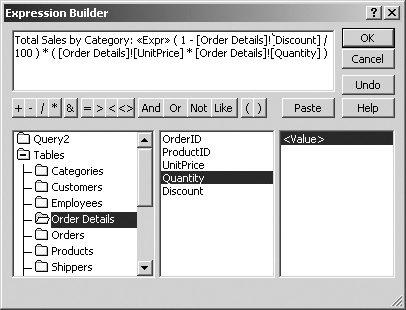
Using the labeled buttons in Expression Builder, typing where you don’t see a listed character, build this expression: (1-[Order Details]![Discount]/100)*([Order Details]![UnitPrice]*[Order Details]![Quantity]).
Access adds the brackets around tables and field names automatically when you select a field. If you need help cobbling this expression together, see the box in Up to Speed: Bracket Coverage.
Also, the reason you have the leading “1” and the division by 100 (/100) is that the Northwind database figures in discounts for certain customers buying in quantity.
Next, in the “Group by” box in the Total row beneath your Total Sales by Category column, click to open the drop-down menu, and select Sum.
When you constructed your expression, one thing you didn’t do was specify the end result of the math operation to be performed, which is the summary of all sales. Specifying Sum in the “Group by” box takes care of that.
Click Run, or select Query → Run.
The results appear, as shown in Figure 7-19. The Total Sales by Category listing isn’t formatted for currency, as it should be; the result is some wild decimal places. You’ll fix that next.
To the right of the View button at the far left of the Access toolbar, click the down arrow and choose Design view to return to the Query Design window.
This step is necessary because you can’t change the formatting of this column in the Datasheet view you see once your query runs.
Right-click anywhere in the Total Sales by Category column, and select Properties.
The Properties window opens, from which you set special conditions for the field, including the formatting.
The expression you’re building to calculate sales category totals differs from the expression you created in the last section because you have more than one table. Just as with the Zoom window, you can easily edit your expression by clicking in the box where your expression appears and inserting or deleting characters. Instead of just listing the field name, you need to add the Table name “[Order Details]” followed by the field name, like “[Discount].” Here’s how to do it.
In Expression Builder, double-click the Tables option in the first column to expand it to show all tables, and then click the table name to expand its list of fields in the second column. Next, in the second column, double-click the appropriate field to automatically add both the table name and the field name, in brackets, to the main expression window. Access automatically separates the table and field names with an exclamation mark (!), as shown here. You can also type a period between the table and field name.
Click OK when you’re done to close Expression Builder and add the newly created expression to the Field box at the top of the first column. If you close the Expression window without clicking OK, anything you’ve created there is lost.
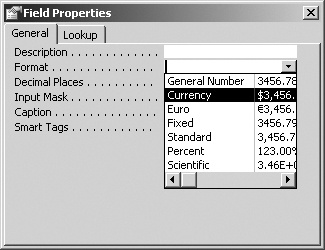
In the Properties window, click in the box to the right of Format, and select Currency (see Figure 7-20). Close the Properties window.
Access reruns your query.
Select File → Save As, and save your query with the name: Total Sales for Dairy/Meat/Seafood.
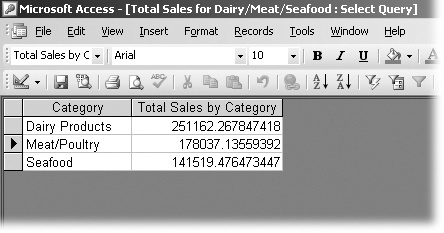
When you view your results again, you should now see the figures as they’re supposed to look, with a dollar sign and just two decimal places.
Note
Beyond changing the format choice to currency from the Properties window, you can also add the CCur specifier to the beginning of your expression, much as you did in Figure 7-14 when you created a subtotal. Either choice sets your results to display as currency.
Looking at total sales for a specific date
Here’s one more example of a calculated query that shows you both how to limit your records to those matching a specific criteria—a date in the history of the database records—and how to summarize all the sales made on that date. Again, the Northwind database lends itself to the exercise.
As you work, there’s an important point to keep in mind—one that can save you from going mad and tearing your hair out. Access, as you may have already noticed, is very finicky about syntax; it’s far fussier than any teacher you had in elementary school. Get the syntax in an expression or criteria wrong, even with a slight typo, and you aren’t going to get what you want. For example, if you use the field named UnitPrice in your expression but spell it with a space between the two words, your sales totals don’t show up.
Here, you’re going to look for and calculate all sales performed on a specific date, which, because the Northwind database has stood the test of time, happens to be February 6, 1998. When you set the criteria in the following tutorial, how you type the date will very much matter. What you set as criteria absolutely must match how the date is formatted when the records were created, which happens to display this date as 06-Feb-1998. If you type 2-6-1998, you’ll see an error message. So follow the steps exactly.
If you’ve still got Northwind open, you’re ready to go. If you don’t, reopen it from the Help → Sample Databases menu. Next, go ahead and open it up to Queries panel.
Click “Create query in Design view.”
The Show Tables window appears, right on schedule.
Select the Orders table, and then click Add. Next, select Order Details, click Add, and then click Close.
Why put two tables here? Because while most of the information you need is contained in the Order Details table, only the Order table provides the date on which the order was placed and the sale was made. Therefore, without the Order table, you can’t limit your records search to just the date.
In the Orders table list, drag the Order Date field and drop it into the empty Field box in the first column.
Next, you need to specify the order date you’re targeting. To avoid errors, remember the warning about syntax.
Click in the Criteria box below Order date and type: #06-Feb-1998#. Press Enter.
Access automatically changes the date into the more common “2-6-1998.” You’ve told Access to look only for records where sales were made or orders were placed on this date, so you’re ready to craft your expression.
Right-click in the Field box at the top of the second column, which, in your query results, will display the sales total for all orders on that date, and choose Build (another way of opening Expression Builder).
If you’ve sworn off Expression Builder, you can select Zoom instead and simply type the expression shown in the next step.
Build, or type, the following: Total Sales: (1-[Order Details].[Discount]/100)*([Order Details].[UnitPrice]*[Order Details].[Quantity]).
If you’re using Expression Builder and you get an exclamation mark rather than a period between the table name and field name brackets, that’s fine. You don’t need to change them. Click OK to close either Expression Builder or the Zoom window. Access adds your newly crafted expression to the second column’s Field box.
Click Total on the Access toolbar. With the Total row added, click in the “Group by” box in the second column, and select Sum.
You’ve just told Access to calculate all the sales together based on your formula. Ah, but remember the currency formatting problem you saw in 7? Take care of this issue before you run the query.
Right-click anywhere in the second column and choose Properties. Click inside the box to the right of Format, select Currency, and then close the Properties window. Click the Run button.
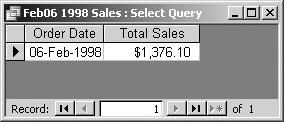
When your results appear in Datasheet view (Figure 7-21), you see the newly created column and the sales total you wanted. Congratulations!
Select File → Save As, and rename this query from its default name to: Feb6 1998 Sales.
Figure 7-21. Here, you’re seeing just a single date and its sales total. But you could create a single query that lists sales totals for a number of different dates, much as you did in creating the sales totals for the different product categories in ???.
Actually, that last step isn’t absolutely necessary. But if you save the query, you can go back and look at your query details when you’re puzzling out your own expressions and query setup for the customized queries you design for your own databases.
Obviously, you can create many more types of queries—either from scratch or using one of the Access query wizards. The ones covered here just begin to scratch the surface of the possibilities. Hopefully, however, you have a good sense of how you can customize your queries and add calculations to your results, so you can take what you learned here and build on it for your unique circumstances.
In the next chapter, you’re going to pick up where you left off by taking your questions and answers and turning them into a prime-time presentation in the form of reports that you can readily share with fellow team or committee members, your boss, or even the loan manager at your local bank (you know, the one you’re trying to impress with your track record or project planning into giving you a business loan).