

Introduction to the IBM Problem Determination Tools
In this chapter, we introduce the following IBM tools that support application development on System z®:
•Application Performance Analyzer for IBM z/OS
•Debug Tool for z/OS and Debug Tool
•Fault Analyzer for z/OS
•File Manager for z/OS
•Workload Simulator
•IBM CICS Explorer and IBM IMS Explorer
•IBM Rational Developer for System z
These tools provide you with a comprehensive suite of products that can help improve application delivery and enhance production availability and performance.
1.1 Introduction
At the turn of the 21st century, IBM entered the problem resolution tool space for z/OS for the following reasons:
•To provide IBM customers with an alternative to excessively priced tooling for z/OS that were offered by independent software vendors (ISVs)
•To provide superior tooling in the problem resolution space
With more than 12 years in the market, we are confident to say that we accomplished both of these goals.
In this publication, we describe the following core IBM Problem Determination (PD) Tools (as shown in Figure 1-1 on page 3):
•IBM Application Performance Analyzer for z/OS
•IBM Debug Tool for z/OS
•IBM Fault Analyzer for z/OS
•IBM File Manager for z/OS
•IBM Workload Simulator
We consider their use when used with the PD Tools from a PD Tools Studio perspective, from a systems programming perspective with CICS Explorer and the IMS Explorer, and from a robust application development perspective with the Rational Developer for System z. These tools, together with the different GUI alternatives, provide a comprehensive set of problem determination tools to help improve application delivery throughout the application lifecycle.

Figure 1-1 Problem Determination Tool V12
These tools help increase productivity and IT effectiveness across debugging, application abend analysis, data management, application-performance analysis, and the simulation of thousands of applications and users that drive your environment. IBM Problem Determination Tools do much more than support traditional applications. The tools also feature capabilities that you can use to build service-oriented applications. The tools also support and make the most of the latest subsystem levels and languages.
The IBM Problem Determination Tools provide support for all of the major IBM subsystems. Day one support is available for any new IBM z/OS subsystem release.
As businesses and the critical IT systems that support them grow increasingly complex, application developers are constantly struggling to meet the demands that are placed upon them. The use of service-oriented architecture (SOA) is widely accepted in IT because it fulfills the promise of helping to address these demands. The ability to reuse existing assets is the cornerstone of SOA. This possibility is significant because reusing assets can be less expensive than rewriting them. With the vast amount of existing applications that is running on the IBM System z platform, it makes sense that z/OS applications can be an important part of SOA.
1.2 IBM Application Performance Analyzer for z/OS
Application Performance Analyzer for z/OS helps programmers and systems personnel to identify constraints and improve the performance of their applications. It is a non-intrusive performance analyzer that helps you during the design, development, production, and maintenance cycles.
The key function of the product is to measure and report on how system resources are used by applications that are running in a z/OS address space, such as Time Sharing Option (TSO) and batch, and online subsystems. Examples of these subsystems include IBM IMS, Customer Information Control System (CICS), IBM WebSphere® Application Server, and IBM DB2® stored procedures.
You can monitor applications in test and production, and in multiple source languages, including Assembler, C/C++, COBOL, PL/I, and Java. Optimized code support for COBOL and PL/I is provided so you can monitor production applications.
The use of Application Performance Analyzer helps you maximize the performance of your existing hardware resources and improve the performance of your applications and subsystems. You can evaluate applications in the development and system test phases. You also can review the effect of increased data volume or changes in business requirements on performance, and generate historical data and reports to analyze performance trends and evaluate program changes.
Running in a separate address space, Application Performance Analyzer non-intrusively collects resource utilization, wait time, and statistical samples from the address space that is being monitored. This data is then analyzed and documented. The reports that are generated help you to identify the key performance bottlenecks that require examination and resolution. This data is available online and in printed reports that you can choose to create as PDF files for viewing on a workstation.
1.2.1 Application Performance Analyzer for z/OS V12.1
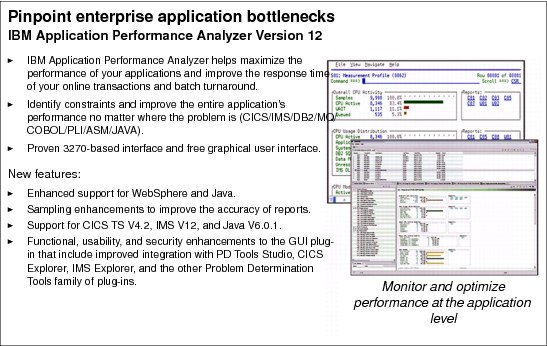
Figure 1-2 IBM Application Performance Analyzer V12
When integrated with Application Performance Analyzer for z/OS (see Figure 1-2) and CICS Explorer, the IBM Application Performance Analyzer Plug-in for Eclipse encompasses the Observation Request and Reporting functions. The plug-in GUI can be used for submitting new observation requests and for navigating the performance analysis reports that are generated from observation requests. The plug-in GUI can display and provide functions to multiple components of Application Performance Analyzer simultaneously.
1.2.2 Subsystem support
In this section, we describe the following subsystem support topics:
•CICS
Support for IBM CICS Transaction Server enables you to monitor specific CICS transactions by using wildcard transaction prefixes or by termID selection. With this support, you can trace transactions during critical situations, rather than waiting to review data that is collected periodically. Java application code that is running in the Java 2 Platform, Standard Edition (J2SE) environment under CICS Transaction Server is also supported. Multiple CICS regions can be measured simultaneously, and transaction data from these regions are merged to produce a set of CICS reports that show multi-region activity.
•DB2
Support for DB2 delivers relevant information for performance analysis and tuning. This information includes SQL statements and processor usage by SQL statements and for IBM DB2 stored procedures that are written in a traditional language or in Java.
•IMS
Support for IMS applications means that you can have IMS application performance data-on-call time and service-call time for Data Language Interface (DL/I). You can also choose to trace all IMS calls. A specific IMS transaction in a single IMS subsystem can be measured when it can run in multiple MPP regions.
•WebSphere MQ
WebSphere MQ support provides information about CPU usage by queue, request, and transaction. Application Performance Analyzer also provides service time by queue, request, transaction, and wait time for the same categories.
•ADABAS/Natural
Support is provided for sampling and reporting on ADABAS calls, if ADABAS=YES is set in the CONFIG SAMPLE statement. When a sampling request is created, an ADABAS extractor is presented if this configuration change is complete.
1.2.3 Java support
When enabled, the Java data extractor collects Java call stack information for each Java application thread. The call stack information identifies the methods in the call chain. Information about each method includes the package (if any), class, method, signature (parameter types and return type), and the source line number that is being executed (if available).
The generated reports include a summary, CPU usage, service times, and wait times.
HFS data is also collected and reported, if the Java data extractor is selected.
1.3 IBM Debug Tool for z/OS
IBM Debug Tool for z/OS provides debugging capability for applications that are running in various environments, such as IBM CICS, IBM IMS, IBM DB2 stored procedures, and IBM UNIX System Services. Debug Tool also includes features to help you identify old OS/VS and VS COBOL II source code and to upgrade the code to IBM Enterprise COBOL. These features meet the requirements of IBM DB2 Universal Database™ for z/OS, Versions 8 and 9, and IBM CICS Transaction Server for z/OS, Versions 3 and 4.
To effectively build and service applications, you require robust, easy-to-use tools to compile, test, and debug them. IBM Debug Tool for z/OS software provides a complete solution that can help you to reduce application development cycle times.
1.3.1 IBM Debug Tool for z/OS highlights
In this section, we describe the following highlights of the IBM Debug Tool for z/OS, as shown in Figure 1-3 on page 8:
•The IBM Debug Tool Plug-in for Eclipse, when integrated with Debug Tool for z/OS and CICS Explorer, debugs z/OS-based load modules that are running on z/OS. These load modules include modules that run in a subsystem, such as CICS, DB2, or IMS. You access the debugging capability that is similar to the capability that is accessed by the host full-screen interface by using the plug-in GUI interface. With this access, you can perform the following tasks:
– Set and clear breakpoints at a specific line
– Set and clear breakpoints for an error or warning-level error that is based on IBM Language Environment® severities
– Run to a breakpoint
– Step into a procedure
– Step over a procedure
– View variable values and change them as you step through the code
– View variable values in the context of a larger area of storage
– View the call stack
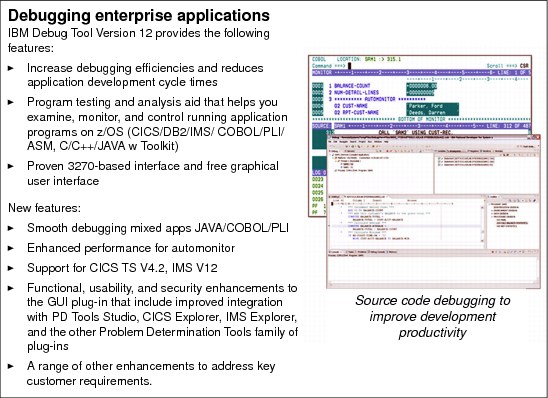
Figure 1-3 IBM Debug Version 12
1.3.2 Support for IBM subsystems
Debug Tool works with individual load modules, independent of the subsystem in which they are running. Thus, Debug Tool provides functionality that can cross subsystems and languages on your z/OS system.
1.4 IBM Fault Analyzer for z/OS
Fault Analyzer for z/OS provides the information that you require to determine the cause, and assist with the resolution of, application and subsystem failures. You can use this tool to assist with composite-application abend analysis. The tool helps you repair failures quickly by gathering information about an application and its environment at the time of failure.
1.4.1 IBM Fault Analyzer for z/OS V12.1 highlights
The IBM Fault Analyzer Plug-in for Eclipse, when integrated with Fault Analyzer for z/OS and CICS Explorer, provides access to problem reports for diagnosing mainframe application errors and abends, as shown in Figure 1-4.
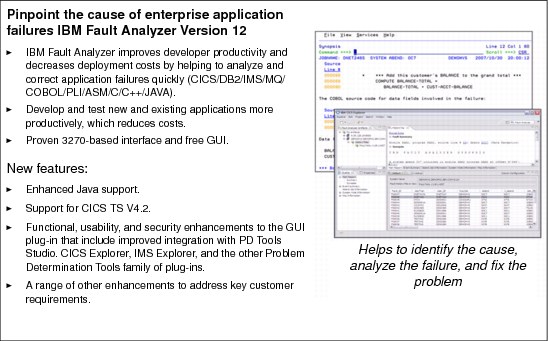
Figure 1-4 IBM Fault Analyzer
•IBM Fault Analyzer for z/OS includes the following key features:
– An interface to manage views and multiple fault history files
– The ability to browse fault entries that were created during real-time analysis of abending programs
– A browser for browsing the dump storage that is associated with a fault entry
– A source listing of abending programs that use side files
•IBM Fault Analyzer for z/OS includes the following Java support enhancements:
– Integration of Java stack trace information into the Fault Analyzer event list
– Java source support in which Java source is included in the abending JAR file
When an application abend occurs, Fault Analyzer captures and analyzes real-time information about the application and its environment. An analysis report that details the cause of the failure is then generated. The report describes the failure in terms of the application code, so you no longer lose time by reviewing cumbersome, low-level system error messages. By using Fault Analyzer, you can choose a report format to locate the information easily.
Each application abend is recorded by Fault Analyzer in a fault-history file by job name, failure code, and other details. The analysis report and storage pages that are referenced during the analysis also are included. This information can be later retrieved to reanalyze the failure.
Through the inclusion of information that is taken from selected manuals, Fault Analyzer can extract message and failure-code descriptions and insert them into the analysis report where applicable. You can also provide your own descriptions for messages.
You also can write your own user exits. For example, you can write a user exit to access compiler listings that are compressed or available only through a proprietary access method.
Integration through a GUI interface allows application developers to work with fault entries directly from their development environment.
1.4.2 Support for IBM subsystems
In this section, we describe the following topics in support of IBM subsystems:
•CICS
Fault Analyzer functions are available from within the CICS transaction-based environment in a manner that is consistent with the ISPF usage. You can review and analyze fault entries in history files without the need for a TSO logon.
Fault Analyzer provides general information about a CICS region and details of control blocks, transaction storage, the last screen buffer, the trace table, and an explanation of the CICS abend code.
The ability of Fault Analyzer to detect and analyze dump formatting and storage violations is helpful for system programmers who debug CICS system problems. Options are provided to speed the processing of duplicate dumps and to skip analysis of repeated abends.
•DB2
Details of the last SQL activity are provided. Plan and package information also is included.
•IMS
Fault Analyzer provides general information about an IMS region, details of the last DL/I call parameter list, information for all PCBs in the order of their relative PCB number and, if available, JCB call trace information. IMS accounting information also is provided.
You can eliminate the overhead of duplicate IMS faults that occur across all IBM MVS™ images in a sysplex.
•WebSphere MQ
API information and return-code diagnostic procedures are provided to help with problem determination of WebSphere MQ applications.
1.4.3 Java support
When Fault Analyzer is started from within a Java application, abending traditional programs (COBOL, PL/I) can be analyzed.
A feature unique to the interactive component of Fault Analyzer is the ability to analyze information that is related to Java. The Java execution might be under WebSphere, CICS, or UNIX System Services on MVS. Typically, the environment is Java calling legacy programs. How to perform the following tasks is explained in the User’s Guide and Reference manual:
•Set options for Java analysis
•Select a Java dump data set for analysis
•Display the resulting Java information in the interactive report
•Create a history file entry for the analyzed dump data set
1.4.4 Analysis options
Fault Analyzer provides three modes to help you better track and analyze application and subsystem failure information. Reports that are generated can be viewed through the SDSF or through the Fault Analyzer ISPF, CICS Explorer, or Rational Developer for System z interface.
Real-time analysis
When an application failure occurs, the Fault Analyzer exit starts real-time analysis. After failure processing, you can view the analysis report in your TSO session or in a printed report.
Batch reanalysis
Batch reanalysis generates a new analysis report. This report is based on the dump and information that is gathered in real time, but with potentially different options that are specified, or with compiler listings or side files that are made available. You can submit a Fault Analyzer batch-mode job by using the Fault Analyzer ISPF or your own job control language.
Interactive reanalysis
Interactive reanalysis runs under ISPF and CICS, which you use browse through a formatted, structured view of a fully detailed reanalysis. By using this Fault Analyzer mode, you can view working storage and control blocks at the time the dump was written. The interface has many point-and-click fields for easy navigation through the interactive reports.
1.5 IBM File Manager for z/OS
File Manager for z/OS offers comprehensive tools for working with z/OS data sets, CICS resources, DB2 data, and IMS data.
Extending the standard browse, edit, copy, and print utilities of ISPF, File Manager features tools that support personnel find useful. It also delivers enhancements that are designed to address the requirements of application developers who are working with files that contain structured data. Also, because the basic features of the File Manager editor and the ISPF/PDF editor are deliberately almost identical, you can take advantage of extra features without having to relearn fundamental skills.
File Manager includes the following components:
•A base component to manage z/OS data sets, such as queued sequential access method (QSAM), VSAM, partitioned data sets (PDS), and IBM z/OS UNIX System Services hierarchical file system (HFS) files
•A DB2 component to manage DB2 data
•An IMS component to manage IMS data
•A CICS component to manage data in CICS VSAM file resources, transient data queues, and temporary data queues
|
Important: You install only the components that are relevant to your environment.
|
1.5.1 IBM File Manager for z/OS V11.1 highlights
With File Manager V12.1 (see Figure 1-5), many more capabilities were added. The Problem Determination Tools Studio and the IMS Explorer for invocation of mainframe FM product was added to the capabilities that are provided by CICS Explorer and Rational Developer for System z.
In addition, the Eclipse-based File Manager DB2 support and CICS support was added in Version 12. IMS Version 11.1 support also was added to the mainframe FM product. Many other functions and capabilities also were added to File Manager V12.1.

Figure 1-5 IBM File Manager
1.5.2 File Manager base component
The File Manager base component helps speed the application-development process by identifying the structure of your records and displaying each field in a human readable format, according to its data type.
This component supports VSAM, including Tivoli® Innovation Access Method files; QSAM, PDS, and WebSphere MQ queues; and z/OS UNIX System Services hierarchical file system (HFS) data sets, including support for double byte character set (DBCS) data in these data sets.
You can edit entire files (regardless of size) and use a template or copybook for formatting and record selection during an edit or browse session.
1.5.3 Support for IBM subsystems
In this section, we describe the following topics in support of IBM subsystems:
•CICS
Users can manage or query data in CICS VSAM file resources, transient data queues, and temporary data queues. The File Manager for CICS feature allows access to CICS resources under a CICS transaction. The CICS resources that are supported for view, edit, and certain File Manager utilities (such as data create, copy, and compare) are VSAM files, temporary storage queues, and transient data queues.
You can authorize users to view and change the status of supported local and remote CICS resources and perform File Manager base and File Manager IMS tasks from the File Manager CICS transaction.
The same display and record selection capabilities are present in the CICS environment as are in the BASE product, which provides for quick easy access to CICS data. Users also can create full copies of open CICS files (or TS or TD queues) to another QSAM, VSAM, HFS, or PDS file.
Most of the File Manager functionality that is related processing happens offline to the CICS task. Thus, File Manager runs little risk of adversely affecting other CICS users, even when an entire file is copied somewhere else, for example.
File Manager for CICS maintains the same look and set of editor commands that you might be familiar with in an ISPF environment. It is not necessary to log out of your CICS environment to log on to your ISPF, if you want to use the File Manager BASE or IMS components.
•DB2
Whether you are a DB2 DBA, application programmer, or want to retrieve information that is stored in a DB2 database, the File Manager DB2 component provides something for you.
Included are database management abilities (such as creating and dropping objects, copying data within DB2, handling privileges, and import/export). There is an editor for DB2 tables and views (in read-only or update mode), which encompasses all of the common Insert, Delete, and Update functionality that is often required in a database application.
Full tables, views, or the results of a limited SQL query that you customized are provided (including the ability to save the query you made) in a File Manager template.
If you are writing SQL to be used in your applications, another handy use of File Manager is the ability to refine and test an SQL query by the prototyping and analysis feature, which includes an explanations feature.
Getting data out of, or back into, DB2 to or from QSAM or VSAM files also is provided for by a powerful utility. DB2 data can be exported in the following formats:
– The external format that is used by the DB2 UNLOAD utility.
– The format that is used by the DB2 sample unloads program DSNTIAUL.
– A File Manager export format that can be tailored with multiple options to control the handling of NULL values and options for various column data types.
– A delimited text format, such as comma-separated value output.
You also can generate batch JCL for the most commonly used DB2 utilities to save time.
•IMS
With File Manager’s IMS component, it is easy to access data that is stored in an IMS database. Although the database storage concepts are different from DB2, File Manager delivers a similar look when your data us viewed or edited. Also, creating and saving customized queries is as easy as using the other components.
By using record structures that are defined in COBOL or PL/I copybooks (similar to the BASE component), the File Manager IMS component enables you to view or edit IMS segments that are displayed with formatting according to their individual field data types. You can find and change data across an entire database hierarchy or in specified segments and fields.
Data displays for IMS always include the segment name to help you identify where you are in the database. This feature is useful when you are viewing a large result set or an entire hierarchy.
Database navigation commands are available with flexible parameters and scoping to allow selective navigation or applicability, or a more generic approach, depending on your requirements.
You can use flexible criteria to select IMS database segments that contain specific field values and extract the segments into a sequential data set for later use. You also can use the IMS component to load them into a different database.
•WebSphere MQ
From within File Manager, you can access WebSphere MQ queues on the local z/OS system where File Manager is running. From the Primary Option Menu panel, select option 9, WebSphere MQ. File Manager then displays the WebSphere MQ Functions panel, from which you can perform the following tasks:
– List managers and queues
– View a WebSphere MQ queue
– Edit a WebSphere MQ queue
1.5.4 Java support
File Manager can access an HFS file as a simulated QSAM/BSAM file. This access means that at the I/O level, the file is seen as a single-volume, physical, sequential data set that is on a direct access storage device.
1.5.5 SOA support
By using File Manager, you can generate XML data from files. A File Manager template that describes the data-record layouts is required. The XML tags are generated based on the field names from the template, and the XML content comes from the data. A number of options are provided for handling invalid and unprintable data.
File Manager provides a plug-in for integration with Rational Developer for System z, allowing all aspects of web-service (and traditional application) development to be undertaken from the same developer tool.
File Manager provides a scrambling algorithm that modifies data in a field and maintains its system data type. Scrambling is intended to de-identify (disguise) personal information in different ways for different data types. The goal of repeatable scrambling is that application relationships that are based on equality tests can be maintained, if wanted, even after the data is scrambled. A number of standard algorithms are provided to give the user complete control over the type of scrambling performed.
1.6 Workload Simulator
IBM Workload Simulator (as shown in Figure 1-6) simulates terminals and the associated messages. The user also can alter message loads during a run. It can be used to generate a large volume of messages to evaluate the reliability and approximate performance characteristics of a network under expected operating conditions. Anything that a real user can do at terminal, Workload Simulator can do faster, more reliably, and often at less cost.
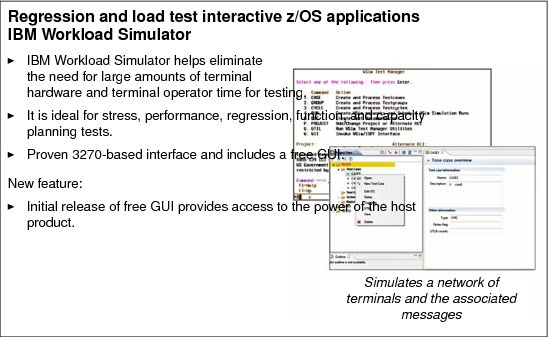
Figure 1-6 IBM Workload Simulator
IBM Workload Simulator includes the following benefits and features:
•Helps prepare your networks for peak transaction volumes.
•Enables testers to conduct reliable tests on stress, performance, and capacity and regression and function tests.
•Simulates different terminals, terminal features, and terminal operator actions.
•Provides support for enhanced TCP/IP support, SNA, and CPI-C (LU 6.2).
•Helps manage the test process.
•Offers several options for creating scripts to use in simulations.
•Provides screen images, data, and reports during simulation.
•Helps testers compute and analyze test results.
You can run Workload Simulator on MVS in batch mode as a procedure by using the Workload Simulator/ISPF Interface, or under TSO.
1.7 IBM Problem Determination Tools Studio
With Version 12 of the PD Tools, the Problem Determination Tools Studio (as shown in Figure 1-7 on page 17) has arrived. This self-contained, downloadable application was designed for customers who must use our unified Eclipse-based plug-ins in problem determination-specific environments. We are excited about being able to offer our customers an alternative interface to the traditional 3270, or green screen interface. The PD Tools Studio is available to any licensed customer of our mainframe Problem Determination Tools products at no additional charge. The following Eclipse interfaces are included in the downloadable application:
•Application Performance Analyzer
•Debug Tool
•Fault Analyzer
•File Manager
•Workload Simulator
In addition to the plug-ins, simple editing, submission capabilities, and Job Entry Subsystem (JES) access are available. A common server and common login capabilities are also provided to any sanctioned PD Tools Studio user.
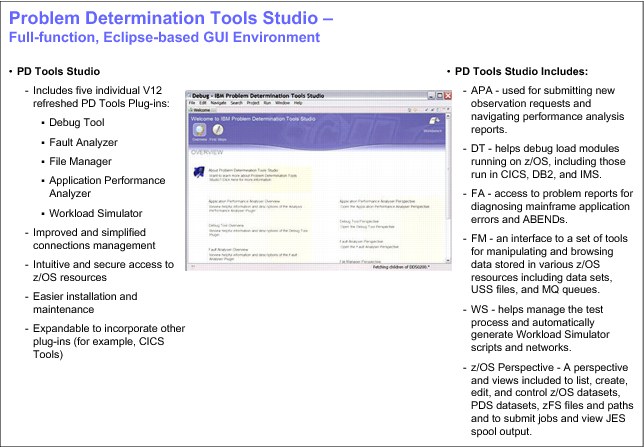
Figure 1-7 Problem Determination Tools Studio
1.8 CICS Explorer and IMS Explorer
With Version 12 of the PD Tools, several updates and new capabilities are provided for systems-related programmers and developers.
The Problem Determination Tools plug-ins (as shown in Figure 1-8 on page 18) evolved and is used with the CICS Explorer, and CICS TS 3, 4, and the latest CICS TS 5.1. The addition of the ability for PD Tools plug-ins to be used with the new IMS Explorer is another great advancement.
As with the PD Tools Studio, editing and submission capabilities, JES access, a common server, and common login capabilities are available to any sanctioned CICS or IMS user. The plug-ins also are available to any licensed holder of the PD Tools mainframe-equivalent Application Performance Analyzer (APA), Fault Analyzer (FA), File Manager (FM), Debug Tool (DT), or Workload Simulator (WSIM) products (as shown in Figure 1-8).
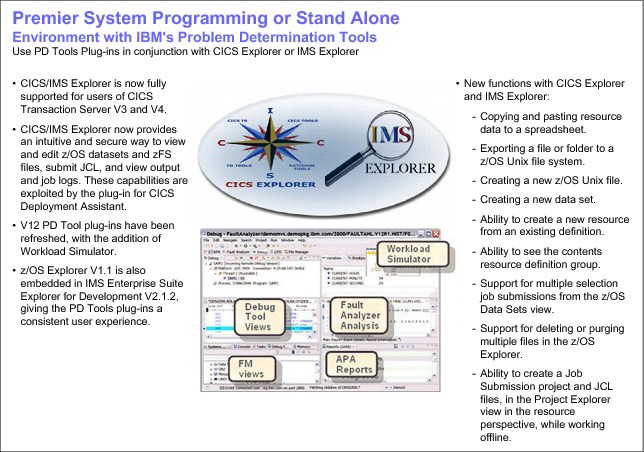
Figure 1-8 CICS Explorer, IMS Explorer, and PD Tools Plug-ins
CICS Explorer, first introduced in 2009 as the new face of CICS, provides an integration point for CICS tooling with rich CICS views, data, and methods. CICS Explorer includes the following features:
•A common, intuitive, Eclipse-based environment for architects, developers, administrators, system programmers, and operators.
•Task-oriented views provide integrated access to a broad range of data and control capabilities.
•Powerful, context-sensitive resource editors.
•An integration point for CICS TS, CICS Tools, CICS Transaction Gateway, the IBM Problem Determination Tools, and Rational Tools.
•Extension by independent software vendors, system integrators, and customers by using the Java Software Development Kit.
The CICS Explorer code is downloadable for free from the CICS Explorer website:
|
Important: This code is refreshed approximately every three months.
|
IMS Enterprise Suite Explorer for Development
Information Management System (IMS) Enterprise Suite Explorer for Development (IMS Explorer for Development) is the new face of IMS. It is a simple, no-charge, essential tool with which you complete common application development tasks with ease.
If you are an IMS application developer or database architect, you benefit from IMS Explorer's lightweight, powerful, extensible framework, which seamlessly integrates with your other Eclipse-based tools. With IMS Explorer, you can perform the following tasks:
•Integrate with the IMS catalog and simplify your application tasks.
•Quickly and easily model, display, and edit IMS database and program definitions.
•Use new structure and array types that are accessible because of IMS catalog support.
•Simplify segment mapping.
•Gain a relational view of IMS data.
•Securely and intuitively view and edit z/OS data sets and z/OS UNIX files, submit JCL, and view output and job logs.
•Build SQL statements to use with IMS data.
•Use rich GUI controls and context-sensitive help.
The IBM CICS Explorer code is downloadable for free from the CICS Explorer website:
1.8.1 Support for the IBM Problem Determination Tools
The IBM Problem Determination Tools plug-ins, when used with CICS Explorer, provide easy access through a GUI on the workstation to the power of the following host IBM Problem Determination Tools:
•Application Performance Analyzer for z/OS
•Debug Tool for z/OS
•Fault Analyzer for z/OS
•File Manager for z/OS
•IBM Workload Simulator for z/OS
Plug-ins for each of these tools are available for download for free from this website:
1.8.2 Support for CICS Tools
The following CICS Tools are supported through plug-ins to CICS Explorer:
•Configuration Manager
•Interdependency Analyzer
•Performance Analyzer
•IBM Session Manager
For more information about these plug-ins, see the CICS Tools website:
To download the plug-ins, see this website:
1.9 Rational Developer for System z
Rational Developer for System z speeds the development of traditional mainframe, web, and composite applications. Built on an Eclipse platform, Rational Developer for System z lends itself readily to integration with IBM and non-IBM products, as shown in Figure 1-9.

Figure 1-9 Premier Environment for Application Development
1.9.1 Support for IBM Problem Determination Tools
In this section, we describe the IBM Problem Determination Tools.
Debug Tool
COBOL and PL/I applications, EGL applications, and Java applications can be debugged through a common interface by using the local debugger. The remote debugger supports debugging of code that runs in the following z/OS environments:
•Batch
•TSO
•CICS
•IMS (IMS Database Manager and IMS Transaction Manager), with or without Batch Terminal Simulator (BTS)
•DB2 (including stored procedures)
•WebSphere Application Server
The debugging sessions are cooperative, meaning that the remote distributed debugger is on the workstation and interfaces with the IBM Debug Tool, which runs on the host with your application. The workstation interface communicates with the host z/OS products through TCP/IP.
Fault Analyzer
Fault Analyzer (FA) integration allows users to perform the following tasks:
•Browse FA abend reports
•View dump selections that are related to abends
•Annotate reports for future reference or to share comments with other users who browse the same reports
File Manager
File Manager (FM) integration enables access to perform the following tasks:
•VSAM KSDS files for browsing and updating
•Template-driven display of VSAM, PDS members, and sequential file data
1.9.2 Remote compile generation
With remote editing, compiling, and debugging, you can develop or enhance many types of applications, including CICS, batch, TSO, or IMS Transaction Manager applications. These applications can access many forms of data, such as DB2, VSAM, DL/I, and QSAM data. You can save time by editing, compiling, and debugging host applications remotely. When host files are edited, compiled, and debugged from the workstation, you work in a cooperative Windows and TCP/IP-based development environment, which avoids lengthy downloads and uploads unless explicitly wanted.
1.10 IBM Problem Determination Tools GUI options summary
IBM offers its customers alternative GUI interfaces and GUI technologies in addition to the traditional 3270 or green screen, which IBM continues to progress. For users who want to use the PD Tools in a unified Eclipse-based problem determination environment, the Problem Determination Tools Studio can address your needs as shown in Figure 1-10. Customers who must use the Problem Determination Tools in a full Eclipse-based application development environment can take advantage of the PD Tools plug-ins with Rational Developer for z. However, if you would like to use the PD Tools plug-ins in systems-related environment, you can use the tools with the CICS Explorer or IMS Explorer. All alternative interfaces give you easy access to the host systems PD Tools, such as Application Performance Analyzer, Debug Tool, Fault Analyzer, File Manager, and Workload Simulator through a GUI on the workstation.
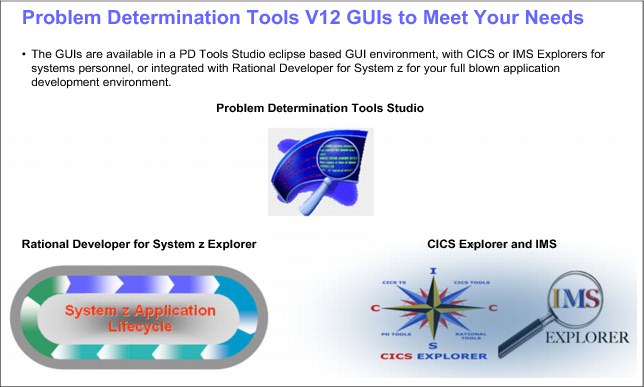
Figure 1-10 Problem Determination Tools V12
When the plug-ins are used with PD Tools Studio environment, CICS Explorer, or IMS Explorer, no additional charge is required if the customer is licensed to one or more of the PD Tools mainframe products.
With the PD Tools Studio, Rational Developer for z, and the CICS/IMS Explorer interfaces, IBM is giving customers several alternatives to meet your unique enterprise needs.
1.11 IBM Problem Determination Tools in summary
IBM Problem Determination Tools includes the following applications:
•Application Performance Analyzer
•Debug Tool
•Fault Analyzer
•File Manager
•IBM Workload Simulator
These tools, along with CICS Explorer and Rational Developer for System z, are designed to help ease the burden of developing, testing, and supporting service-oriented and composite applications across complex IBM System z environments.
By helping to improve application delivery throughout the application lifecycle, these tools provide increased user productivity and IT effectiveness across source code debugging, application-abend analysis, data management, and application-performance management.
System z tools, including the Problem Determination Tools, CICS Tools, and application development tools, support the entire application lifecycle to help you build, integrate, test, and manage enterprise solutions. As a result, you can make the most of your System z platform investments and expedite your move to SOA. With these tools, you also can transform your applications and optimize your IT operations to achieve greater business flexibility, without affecting governance and compliance.
..................Content has been hidden....................
You can't read the all page of ebook, please click here login for view all page.