
Interfaces with IBM Problem Determination Tools: 3270
In this chapter, we provide an overview of the interfaces that are available for interacting with the IBM Problem Determination Tools through a 3270 display.
3.1 Problem Determination Tools interfaces: Overview
In this section, we describe the Problem Determination Tools interfaces and features that are available.
3.1.1 ISPF
To use the Problem Determination Tools with Interactive System Productivity Facility (ISPF), you must ensure that the appropriate data sets are allocated. You must also ensure that one or more ways to start each of the installed products are provided.
3.1.2 CICS
Fault Analyzer and File Manager can be started under the Customer Information Control System (CICS).
Fault Analyzer
Fault Analyzer uses a component to display ISPF panels that can allow it to operate as a CICS transaction to view history files and perform interactive reanalysis. This capability under CICS does not use TSO. It is primarily intended for users who might not have TSO logon capability on an MVS image, but must review and analyze history file information about that MVS image. The appearance of the display is similar to that of the equivalent ISPF display.
File Manager
File Manager for CICS (FM/CICS) is a powerful set of utility functions for editing, browsing, printing, and altering the status of CICS resources. The CICS resources that are supported are files, temporary storage queues, transient data queues, and data tables. If you have the authority, you can also modify the status of the CICS resources. FM/CICS incorporates much of the functionality of File Manager for z/OS (base) into the CICS environment.
3.2 Getting started
For most customers, starting a Problem Determination Tools session is done through menu selection from an ISPF panel. The option of using a TSO command also is available.
3.2.1 Application Performance Analyzer
In this section, we describe the features of the Application Performance Analyzer (APA).
ISPF
Figure 3-1 shows the Observation List panel, which is the initial window of the APA. Existing entries, which were previously stored in the Measurements data set, are displayed; by default, the most recent entry is at the top. The list can be reordered and filtered (often by owner ID). From this panel, you can perform the following tasks:
•Schedule a new measurement session, for a running or future job
•Review previously collected measurements
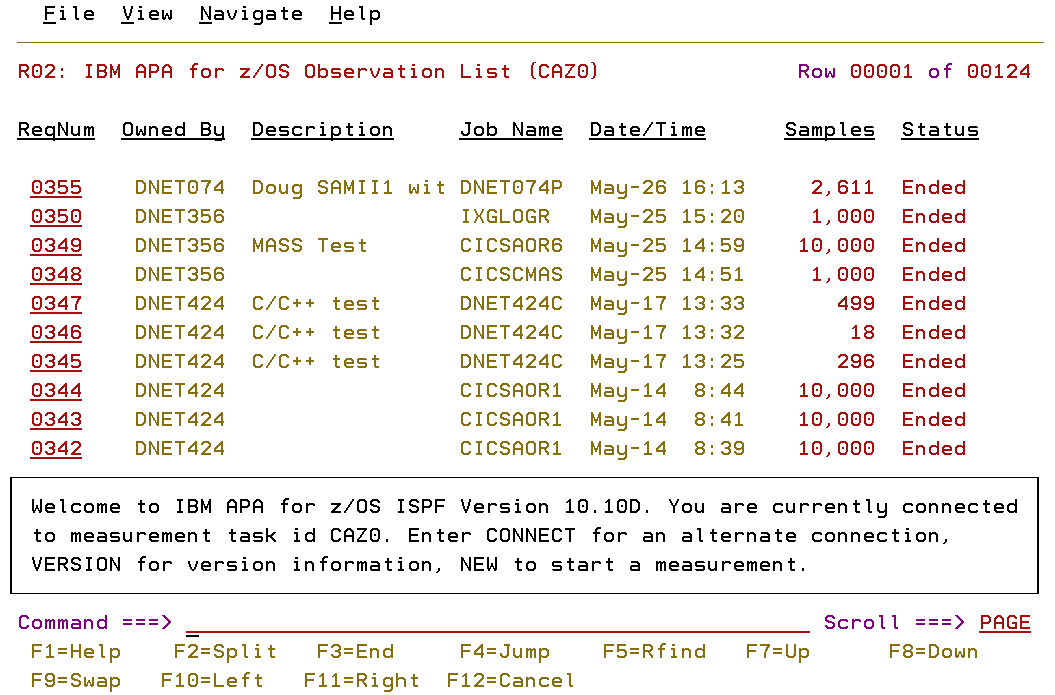
Figure 3-1 Initial APA display
Use the SHOW and HIDE primary commands to display and hide the full list of commands that are available.
Entering a “/” in the column on the left of one of the line entries causes a window to show that contains a list of all the line commands you can use for that entry. You also can select the commands from the list.
CICS
There are no CICS considerations for the APA.
3.2.2 Debug Tool
In this section, we describe the features of the Debug Tool.
ISPF
Debug Tool features a number of utilities, which are listed in the initial window upon selecting Debug Tool from your ISPF display, as shown in Figure 3-2.
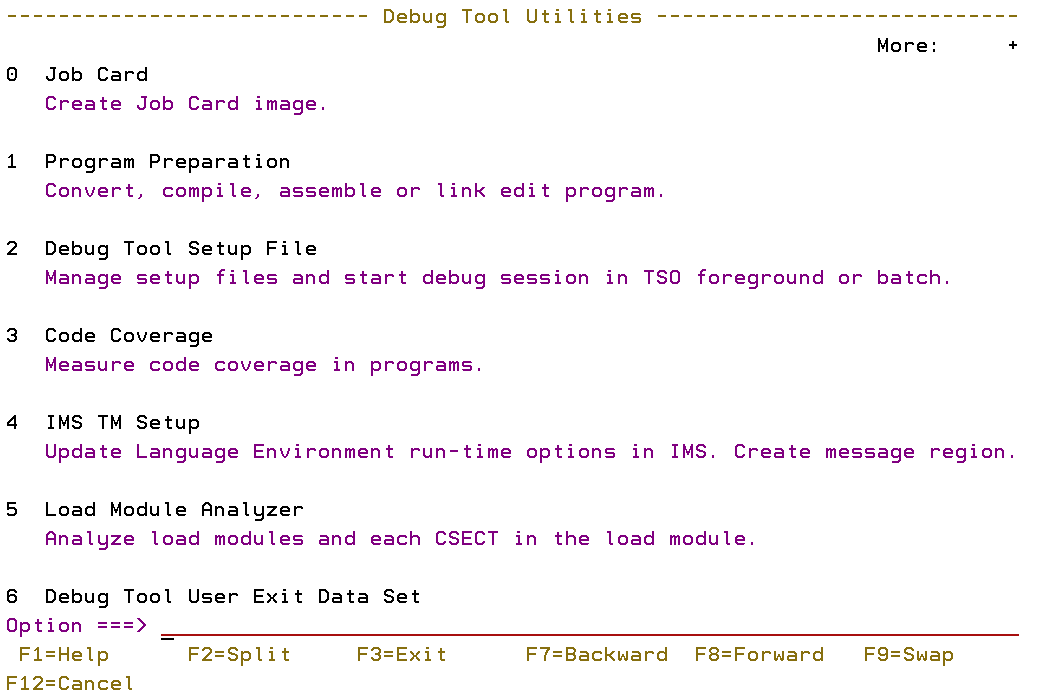
Figure 3-2 Utilities selection
An actual debug session is not started from an ISPF menu selection. The options that are selected when a program is compiled and when it is run control the start of a debug session.
Figure 3-3 on page 51 shows the initial display that is shown when a debug session is entered. It provides an interactive interface that includes the following windows that enable single-step debugging, dynamic patching, and breakpoint setting:
•A monitor window shows the status of items you select, variables, and registers. You can view, monitor, and alter application variables or storage in real time.
•A source window shows the program code and highlights the statement that is run. In the prefix area of this window, you can enter commands to set, display, and remove breakpoints.
•A log window records and shows your interactions with Debug Tool and can show program output. The information that you see in this window is included in the log file.
•By using the memory window (which is swappable with the log window), you can show and scroll through sections of memory. You also can update memory by replacing existing data with new data. The memory window tracks addresses for easier navigation.
By using the Debug Tool source window (as shown in Figure 3-3), you can monitor application code while an application runs. You also can debug applications that are written in a mix of COBOL, C, C++, PL/I, or Java languages without leaving the tool. You can include Assembler programs in this mix and, by using the disassembly view, you can debug programs that are compiled with the NOTEST compiler option or applications that include other languages. You also can use commands to dynamically patch or alter the value of variables and structures and control the flow of an application.
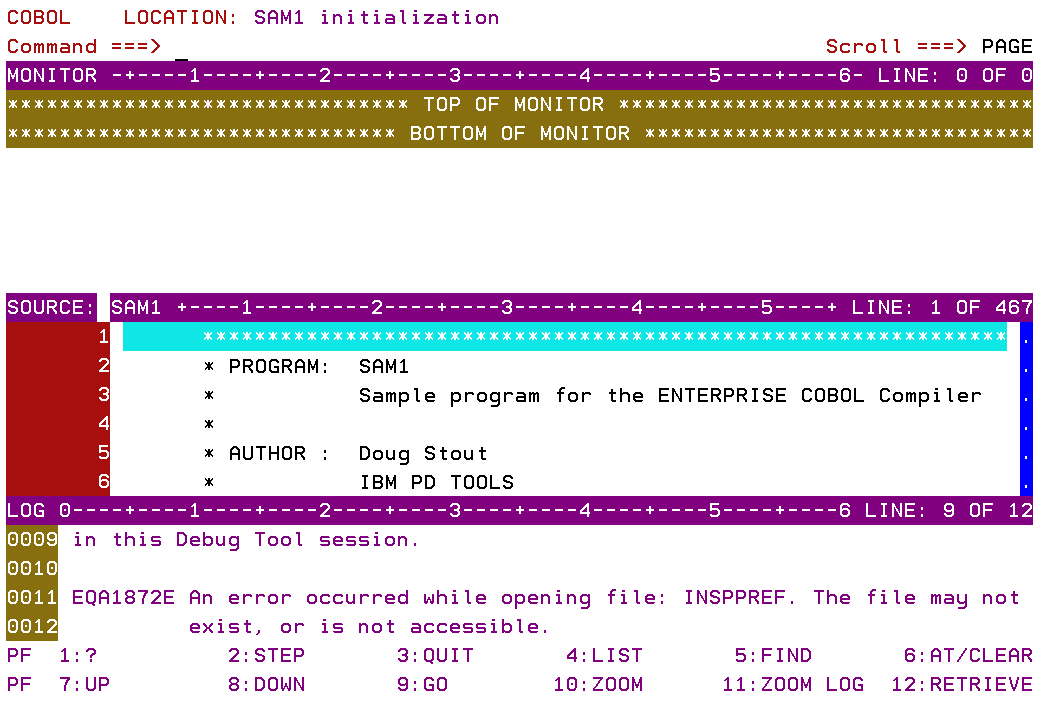
Figure 3-3 Debug session starts
CICS
The Debug Tool Control utility is a CICS transaction (transaction ID DTCN), with which the user identifies the CICS programs to debug. When the required debug session starts, the initial display is show (see Figure 3-3).
3.2.3 Fault Analyzer
In this section, we describe the features of the Fault Analyzer.
ISPF
Figure 3-4 shows the Fault Entry List panel, which is the initial display of the Fault Analyzer when it is selected from an ISPF menu. Existing entries, previously stored in a Fault History data set, are shown; by default, the most recent entry is shown at the top. Views can be used if the containing data set is defined in the Fault Analyzer options data sets. The list can be reordered and filtered by column and wildcard specification. To work with entries from a different history file, type over the displayed data set name and press Enter. History files can be managed through the Fault Entry List panel. Fault entries can be copied and moved to other history files.

Figure 3-4 Initial display
Interactive reanalysis, initiated from this panel, runs under ISPF. By using this reanalysis, and you can browse through a formatted, structured view of a fully detailed reanalysis. By using this Fault Analyzer mode, you can view working storage and control blocks at the time the dump was written. The ISPF interface has many point-and-click fields for easy navigation through the interactive reports. Interactive reanalysis can also be performed against system dumps. CICS abends can be viewed only by using interactive reanalysis.
CICS
Required CICS resource definitions, including the definition of the transaction that is required to start Fault Analyzer, are provided in a sample job that is supplied with the code. These definitions must be installed in any CICS system in which support for Fault Analyzer is required. The default transaction identifier is initial domain identifier (IDI), though this default can be changed.
The CICS interface is mostly identical to the ISPF interface. For more information, see the chapter “Using non-ISPF interfaces to access Fault Analyzer history files” of the IBM Fault Analyzer for z/OS User’s Guide and Reference, SC19-3671-01.
Real-time
Fault Analyzer provides abend invocation exits for CICS and batch, in Language Environment (LE) and non-LE environments.
The software includes exit programs (for CICS, IBM Language Environment, and z/OS systems) that it adds to the normal failure processing for these environments. When an application failure occurs in any of these environments, the Fault Analyzer exit starts real-time analysis. After failure processing, you can view the analysis report in the job output or through the Fault Analyzer ISPF interface.
Batch
Batch reanalysis generates a new analysis report. This report is based on the dump and information that is gathered in real time, but with potentially different options that are specified, or with program source information that is made available.
3.2.4 File Manager
In this section, we describe the features of the File Manager.
ISPF
Figure 3-5 shows the Primary Option panel, which is the initial display of the base component of File Manager. Similar initial panels are shown as the entry point to each of the three other File Manager components.
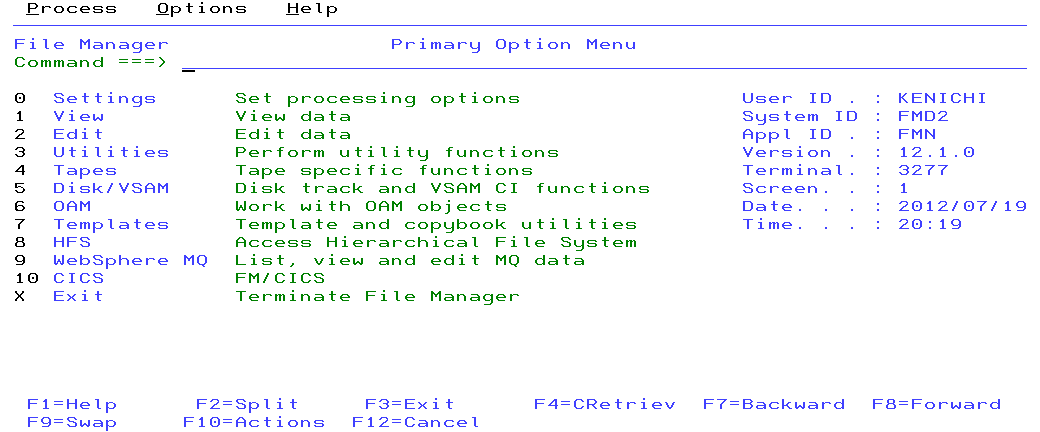
Figure 3-5 Base Primary Option menu
The following functions are available through ISPF panels:
•View and Edit data sets with DBCS support
•Create data sets of different types and initialization settings
•Display user storage
•Display load modules
•Compare data sets
•Display WebSphere MQ managers and queues
•Display raw disk layout information
•OAM object view, edit, and copy and conversion
•UNIX System Services (USS) and hierarchical file system (HFS) access
•File Manager (FM) and Customer Information Control System (CICS) access
A full list of functions is available in the “Panels and Fields” chapter of the IBM File Manager for z/OS User’s Guide and Reference, SC19-3675-00.
CICS
The required CICS resource definitions, including the definition of the transaction that is required to start File Manager, are supplied with the code. These definitions must be installed in any CICS system where support for File Manager is required. The default transaction identifier is FM, but this default can be changed.
3.3 Interface customization
In this section, we describe the features of Interface customization.
3.3.1 Application Performance Analyzer
You can use the PREF (PREFerences) command to set the preferences for general display settings. Include a slash “/” beside an option to select it, as shown in Figure 3-6.

Figure 3-6 Setting APA preferences
3.3.2 Debug Tool
After a debug session is started, commands and special panels can be used to perform the following tasks:
•Hide or display a window
•Change the sizes of windows
•Change PF key settings
•Change the window arrangement
•Change the colors used
•Change Debug Tool session settings
•Change profile settings
•Save customization settings to file and restore between sessions
For more information about performing these tasks, see the “Customizing your full-screen session” chapter of IBM File Manager for z/OS User’s Guide and Reference, SC19-3675-00.
3.3.3 Fault Analyzer
The Fault Analyzer 3270 interface can be customized by selecting the View menu, as shown in Figure 3-7.
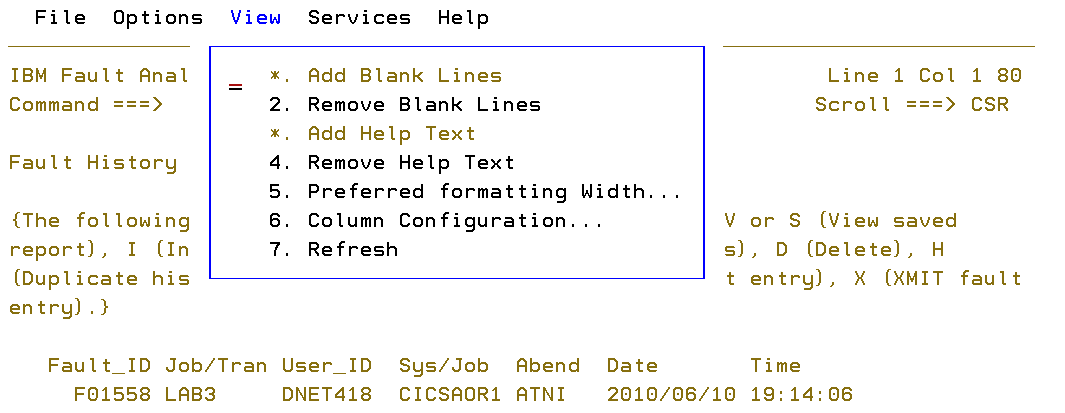
Figure 3-7 Setting FA preferences
The generated reports can be modified by using a formatting user exit. A formatting user exit uses an HTML-like language to change the layout of presented information.
3.3.4 File Manager
Many of the processing operations that are performed by File Manager use default values that can be set from within the File Manager application, as shown in Figure 3-8. By adjusting these values, you can customize File Manager so that their behavior is best-suited to your needs. Your settings for these options are stored in your ISPF profile and are started when you log in, regardless of which workstation you use. You can update these default values by accessing the relevant processing option panel, in one of the following ways:
•From the File Manager Primary Options menu for any of the components, select Options → 0 (Settings).
•From any File Manager panel, use the Options menu to select the required processing options type.

Figure 3-8 Setting FM preferences
3.4 Workload Simulator
In this section, we describe Workload Simulator (WSim), a terminal and network simulation tool that can be used to evaluate network design, perform and automate testing, and determine system performance and response time.
By using WSim, you can evaluate and test systems without the need for real terminals and terminal operators. WSim can be used to simulate actions of several types of applications and terminals. The simulated resources communicate among themselves and with the real teleprocessing system (called system under test) as though they physically exist. The system under test does not have to be modified.
3.4.1 Overview
Workload Simulator is an automated testing tool that can simulate terminals and other network devices and associated network traffic, and report the status and results of tests. It can be used to perform several types of tests. Workload Simulator features the following components:
•Batch utilities:
– Capture data from live sessions
– Prepare scripts
– Run simulation tests
– Generate reports
•WSim ISPF panels:
– Run utilities online
– Generate JCL
– Run simulation tests interactively
– Review test results
•WSim Test Manager ISPF application:
– Simplifies and automates test process
– Organizes tests by maintaining projects, test cases, network definitions, documentation, reports, and logs
A general overview of the WSim use context is shown in Figure 3-9.

Figure 3-9 WSim use context
Use of WSim
To use WSim, you must prepare the following types of information:
•Network definition statements that describe the configuration of the simulated network
•Message generation decks that send and receive messages
Network definition statements and message generation decks form a script, which WSim uses to send messages to the system under test. WSim collects and records the information that is received from the system under test. It also uses this information to determine which messages to send back to the system under test.
WSim enables the system under test to operate (to a certain degree) as it does under actual conditions.
The process to conduct a test includes the following steps:
1. Plan the test:
a. Define the objectives.
b. Prepare the test plan.
2. Configure the system:
a. The actual system that is used to run WSim (physical configuration).
b. The simulated network (logical configuration).
3. Prepare testing scripts:
a. Prepare network definitions for the network to be simulated.
b. Prepare message generation decks.
4. Run the test.
5. Analyze the results from WSim.
Planning is an important task in this process. You should view the planning process as an ongoing task and be prepared to refine the plan until wanted results are achieved. Every test, especially when you begin by using WSim, should start with a small sample network definition and a small simple message generation deck. After successful runs, more refined system configurations and more complicated scripts should be prepared until the simulation is done for the complete network to be tested.
Resources WSim can simulate
WSim can simulate the following types of resources:
•System Network Architecture (SNA) logical units (LU) that are running as Virtual Telecommunications Access Method (VTAM®) applications
•Common Programming Interface for Communications (CPI-C) transaction programs (TP)
•Transmission Control Protocol/Internet Protocol (TCP/IP) clients who are using Telnet 3270, 3270E, 5250, Network Virtual Terminal (NVT), File Transfer Protocol (FTP), or Simple TCP and UDP protocols that are attached to the TCP/IP network via the IBM TCP/IP for Multiple Virtual Storage (MVS) product
Testing with WSim
WSim can be used to conduct the following types of tests:
•Function
•Regression
•Performance
•Stress
•Capacity planning
Function testing often is used to test a particular function of the system and answer the question, “Is it working correctly?” WSim can be used to test functions, such as new application transactions, logon and logoff procedures, error transactions, new hardware additions, and new software products. The scripts that are used in functional tests can be saved and reused for regression or stress tests.
Regression testing verifies that old functions operate correctly after the addition of new functions, or after any other changes to the existing system. This testing also answers the question, “Is it still working correctly?” The use of WSim for regression tests includes the following advantages:
•Scripts are repeatable. After the scripts are created, they can be reused many times until the tested functions are changed.
•WSim can be run automatically. Execution parameters and operator commands that control WSim operation, including ending the simulation after all of the test cases are completed, can be included in scripts.
Performance testing includes taking measurements, changing parameters, and taking measurements again. It answers the question, “How well does it perform?” WSim can be used to report terminal response times and provides the possibility to create a controlled, repeatable transaction load for the system under test.
Stress testing is performed when you must find problems in interactions and resource contentions. By loading the system under test with high transaction rates, you can answer the question, “What will break first?” This type of test is almost impossible to conduct without a special tool. WSim can generate controlled message traffic at controlled rates.
Capacity planning helps to predict how the system under test behaves when new resources are brought online or when one or more of the existing resources are overused. This type of test helps to determine whether the system under test still performs adequately under predicted increased load. This test also answers the question, “What happens if this many resources are added?” WSim can drive the system under test with a higher than normal transaction rate and simulate more terminals or different types of terminals.
When performance, stress, and capacity planning tests are conducted, WSim should be run on a separate host from the system under test to avoid affecting the results.
3.4.2 System configuration
The following terms are used in this chapter:
•Logical unit (LU)
The LU is a port through which a user accesses an SNA network to communicate with another user or the system services control point (SSCP).
•Transaction program (TP)
In WSim, the TP is any program that uses LU6.2 communications protocols to communicate with another program. WSim implements TPs by using CPI-C.
•Session
A session is a logical connection that enables two network-addressable units to communicate with each other, such as an LU-LU, or an SSCP-LU session. Each half of a session is a half-session.
The network to be simulated and the system to be used to run WSim must be configured before testing. Configuration of the network that contains resources to be simulated by WSim and the real system to be tested (the system under test) is known as a logical configuration. For each logical configuration, a specific physical configuration must be used, which is the configuration of the real system that is used to run WSim. Resources of a physical configuration include a host processor, system software, application software, and WSim.
Physical configurations
WSim can operate in one of the following basic physical configurations:
•VTAM and CPI-C application configuration
This configuration is used to simulate LUs in the same subarea as VTAM. An LU can have a session with any other LU with which that VTAM allows it to start. It is also used to simulate client and server CPI-C TPs in the same subarea as VTAM. TPs can have a conversation with any other TP on any LU to which VTAM allows a conversation to be started.
This physical configuration contains WSim, VTAM, and VTAM applications, or TPs under test. WSim runs as a VTAM application program.
•TCP/IP application configuration
This configuration is used to simulate Telnet 3270, 3270E, 5250, NVT, and FTP clients. These clients can have a session with any Telnet 3270, 3270E, 5250, NVT, or FTP server that TCP/IP allows. This configuration can also be used to simulate Simple TCP or UDP clients that are in session with various servers.
This physical configuration includes WSim, TCP/IP, and TCP/IP applications under test. WSim runs as a TCP/IP application program.
Logical configurations
WSim can operate in one of the following basic logical configurations:
•VTAM application configuration
This configuration is used to simulate SNA LUs that are accessing VTAM applications. LUs might be terminals or other VTAM applications.
This logical configuration contains VTAM, VTAM applications, and VTAM applications and LUs simulated by WSim.
•CPI-C application configuration
This configuration is used to simulate CPI-C client (allocates outbound conversations but does not accept inbound ones), TPs to test server (accepts inbound conversations), CPI-C TPs and network resources, or to simulate server CPI-C TPs to test client prototypes.
This logical configuration contains VTAM, VTAM applications, and VTAM application CPI-C TPs and LUs simulated by WSim.
•TCP/IP application configuration
This configuration is used to simulate TCP/IP clients in a TCP/IP network, or simple TCP or UDP clients that are accessing an application through a TCP/IP server.
This logical configuration contains a TCP/IP server and any Telnet 3270, 3270E, 5250, NVT, FTP, simple TCP, and simple UDP clients simulated by WSim.
3.4.3 Script preparation
After the system configuration is defined, the definition of the network that is to be simulated must be defined next. This definition is done by creating a script, which contains the following parts:
•Network definition statements to describe the devices to be simulated by WSim
•Message generation decks to define messages to be sent by the simulated resources to the system under test
Network definition statements
Network definition statements specify the following information:
•Types of the simulated resources in the network
•Attributes of the simulated resources
•Connections between the simulated resources and the system under test
•Special information about delays, logic tests, the order in which message generation decks are used, logging, or tracing of the messages, and so on
NTWRK is always the first statement that is used to define a network. It names the network and specifies characteristics that apply to the network as a whole. It also can specify operands that establish defaults for lower-level statements. All other statements in the network definition follow the NTWRK statement in a prescribed order. The statements from the general simulation statements group immediately follow the NTWRK statement.
Different statements are used depending on what type of network is being simulated. For example, when simulating LUs that are accessing VTAM applications, the VTAMAPPL and LU statements must be used. When simulating CPI-C TPs, APPCLU and TP statements must be used. When simulating TCP-IP clients, TCP/IP and DEV statements must be used.
Not all statements are mandatory and some statements might be coded more than once. However, all of the statements in every group (including the optional groups) should follow the prescribed order.
Message generation decks
Message generation is the process by which terminals send and receive messages. Message generation decks are used to control messages that are being sent out and actions that are taken when messages are received by a simulated terminal.
A message generation deck contains one or more statements that are used to generate messages, set delays, define logic tests, define and control event actions, save data for future use, and so on.
Any terminal can use one or more message generation decks in any order.
The process to prepare message generation decks involves the following steps:
1. Decide what transactions to test.
2. Decide which application files and what data to use.
3. Create message generation decks by using one of the available methods.
4. Combine created message generation decks with network definition statements to form a script.
5. Test the script and modify and revise the script, if required.
In WSim, a transaction is an exchange of data between a simulated resource and the system under test. The choice of transactions depends on the objectives of the test. Usually, it is not necessary to test all possible transactions in the application. The following criteria can be used for the inclusion:
•Transactions taking the most processor time
•Transactions generating the most messages
•Transactions being the most important in the application
The following items also should be considered:
•The content of the messages to be sent
•The messages that are expected to be received
•The mix of transactions, such as the order in which WSim runs the message generation decks and which terminals use which decks
•The transaction rate
Use the PATH statement to specify the order in which the decks are run. Use the PATH operand on the DEV, LU, and TP statements to specify which paths a specified simulated resource runs.
Example 3-1 represents a fragment of the script for the RESNET1 network. The path SMALL specifies that the deck LOGON is run before the deck LOGOFF by the LU TERM1. The path LONG specifies that the decks LOGON, ALLOC, BROWSE, and LOGOFF are run in this order by the LU TERM2.
Example 3-1 Script fragments for the RESNET1 network
RESNET1 NTWRK
.
.
SMALL PATH LOGON,LOGOFF
LONG PATH LOGON,ALLOC,BROWSE,LOGOFF
.
.
TERM1 LU PATH=(SMALL)
TERM2 LU PATH=(LONG)
.
.
WSim executes the paths repeatedly; that is, when the terminal has executed the last deck in the path that is defined for it, it starts again with the first deck in its path. Terminals maintain their positions in the paths and are not affected by other terminals. BRANCH, CALL, and IF statements can be used to alter linear sequences of paths. The order in which WSim executes decks in any path can be certain, random, or based on probability distribution.
WSim can generate messages with controlled intermessage delays. This configuration can be used to simulate the delays of real operators as they view the window, think about the information, or enter more data. Intermessage delays can be defined for the entire network, a specific resource, or even on a message-by-message basis.
Before you create message generation decks, the transactions to be tested should be thoroughly analyzed. All steps should be listed.
Methods for creating message decks
WSim provides the following methods for creating message generation decks:
•Directly written message generation statements
•Programs in Structured Translator Language (STL)
•Use of one of the script-generating utilities that are provided with WSim to convert captured data traces
WSim provides the following script-generating utilities:
•Interactive Data Capture (can produce STL programs)
•Script Generator utility
•SNA 3270 Reformatter Utility
The method that used depends on what is being tested and on the following factors:
•Familiarity with WSim
•What kinds of messages are sent to the system under test by WSim
It makes sense to trace actual system activity and use the Script Generator utility to convert the trace records if the test involves simulating a number of real users who are using an application.
Some or all of the methods might be used when real tests are prepared.
Writing message generation statements
Knowledge of message generation statements is important when the output from the STL translator is interpreted, when the script generation utilities are used, and when the scripts are debugged.
The message generation statements must be coded manually in the following situations:
•When the output from one of the script generation utilities is modified
•When more message generation decks in a script that is produced by the STL Translator or one of the script generation utilities are added
•When some special types of messages or special conditions in an SNA network are added
•When existing message generation decks are modified
The syntax for message generation statements is similar to that for network definition statements.
Use the preprocessor to check the syntax and store message generation statements in data sets for use in simulations.
Using STL and the STL Translator
STL is a high-level, structured programming language that can be used to create message generation decks and define terminals and devices to be simulated by WSim. STL uses constants, variables, expressions, and structured control statements.
An STL program is usually divided into one or more procedures. The STL Translator translates STL programs into message generation decks. Each message generation deck corresponds to one STL procedure. Network definitions can be included in STL programs.
The STL Translator invokes the preprocessor to validate and store the network definition statements.
Example 3-2 shows two simple STL procedures. Procedures begin with an MSGTXT statement and end with an ENDTXT statement.
Example 3-2 Message generation decks written in STL
/* STL procedure logging terminal on to RESAPPL */
Logon: Msgtxt
Initself(‘RESAPPL’)
Endtxt
/* STL procedure testing message generation */
Tstmsg: Msgtxt
Do i = 1 to 5
Type “Hello, I expect you to respond Hi”
Transmit using PF4,
and Wait until on substr(screen,40,2) = “Hi”
End
Endtxt
The first STL procedure, LOGON, defines the text that a terminal uses to log on to an application named RESAPPL. When the second STL procedure, TSTMSG, is executed, WSim simulates a user who is typing Hello, I expect you to respond Hi and then pressing PF4 to send the message to the application. WSim waits for the application response Hi to appear at position 40 on the screen. These messages are sent five times.
The STL Translator can be started by using JCL, a TSO CLIST, or the WSim/ISPF interface.
Using the Interactive Data Capture Utility
The Interactive Data Capture Utility (IDC) ITPIDC is a host application that can capture 3270 device session data and generate scripts. A user logs on the same way as for any other VTAM application, and through it can log on to the VTAM application to be tested and perform all of the actions to be simulated by WSim. IDC that is capturing the session traffic is not apparent to the VTAM application.
From the captured session data, IDC can directly generate an STL program, WSim message generation decks, or both.
Using the script generator utility
The script generator utility creates message generation decks that are based on traces of real users who use real applications. The captured trace must be put in a specified format and sorted by resource name, date, and time. The sorted trace is used as an input for ITPSGEN, which generates the message generation decks.
The following methods can be used to obtain a system activity trace:
•The NetView® Performance Monitor (NPM) capturing path information units for selected LUs
•The Generalized Trace Facility (GTF) capturing the VTAM Buffer Trace
•User-written capture routines
WSim provides a special program ITPVTBRF to help with reformatting traces, which are not in the format that is required by ITPSGEN.
ITPSGEN also requires complete, syntactically correct network definitions as input. It uses the network definition statements to determine the terminal names for which to generate the decks. The names in the DEV and LU statements must correspond to the resource names that are used in the trace.
Using the SNA 3270 Reformatter Utility
The SNA 3270 Reformatter Utility (ITPLU2RF) is a batch utility for reformatting NPM log records (FNMVLOG) from LU2 sessions into log records. ITPLSGEN can be used to create STL programs or message generation decks that are based on ITPLU2RF output.
Testing scripts
The scripts must be tested to ensure that they are coded correctly, and that they function as intended. Statement syntax can be checked by using the Preprocessor or the STL Translator. The following methods can be used to ensure that the message generation decks function as intended:
•Message trace records tracing the message generation process
•STL trace records tracing the message generation process for STL programs
•Self-checking scripts
To ensure that unexpected situations encountered during simulations are handled properly, use self-checking scripts. They do not have to be used for all simulations (for example, they can be skipped for short and simple simulations). However, they must be considered for a long-running test, which could be wasted if terminals were to go out of synchronization.
IF statement logic tests are added to the scripts to check for the expected response and to take action if an unexpected one is received. This action could be simple (such as stopping the device) or complex. The action could include several possible courses of action that are based on the actual response. The logic tests can be written in decks that are created by STL, one of the script generation utilities, or manually. They can also be coded in network definitions.
3.4.4 WSim output
WSim provides several online and printed reports to analyze test results. Some reports are produced by default, but some must be requested by issuing specific operator commands or running one of the WSim utilities. The following types of reports are available:
•Operator reports that indicate what is happening during operation.
•The complete message log.
•Reports that are generated by the following utilities that are based on the message log:
– Formatted reports that are produced by the Loglist utility.
– Reports on the differences between 3270 display records in two message logs that are produced by the log compare utility
– Detailed statistical analysis of response times that are produced by the response time utility.
•Online response time statistics.
Most of the reports are intended to represent how WSim is interacting with the system under test and not the effectiveness of the network or the application.
Interval reports monitor the current activity and status of each simulated resource in the network. The statistics are accumulated until the network is canceled or reset. End-of-run reports provide summary data from the simulated network. They are produced automatically and have the same format as interval reports. The inactivity report contains information about each inactive resource in the network.
The log data set is the single most valuable tool for debugging the scripts. This data set contains all data that was transmitted or received by the WSim simulated resources. The message logging facility is active for the entire network, but it can be deactivated completely or partially for a VTAMAPPL statement in the network. A separate log data set can be used for a particular network. This feature is convenient when multiple networks are run because the results are logged separately.
The Loglist utility uses the log data set. The control commands can be contained in a file or entered at the operator console. You use the WSim/ISPF interface, JCL, or TSO CLIST to start the utility, name the input files, and specify where the formatted log is printed.
The Loglist utility uses different formats for each type of log records. One useful feature is the ability to print screen image records. These images are updated each time that a message is sent or received by the device. The output from the Loglist utility for this type of log records looks the same as the screen images a user sees at the real device.
3.4.5 Operating WSim
WSim can be run by using JCL, TSO CLIST, or the WSim/ISPF Interface.
The sample JCL can be found in the WSIMPRC6 member of the data set HLQ.SITPSAMP. The sample TSO CLIST can be found in the member WSIMRUN of the data set HLQ.SITPCLS. The value of HLQ and the method to invoke the WSim/ISPF Interface depend on how WSim and this interface are installed on the site. A typical WSim/ISPF main panel is shown in Figure 3-10.

Figure 3-10 WSim/ISPF main panel
3.4.6 WSim Test Manager
The WSim Test Manager (WTM) is a usability enhancement that provides guidance through the test process. WTM offers selectable modes of operation, test management services, automatic script generation, and task automation.
The primary concept of the WTM testing structure is a project, which is a set of libraries that contain schedules and test scenarios. Projects can be archived and reused. A project must be created before any schedules or test scenarios can be created by using WTM.
A WTM schedule is a WSim network definition and the associated test scenario definition.
Test scenarios are organized into the following levels:
•Test case: Can be reused within multiple test groups
•Test group: An ordered list of test cases
•Test cycle. An ordered group of test groups and test cases
WTM offers various ways to automate the development of test cases, which are WSim scripts that are written in STL. For 3270 environments, WTM can automate the script generation process from 3270 screen and keyboard captures (IDC), SNA traces, WSim or IDC logs, or from STL models and skeletons. Automated CPI-C test case generation uses SNA traces. The STL source is automatically translated into WSim MSGTXTs.
Generated test cases are paired with network resource definitions as part of developing WTM schedules. The WTM schedule is used by WTM to define and control the WSim simulation run (test). WTM schedules can be archived and reused.
The typical WTM main panel is shown in Figure 3-11.
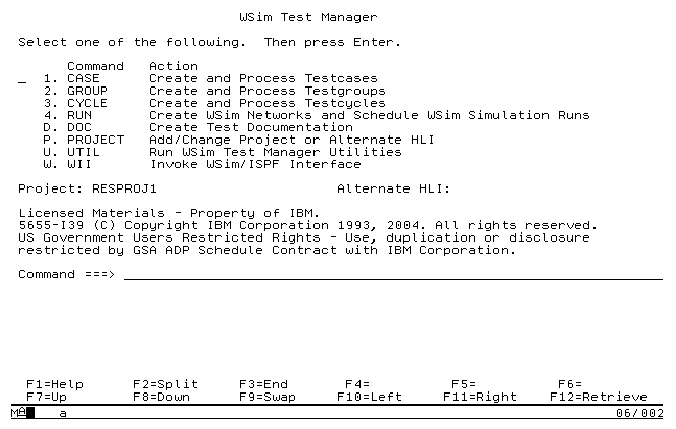
Figure 3-11 Typical WTM main panel
3.4.7 Latest enhancements
Applying the PTF, which fixes the APAR PQ94132 for the Workload Simulator, provides several general enhancements to this tool. The following enhancements are of high significance:
•Password masking on formatted 3270 screens
•WSim Adapters for Rational TestManager
Passwords are usually maintained on the 3270 screens in unprotected non-display fields. Although they are not visible, the passwords are sent to host applications in the clear and so are captured by the Interactive Data Capture utility or generated by script generation utilities.
The enhancement masks passwords by encrypting or hiding them by using asterisks in test scripts and logs. The utility ITPGNKYZ is supplied to generate required USERMODE.
The Workload Simulator Adapters for Rational TestManager allow WTM schedules and JCL scripts to be started from the IBM Rational TestManager that is running on a remote workstation.
To run WTM schedules from Rational TestManager, the schedules must exist in WTM on the host system. Some migration steps must be performed first. Also, a user ID and a password for a TSO user and the user ID of the WSim user (who created WTM projects and schedules) are required to run the WTM schedules from the Rational TestManager.
The white paper IBM Workload Simulator Adapters for Rational TestManager Version 1, Release 1.0.1 and the installation program are included with the PTF.
..................Content has been hidden....................
You can't read the all page of ebook, please click here login for view all page.
