
Using IBM PD Tools with Java
In this chapter, we describe how to use Fault Analyzer and Debug Tool with Java on z/OS.
9.1 Analyzing Java dumps with Fault Analyzer
In this section, we describe how to use Fault Analyzer to analyze dumps from a Java virtual machine. In the chapter “Real-time analysis” of the IBM Fault Analyzer for z/OS User’s Guide and Reference, SC19-3131-05, two methods are described for obtaining a Java dump. For this Redbooks publication, we use the -Xdump option that is available to IBM Java environments.
Consider the Java program that is shown in Figure 9-1.
|
public class RedbookGCD
{
public static void main( String [] args )
{
System.out.println( "GCD of " + args[0] + " and " + args[1] );
new RedbookGCD().gcd( Long.parseLong( args[0] ), Long.parseLong( args[1] ) );
}
private void gcd( long _one, long _two )
{
System.out.println( "Recurse: " + _one + " " + _two );
if( _one > _two )
{
this.gcd( _two, _one % _two );
}
else
{
this.gcd( _one, _two % _one );
}
}
}
|
Figure 9-1 RedbookBatch.java
The main method takes two arguments as Integers and calls the Global Catalog Data Set (GCD) method. The gcd method recursively calls itself. Eventually, one of the arguments reaches 0, which is not treated as the final state of the recursive definition. An exception is thrown, as shown in Figure 9-2.
|
$ java RedbookGCD 9832984798732984 12321453153
GCD of 9832984798732984 and 12321453153
Recurse: 9832984798732984 12321453153
Recurse: 12321453153 9288872323
Recurse: 9288872323 3032580830
Recurse: 3032580830 191129833
Recurse: 191129833 165633335
Recurse: 165633335 25496498
Recurse: 25496498 12654347
Recurse: 12654347 187804
Recurse: 187804 71479
Recurse: 71479 44846
Recurse: 44846 26633
Recurse: 26633 18213
Recurse: 18213 8420
Recurse: 8420 1373
Recurse: 1373 182
Recurse: 182 99
Recurse: 99 83
Recurse: 83 16
Recurse: 16 3
Recurse: 3 1
Recurse: 1 0
Exception in thread "main" java.lang.ArithmeticException: divide by zero
at RedbookGCD.gcd(RedbookGCD.java:15)
at RedbookGCD.gcd(RedbookGCD.java:15)
at RedbookGCD.gcd(RedbookGCD.java:15)
at RedbookGCD.gcd(RedbookGCD.java:15)
at RedbookGCD.gcd(RedbookGCD.java:15)
at RedbookGCD.gcd(RedbookGCD.java:15)
at RedbookGCD.gcd(RedbookGCD.java:15)
at RedbookGCD.gcd(RedbookGCD.java:15)
at RedbookGCD.gcd(RedbookGCD.java:15)
at RedbookGCD.gcd(RedbookGCD.java:15)
at RedbookGCD.gcd(RedbookGCD.java:15)
at RedbookGCD.gcd(RedbookGCD.java:15)
at RedbookGCD.gcd(RedbookGCD.java:15)
at RedbookGCD.gcd(RedbookGCD.java:15)
at RedbookGCD.gcd(RedbookGCD.java:15)
at RedbookGCD.gcd(RedbookGCD.java:15)
at RedbookGCD.gcd(RedbookGCD.java:15)
at RedbookGCD.gcd(RedbookGCD.java:15)
at RedbookGCD.gcd(RedbookGCD.java:15)
at RedbookGCD.gcd(RedbookGCD.java:15)
at RedbookGCD.gcd(RedbookGCD.java:15)
at RedbookGCD.main(RedbookGCD.java:7)
|
Figure 9-2 Recursive GCD function not finishing upon reaching 0
To capture a dump by using the Xdump option, we must understand which event we want a dump to be created for. In this case, we want to capture the dump when the exception is thrown. The next question is, what type of exception do we want to capture a dump on the event of a throw; it is java.lang.ArithmeticException.
The modified command line to run the program is shown in Figure 9-3.
|
java -Xdump:system:events=throw,filter=*Arithmetic* RedbookGCD 9832984798732984 12321453153
|
Figure 9-3 Command line
This command line results in a dump in data set KYKWAN.JVM.TDUMP.KYKWAN5.D111018.T070510. You can supply options for Java to create a custom name, and to immediately run a program on that dump. The chapter “Using dump agents” of the manual Java Diagnostics Guide, explains what the supported events are and specific options for each event. The guide is available at this website:
The IBM Fault Analyzer for z/OS User’s Guide and Reference, SC19-3131-05, explains how to configure Java to call Fault Analyzer on the generated dump.
Analyzing a Java dump is the same as with any normal interactive dump reanalysis. When a Java dump is analyzed, a DTFJ process is started in parallel (as shown in Figure 9-4), which might not be completed for a few minutes.
|
Confirm Java Fault Entry Reanalysis Line 1 Col 1 76
Command ===> Scroll ===> CSR
Java DTFJ processing has not yet completed for this fault entry.
Press Enter to continue reanalysis with incomplete Java information, or
press PF3/PF12 to cancel.
*** Bottom of data.
F1=Help F3=Exit F5=RptFind F7=Up F8=Down F12=Cancel
|
Figure 9-4 Wait for DTFJ processing to finish
When DTFJ processing finishes, the main interactive reanalysis panel shows the new option Java Information, as shown in Figure 9-5.
|
File View Services Help
Interactive Reanalysis Report Line 1 Col 1 132
Command ===> Scroll ===> CSR
JOBNAME: KYKWAN5 ABEND: n/a FAE1 2011/10/18 15:05:10
Fault Summary:
Module /apc/java531-UK53749/usr/lpp/java/J5.0/bin/libj9prt23.so offset X'716':
No abend could be determined--possible loop or wait situation.
Select one of the following options to access further fault information:
1. Synopsis
2. Event Summary
3. Java Information
4. Storage Areas
5. Language Environment Heap Analysis
6. Abend Job Information
7. Fault Analyzer Options
*** Bottom of data.
F1=Help F3=Exit F4=Dsect F5=RptFind F6=Actions F7=Up F8=Down F10=Left F11=Right
*FAULTA
|
Figure 9-5 Updated main panel with Java information option
As shown in Figure 9-6, the Java Information panel shows the state of the JVM at the time of the dump, including environment variables, the JVM command-line argument, and threads that are active at the time of the dump.
|
File View Services Help
Java Information Line 32 Col 1 132
Command ===> Scroll ===> CSR
JOBNAME: KYKWAN5 ABEND: n/a FAE1 2011/10/18 15:05:10
Java VM init args
args
arg=-Xjcl:jclscar_23
arg=-Dcom.ibm.oti.vm.bootstrap.library.path=/apc/java531-UK53749/usr/lpp/java/J5.0/bin
arg=-Dsun.boot.library.path=/apc/java531-UK53749/usr/lpp/java/J5.0/bin
arg=-Djava.library.path=/apc/java531-UK53749/usr/lpp/java/J5.0/bin:/apc/java531-UK53749/usr/lpp/java/J5.0/bin/classic/libjvm.so:
/apc/java531-UK53749/usr/lpp/java/J5.0/bin/classic:/apc/java531-UK53749/usr/lpp/java/J5.0/bin/:/u/kykwan/java_test:/lib:/usr/lib
:/apc/java531-UK53749/usr/lpp/java/J5.0/bin:/apc/java531-UK53749/usr/lpp/java/J5.0/bin/classic:/u/kykwan/idijlib:.:
arg=-Djava.home=/apc/java531-UK53749/usr/lpp/java/J5.0
arg=-Djava.ext.dirs=/apc/java531-UK53749/usr/lpp/java/J5.0/lib/ext
arg=-Duser.dir=/u/kykwan/java_test
arg=_j2se_j9=70912
arg=-Xdump
arg=vfprintf
arg=-Xdump:system:events=throw,filter=*Arithmetic*
arg=-Dinvokedviajava
arg=-Djava.class.path=/u/kykwan/java_test:/apc/java531-UK53749/usr/lpp/java/J5.0/lib/tools.jar:/u/kykwan/idijlib/IDIServer.jar:/
u/kykwan/idijlib/log4j-1.2.14.jar:
arg=vfprintf
arg=_port_library
Java threads with traceback information
Call trace for thread: main
Method Location
RedbookGCD.gcd RedbookGCD.java:15
RedbookGCD.gcd RedbookGCD.java:15
RedbookGCD.gcd RedbookGCD.java:15
RedbookGCD.gcd RedbookGCD.java:15
RedbookGCD.gcd RedbookGCD.java:15
RedbookGCD.gcd RedbookGCD.java:15
RedbookGCD.gcd RedbookGCD.java:15
RedbookGCD.gcd RedbookGCD.java:15
F1=Help F3=Exit F4=Dsect F5=RptFind F6=Actions F7=Up F8=Down F10=Left F11=Right
*FAULTA
|
Figure 9-6 Java information panel that shows JVM arguments and thread call trace
As shown in Figure 9-7, the Event Summary panel is reworked to show Java events in place of established events that are generated by the operation of the JVM run time. The events work as normal.
|
File View Services Help
Event Summary Top of data
Command ===> Scroll ===> CSR
JOBNAME: KYKWAN5 ABEND: n/a FAE1 2011/10/18 15:05:10
Event Fail Module Program EP
# Type Point Name Name Name Event Location (*) Description
1 Call CEEPLPKA n/a CEEBBEXT E+1B8 BOOTSTRAP MODULE FOR Language Environment; From LPA
2 Call CELHV003 n/a EDCZHINV E+B4 CRTL Main invocation event XPLINK; From not determined
3 >>> XPLink CEEPLPKA n/a n/a M+1CBD44 CEL Common Runtime; From LPA
4 Call java main main E+2AF4 From /apc/java531-UK53749/usr/lpp/java/J5.0/bin/
5 Java n/a n/a RedbookGCD.main
L#7 From not determined
6 Call libj9vm23.so
triggerExceptionThrowEvent
triggerExceptionThrowEvent
E+2C From /apc/java531-UK53749/usr/lpp/java/J5.0/bin/
|
Figure 9-7 Showing the Java event
Java source, if available according to the requirements described in the IBM Fault Analyzer for z/OS User’s Guide and Reference, SC19-3131-05, are displayed in the event’s details panel (as shown in Figure 9-8) and is reachable through the source line hotspot (as shown in Figure 9-9 on page 290).
|
File View Services Help
Event 5 of 18: Java Line 1 Col 1 132
Command ===> Scroll ===> CSR
JOBNAME: KYKWAN5 ABEND: n/a FAE1 2011/10/18 15:05:10
Previous Event Details
This event occurred in Class RedbookGCD Method main.
Java source from /u/kykwan/java_test/RedbookGCD.java:
Source
Line #
-5 public class RedbookGCD
-4 {
-3 .public static void main( String [] args )
-2 .{
-1 ..System.out.println( "GCD of " + args[0] + " and " + args[1] );
000007 ..new RedbookGCD().gcd( Long.parseLong( args[0] ), Long.parseLong( args[1] ) );
+1 .}
+2
+3 .private void gcd( long _one, long _two )
+4 .{
+5 ..System.out.println( "Recurse: " + _one + " " + _two );
The class static variable information is not available.
The object instance variable information is not available.
Next Event Details
*** Bottom of data.
F1=Help F3=Exit F4=Dsect F5=RptFind F6=Actions F7=Up F8=Down F10=Left F11=Right
*FAULTA
|
Figure 9-8 The Java source that surrounds the Java event
|
File View Services Help
RedbookGCD.main Java Source Line 1 Col 1 132
Command ===> Scroll ===> CSR
JOBNAME: KYKWAN5 ABEND: n/a FAE1 2011/10/18 15:05:10
Java source from /u/kykwan/java_test/RedbookGCD.java.
Source
Line #
000001
000002 public class RedbookGCD
000003 {
000004 .public static void main( String [] args )
000005 .{
000006 ..System.out.println( "GCD of " + args[0] + " and " + args[1] );
000007 ..new RedbookGCD().gcd( Long.parseLong( args[0] ), Long.parseLong( args[1] ) );
000008 .}
000009
000010 .private void gcd( long _one, long _two )
000011 .{
000012 ..System.out.println( "Recurse: " + _one + " " + _two );
000013 ..if( _one > _two )
000014 ..{
000015 ...this.gcd( _two, _one % _two );
000016 ..}
000017 ..else
000018 ..{
000019 ...this.gcd( _one, _two % _one );
000020 ..}
000021 .}
000022 }
*** Bottom of data.
F1=Help F3=Exit F4=Dsect F5=RptFind F6=Actions F7=Up F8=Down F10=Left F11=Right
*FAULTA
|
Figure 9-9 The complete Java source
9.2 Debug Tool for Java calling COBOL programs
In this chapter, we describe how Debug Tool helps in end-to-end debugging of Java calling COBOL programs. The reader is supposed to be aware of some of the technologies that we mention about to enable the debugging of Java and COBOL programs. You should be familiar with the following technologies:
•JZOS: IBM toolkit library that facilitates the creation of a JVM instance to run Java applications in a batch environment. The Java applications also can access z/OS file systems, for example, MVS data sets that ordinary Java APIs do not support.
•Debug Tool's Delay Debugging feature: For more information, see Figure 1-1 on page 3.
The application architecture consists of a Java application that submits a stock sale order request and the COBOL program that contains business logic to execute the stock order that is based on a fixed stock commission. The Java and COBOL applications are on z/OS.
9.2.1 Rational Developer for System z setup
The Java artifacts that are shown Figure 9-10 are the Java source files from a Java project in IBM Rational Developer for System z. The TradeWrap.java is the wrapper code that is generated when you compile the COBOL program on the host (see Figure 9-21).

Figure 9-10 TradeJava 2COBOL project in the Package Explorer view
We define a Remote Java Application debug configuration in Rational Developer for System z. As shown in Figure 9-12 on page 293, use the Debug Configurations to create a new Remote Java Application configuration that is called TradeJava2COBOL and enter the host name and port number.
In Figure 9-12, the host is tlba07me.torolab.ibm.com with port 8010. The port number should match the value that is specified in the JZOS JCL that we review later in this chapter.
Complete the following steps to set up Rational Developer for System z:

Figure 9-11 Run window
2. Create a Remote Java Application Debug configuration. Specify the host and port as shown Figure 9-12.
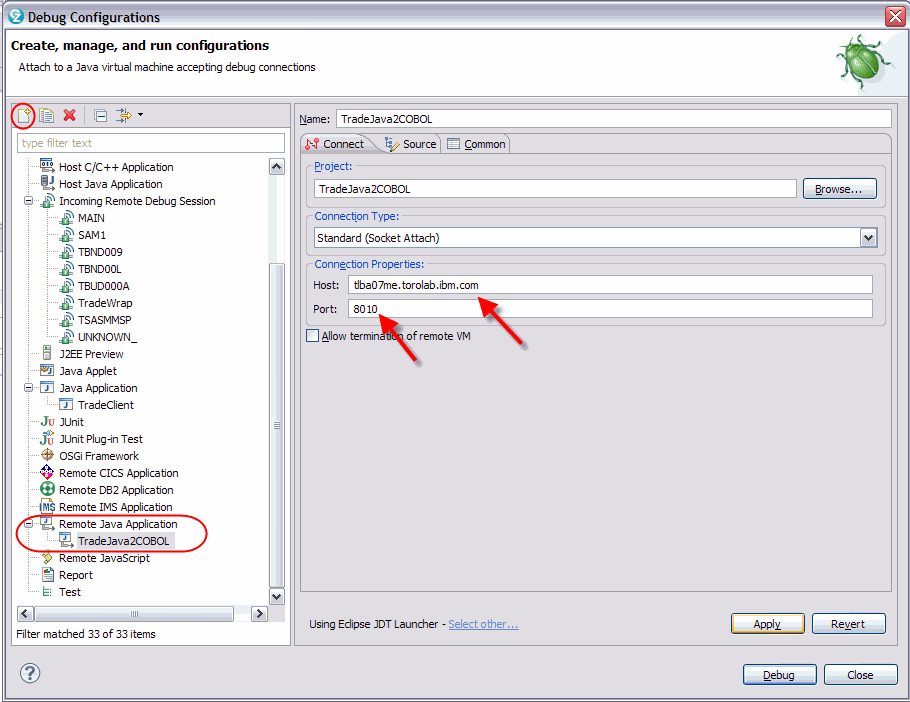
Figure 9-12 Debug Configurations window

Figure 9-13 Source tab
Figure 9-14 Select Java Project window
Figure 9-15 Project Selection window
9.2.2 Server (z/OS) set up
After you build the COBOL program on the host, ensure that the JZOS JCL that is started by the system programmer matches the port number. As shown in the following code example, the port number 8010 matches what was specified in Figure 9-12 on page 293. A detailed view of the JZOS environment variable settings is shown Figure 9-16:
# Configure JVM options
IJO="-Xms64m -Xmx128m"
IJO="$IJO -Xdebug"
IJO="$IJO -Xrunjdwp:transport=dt_socket,server=y,address=8010"
export IBM_JAVA_OPTIONS="$IJO "

Figure 9-16 JZOS JCL uses these environment variable settings
Debug Tool's Delay Debug Profile on z/OS contains the wanted runtime options (as shown in Figure 9-20 on page 298). The JZOS JCL uses Debug Tool's Delay Debugging support and customized EQAOPTS settings.
Complete the following steps to set up z/OS:
1. Enter B on the Debug Tool Utilities panel. Press Enter (as shown in Figure 9-17).

Figure 9-17 Debug Tool Utilities panel
2. Verify the Delay Debug profile data set. Press Enter (as shown in Figure 9-18).
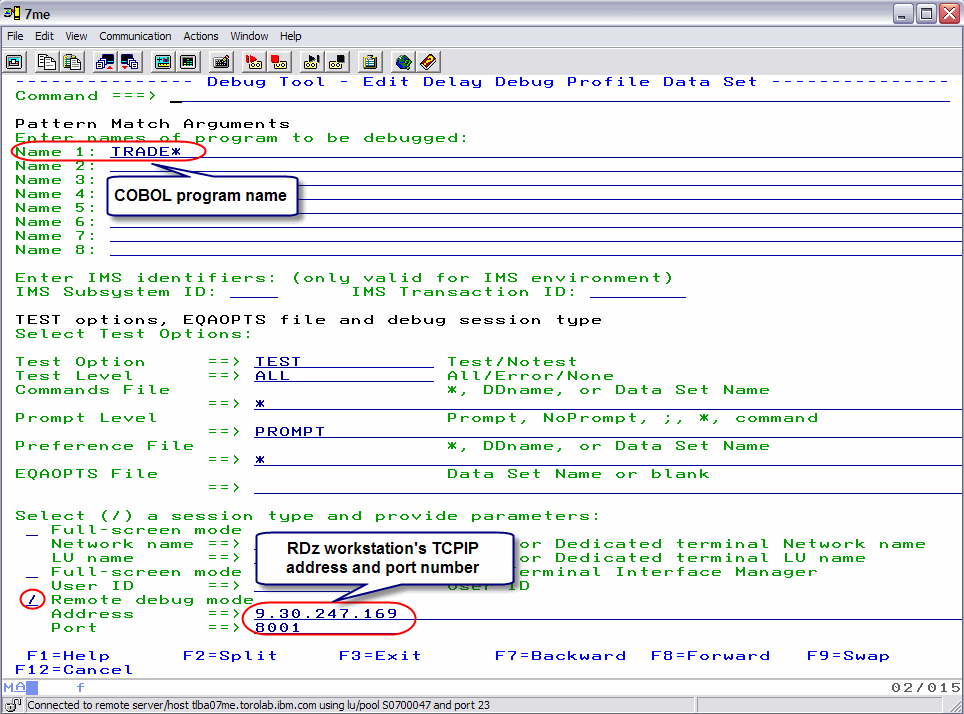
Figure 9-18 Delay Debug profile data set
3. Verify the program name and other TEST runtime options. Press F3 (as shown in Figure 9-19).
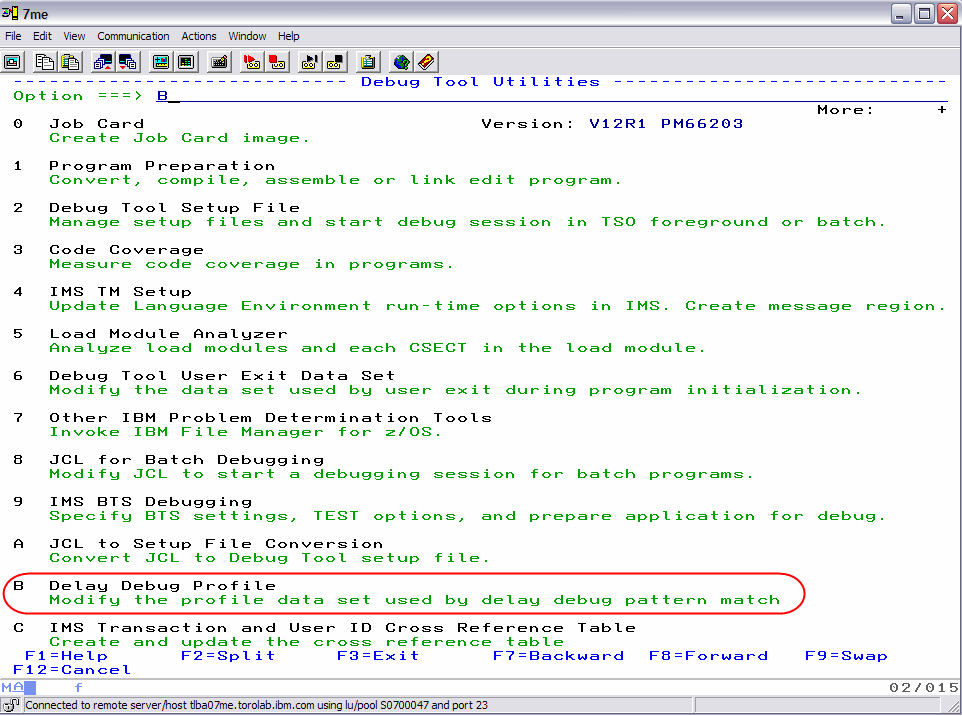
Figure 9-19 Program name and other TEST runtime options
9.2.3 COBOL programs on z/OS
As seen in Figure 9-20, the COBOL program TradeWrap links in a COBOL program, DLL2NDLL, which starts another COBOL program, TRADE2.

Figure 9-20 TradeWrap COBOL program generates the TradeWrap.java file
The TradeWrap COBOL program generates the TradeWrap.java program, which can be imported (in binary form) into the Java project that we saw in Figure 9-10 on page 291.
9.2.4 End-to-end debugging starts and ends in Java
Complete the following steps to start the Debug tool:
3. Debug the Java code (as shown in Figure 9-22 on page 300).
5. Debug the Java code (as shown in Figure 9-25 on page 303).
Complete the following steps to start the Debug tool:
1. As shown in Figure 9-21, set a line breakpoint in TradeClient.java program by double-clicking in the source prefix area.

Figure 9-21 Set two line breakpoints in TradeClient.java window
2. Open the TradeJava2COBOL debug configuration (as shown in Figure 9-12 on page 293) and click Debug.
3. Stop at the line breakpoint in the TradeClient.java program that is shown in Figure 9-22 on page 300. Click Resume (or press F8).
|
Resume icon: The Resume icon is the green arrow in the Debug view toolbar. It is circled in green in Figure 9-22.
|

Figure 9-22 Stop at the line breakpoint in the TradeClient Java program window
4. Debug the COBOL code by using Debug Tool that is shown in Figure 9-23. In section 4.4.4, “Debugging COBOL, PL/I, Assembler, and C++ programs” on page 133, the debugging actions that the reader could perform for debugging the COBOL code are described.
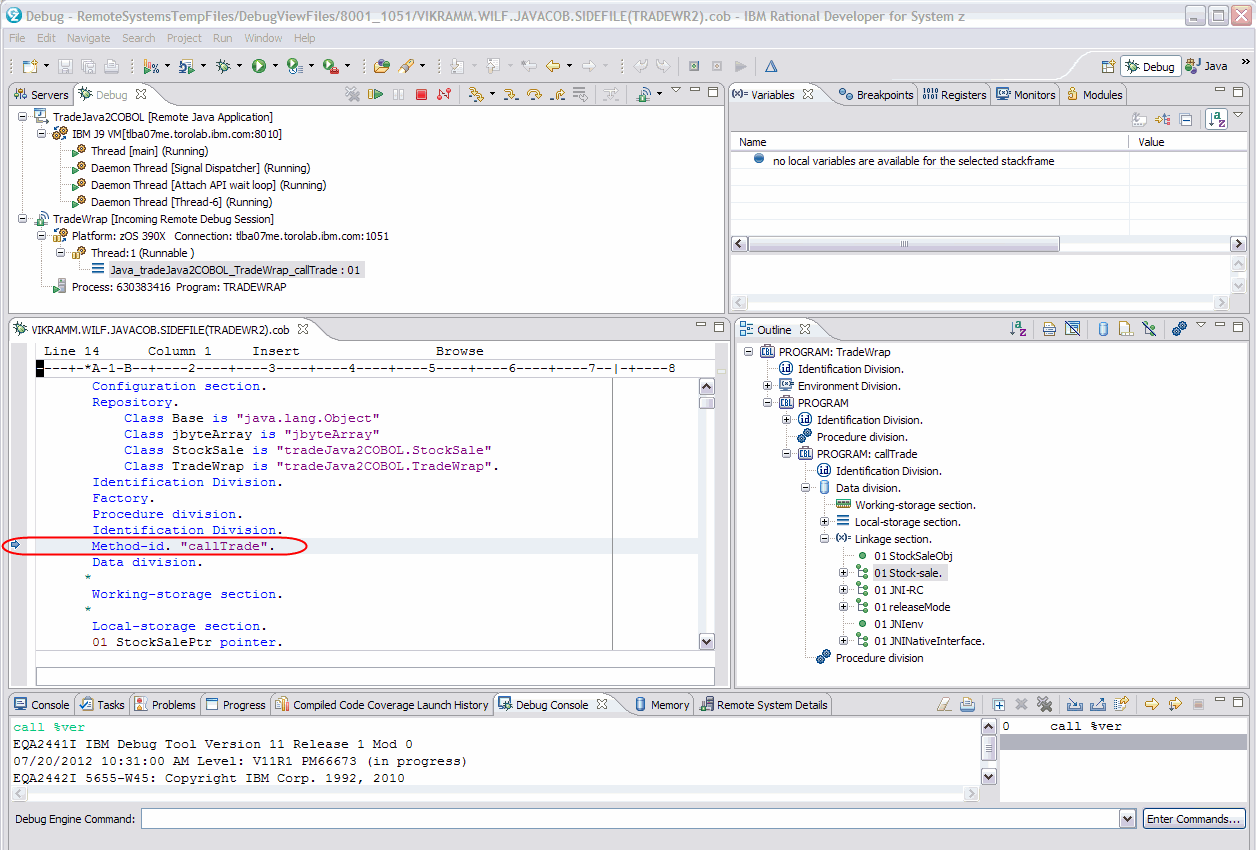
Figure 9-23 Debug COBOL code
5. Click Resume after debugging TRADE2 COBOL program.
|
Resume icon: The Resume icon is the green arrow in the Debug view toolbar. It is circled in green in Figure 9-24.
|

Figure 9-24 Business logic from TRADE2 COBOL program
The Debug tool is stopped in the Java application because of the line breakpoint on line 19. You can click the Disconnect icon (which is circled in red in Figure 9-25) in the Debug view toolbar to end the debug session.

Figure 9-25 Stop back in the Java application window: Line breakpoint at line 19
..................Content has been hidden....................
You can't read the all page of ebook, please click here login for view all page.
