Wetting
Wettability is an important characteristic for polymer materials, and in some appli- cations a wettable surface is necessary. Typically, polymers have low surface energy compared with metals. After ion implantation, the water contact angle decreases significantly. The total surface energy increases from 20–40 MJ/m2 for untreated polymers to 70–80 MJ/m2 after ion implantation. The polar part of the surface energy increases significantly, while the dispersive part does not change much. After time exposed to atmosphere, the total energy and its polar part decreases, while the dispersive part remains relatively stable. The changes in surface energy after ion implantation are caused by the appearance of radicals in the surface layer that is in contact with the wetting liquid. The chemical activity of active radical groups on a freshly treated surface can be used to obtain a stable, wettable surface on a polymer.
Keywords
wetting; surface energy; liquid interaction; free radical; dewetting
Wettability and surface energy: theory and measurement
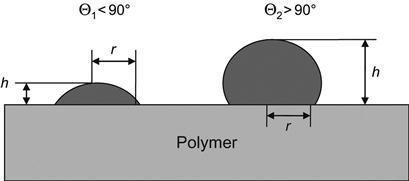
The interaction between liquid and a polymer surface is determined by the surface energy of the polymer and the liquid. The surface energy of the liquid is often referred to as its surface tension (with dimensions force per unit length or energy per unit area). A popular experimental method of analyzing this interaction, known as the sessile drop method, involves wetting of the polymer by a liquid drop and visualization of the wetting angle. The form of the liquid drop in the absence of any external interactions is spherical. In contact with the solid surface, the drop deforms according to the surface tension. The deformation is characterized by the wetting angle Θ (Figure 5.1). The wetting angle is related to γLP (the interfacial energy at the liquid/polymer interface), γLG (the surface tension at the liquid/air interface), and γGP (the surface energy at the air/polymer interface) through the following equation:
(Eq. 5.1)
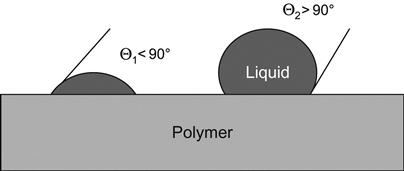
When the wetting angle is high (see Figure 5.1), the interaction between liquid and polymer is weak, the liquid drop has a form close to spherical, and the wettability of the polymer surface is poor. When the wetting angle is low, the interaction between the liquid and the polymer is strong, the drop spreads on the surface, and the wettability is good.
The energy of the liquid/polymer interface is influenced by many different kinds of intermolecular interactions between the molecules of the polymer and those of the liquids. More detailed analysis of the various intermolecular interactions involved can be found in Refs. [1,2]. In characterizing wettability, it is not possible to describe the influence of all types of intermolecular interactions, but rather the approach is to utilize theoretical models that consider the influence of various classes of molecular interactions. Typically, the complex, multifaceted interaction is modeled by considering two or three kinds of interactions. Here we use the Owens–Wendt–Rabel–Kaelble model, where the intermolecular interaction is considered as having two components: one due to polar and the other due to dispersive interactions. This model nicely describes the structural transformations in ion-implanted polymer surfaces and it is useful for analyzing interactions with organic substances. In this model, the surface energy of the polymer is expressed as:
(Eq. 5.2)
and the surface energy of the liquid is expressed as:
(Eq. 5.3)
Sessile drop wettability measurements with two or more liquids are then used to provide a group of simultaneous equations from which the polar and dispersic parts of polymer surface energy are calculated. The calculation requires a linear regression solution of the equation for ![]() :
:
(Eq. 5.4)
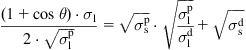 (Eq. 5.4)
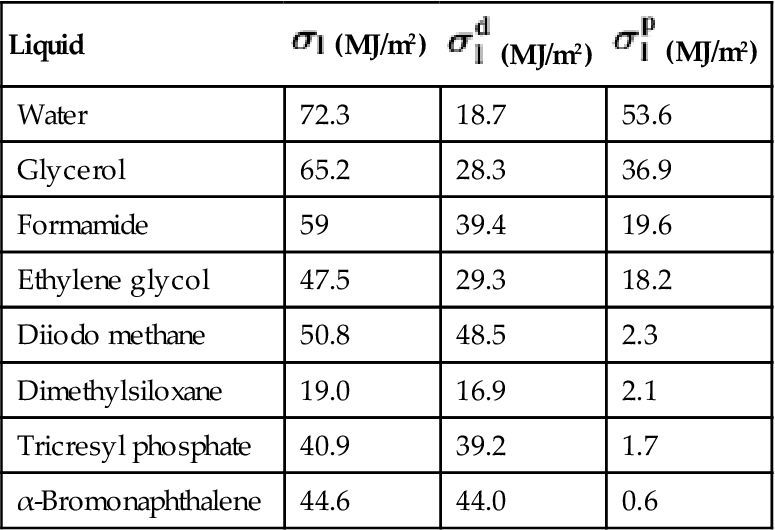
The calculations utilize known parameters for the surface energy components of the liquid: ![]() ,
, ![]() , and
, and ![]() . Table 5.1 contains such parameters for some liquids, which are used for analysis of wetting angle measurements. When choosing a liquid, it is important to ensure that the liquid does not react with the polymer and that the polymer does not swell in the liquid. In the case of chemical reactions or diffusion of the liquid into the polymer, the wetting data are likely to be incorrect [3].
. Table 5.1 contains such parameters for some liquids, which are used for analysis of wetting angle measurements. When choosing a liquid, it is important to ensure that the liquid does not react with the polymer and that the polymer does not swell in the liquid. In the case of chemical reactions or diffusion of the liquid into the polymer, the wetting data are likely to be incorrect [3].
Table 5.1
Full surface energy and its parts for some liquids which are suitable for wetting angle measurements of polymers
| Liquid | |||
| Water | 72.3 | 18.7 | 53.6 |
| Glycerol | 65.2 | 28.3 | 36.9 |
| Formamide | 59 | 39.4 | 19.6 |
| Ethylene glycol | 47.5 | 29.3 | 18.2 |
| Diiodo methane | 50.8 | 48.5 | 2.3 |
| Dimethylsiloxane | 19.0 | 16.9 | 2.1 |
| Tricresyl phosphate | 40.9 | 39.2 | 1.7 |
| α-Bromonaphthalene | 44.6 | 44.0 | 0.6 |
The simplest measurement of wetting angle can be performed with a microscope. The volume of the drop must be chosen so that it is small enough to exclude the influence of gravity on its form, and big enough to be measured. For example, the optimal drop for water is about 0.5–1 μl. The microscope must be equipped with a mirror to provide a horizontal view and a scale for measuring the dimensions of the drop. The wetting angle can be calculated from the drop dimensions (see Figure 5.2):
(Eq. 5.5)
or
(Eq. 5.6)
Surfaces with low water wetting/contact angles are referred to as hydrophilic whereas surfaces with high water wetting/contact angles are referred to as hydrophobic.
There are also commercial instruments for wetting angle measurement. Typically, such an instrument has a video camera and the drop shape can be analyzed using dedicated software. The wetting angle can be determined by analysis of the drop shape.
Modification of wettability of polymers using ion implantation
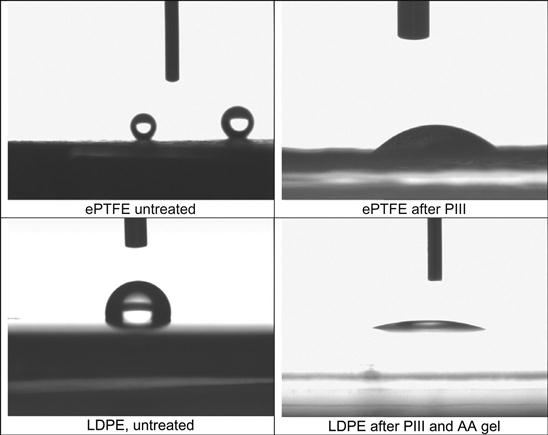
Typically, polymers have low surface energy compared with metals. Typically, the polar part of surface energy is lower than the dispersive part. This means that a water drop typically has a high wetting angle on an untreated polymer surface. For example, the wetting angle of a water drop on polyethylene (Figure 5.3) is about 90° and on polytetrafluorethylene it is about 120°. An extremely high wetting angle of 150–160° is observed on expanded polytetrafluorethylene (ePTFE), which has a fiber structure. The water drop contacts the polytetrafluorethylene fibers at some points, while making contact only with air at other intermediate locations. The additional air contacting locations make this surface so hydrophobic that a water drop cannot be placed on the ePTFE surface using a syringe needle.
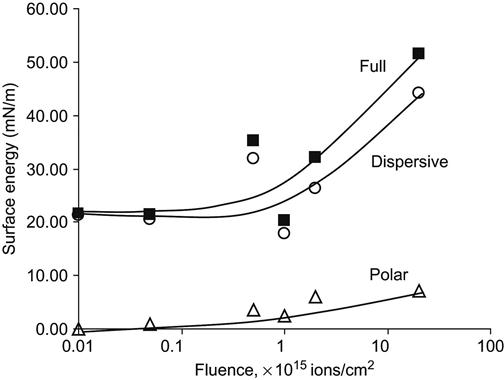
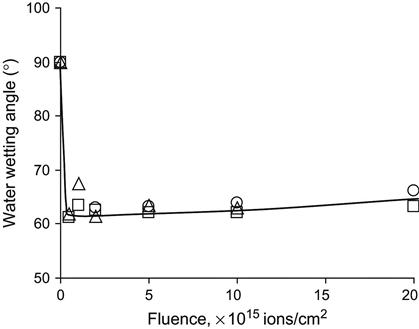
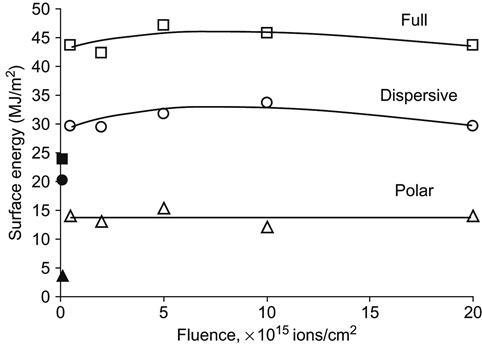
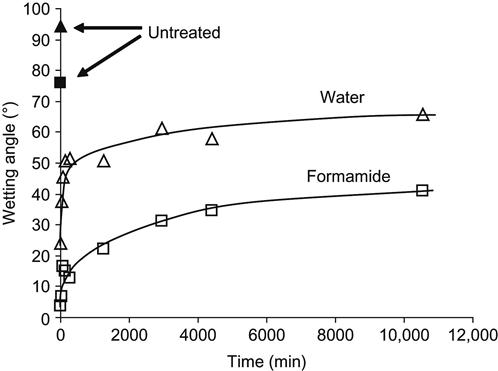
After ion beam implantation, the water contact angle decreases significantly. This has been observed for polyethylene [4–6], polystyrene [7,8], polytetrafluorethylene [9], silicon rubber [10], polyurethane [11], polyamide [12], polycarbonate and polyimide [13], and other polymers. For example, the wetting angle of a water drop on a polystyrene surface decreases from 90° to 60–62° after ion implantation (Figure 5.4). The same sharp changes of wetting angle are observed for formamide, methyleneiodide, and glycerol drops. The water wetting angle has a slight tendency to increase for polystyrene treated with high fluence. Figure 5.4 shows that the energy of the ions is not critical to achieving such low wetting angles. Surface energy and its components calculated from wetting angle measurements with four liquids on polyethylene show a sharp increase (Figure 5.5) after PIII treatment. The polar part of surface energy increases more than does the dispersive part. This means that the polyethylene surface after ion beam treatment becomes more polar, and polar liquids wet the treated polyethylene better than they do the untreated surface.
The wettability of the treated polymer surface is unstable, particularly at early times after the treatment. For example, immediately after PIII treatment (approximately 4 min after switching off the plasma source and 1 min after the taking the sample out of the vacuum chamber), the water contact angle of polyethylene is very low, near 24°, that is very hydrophilic (Figure 5.6). Over the subsequent 3 h, the water contact angle increases to 50°. During a further 2 weeks in air, the water contact angle increases slowly and finally stabilizes in the range of 60–70°.
These wettability changes can be interpreted in terms of changes in the surface energy. Let us to consider the example of PS. The total surface energy after ion beam treatment increases from 43 MJ/m2 (for untreated PS) to 76 MJ/m2 (after a PIII treatment to a fluence of 1016 ions/cm2 with 20 keV nitrogen ions). The contributions of the polar and dispersive parts of the total surface energy are different. The polar part of the surface energy increases significantly from 2 to 27 MJ/m2, while the dispersive part does not change much from 41 to 49 MJ/m2. After time exposed to atmosphere, the total energy decreases to 46 MJ/m2—the polar part of the surface energy decreases to 10 MJ/m2, while the dispersive part of the surface energy decreases to 36 MJ/m2.
Similar changes in surface energy are observed for other hydrocarbon polymers after plasma treatment, or UV light, electron and γ-irradiations [14–16]. The decrease in surface energy observed after storage of the modified material may have the same origin, as similar surface energy decreases are observed after plasma polymerization or plasma treatment as well as various irradiations of polymer surfaces [17,18]. All of these processes involve energy deposition into a surface layer, resulting in damage to the polymer structure and the creation of reactive species.
If the increase in surface energy is caused by chemical transformations in the modified polyethylene surface, in particular, the appearance of high-energy polar groups, then the decrease in surface energy could be explained by the disappearance of high-energy polar groups. What polar groups might be responsible for large changes in surface energy?
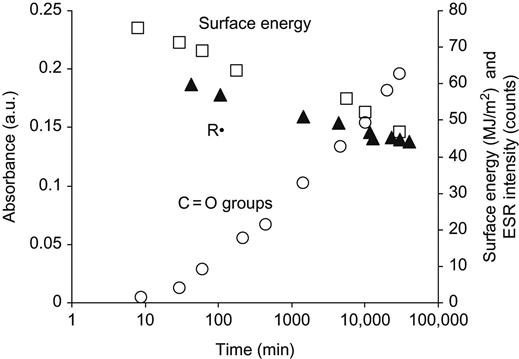
A common view regarding the improved wettability and increased surface energy of treated polymer surfaces is that the changes are due to the oxygen-containing polar groups that appear in the modified surface layer. The oxygen-containing groups are detected in all modified polymers and they show a monotonically increasing trend—increasing in concentration on the surface at first and then slowing to a saturated level. However, the surface energy does not follow a monotonic trend; instead, it increases dramatically over the untreated value and then decays toward a stable level that is typically still higher than the untreated value but considerably lower than the maximum surface energy achieved after treatment. Thus, we have a situation where oxygen groups are increasing with the time in atmosphere after treatment whereas the surface energy is decreasing (Figure 5.7). This implies that, although the presence of oxygen is likely to be the reason that the final surface energy after long-term atmospheric exposure typically remains higher than that for the untreated surface, it cannot be invoked to explain the very high values of surface energy achieved immediately after the treatment.
According to the literature and handbooks, the surface energy decrease and recovery of hydrophobicity with time of plasma-treated polymer surfaces was interpreted as so called reptation (or diffusion) of the surface polymer chains and the rotation of high-energy surface functional groups back into the polymer bulk [19] over time. Surface energy is thereby reduced and hydrophobicity increased. However, for a PIII-treated surface layer, the diffusion of polymer chains as in the reptation picture should be hindered by the dense crosslinking associated with highly carbonized structures appearing after high fluence modification. Therefore, the rotation of high-energy surface functional groups back into the polymer bulk cannot be expected and cannot explain the surface energy transformations.
Another explanation for hydrophobic recovery was discussed to be via the adsorption of adventitious carbon and hydrocarbons on the activated surface during atmospheric exposure [20]. However, the changes in wettability in this case should not be repeatable because of the variable environment in uncontrolled atmospheres, whereas the results are quite repeatable over many experiments in various environments. Further, FTIR-ATR and XPS spectra do not show any adsorbed hydrocarbons on the surface. Additionally, the decay of the surface energy is the same in air as it is in vacuum with 10−5 Torr pressure, where the presence of hydrocarbons is less likely. Therefore, hydrocarbon adsorption cannot be the explanation for the surface energy transformations.
To find an appropriate explanation, we will consider the kinetics of the surface energy of polyethylene. The changes in surface energy observed with ion treatment and storage after modification are associated with chemical changes in the surface of the modified polyethylene. The character and kinetics of these transformations are complex and depend on a number of reactions, characterized by different rates of reaction. Macrokinetics may be applied to simulate these transformations. Following the differential equations (Figures 3.1–3.4 in Chapter 3) for the chemical reactions, these relaxation processes may be fitted using exponential functions that correspond to first-order reactions. Exponential functions were fitted to the total and polar components of the surface energy, and agreement between experimental data and the theoretical curve was found (Figure 5.8). The fitted curve is a biexponential function of the form:
(Eq. 5.7)
where t1 and t2 are the characteristic times of the decay, σ∞ is the surface energy of the modified polyethylene after infinite storage time, and the (∑σi+σ∞) value is the surface energy of modified polyethylene immediately after PIII treatment.
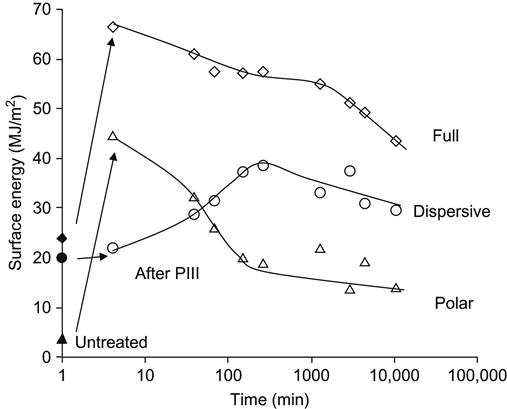
The kinetics show that the wettability of the modified polyethylene stabilizes 3–4 days after the PIII treatment. The total surface energy immediately following the PIII treatment is 67 MJ/m2, with a polar component of 46 MJ/m2. The surface energy after long-term storage (35 MJ/m2 with a 4 MJ/m2 polar component) is not the same as the value for the untreated polyethylene surface (23.8 MJ/m2 with a 3.7 MJ/m2 polar component). The change in surface energy is determined mostly by the polar component. The dispersive component of the surface energy remains in the range of 20–30 MJ/m2 for untreated and for the modified polyethylene surfaces.
The calculated total surface energy (at t=0 min) immediately following PIII treatment (67 MJ/m2) is much higher than normally reported for an equilibrium property of a polymer—polymers typically have total surface energies not exceeding 45–50 MJ/m2 [21]. The same analysis gives the total surface energy of 76 MJ/m2 for polystyrene, and 71 MJ/m2 for polyamide. Observing the spectral data, we see that there are a few possible sources for the high surface energy: newly introduced oxygen-containing or condensed aromatic polar groups, or the highly reactive radicals. An examination of the literature shows that surface energies as high as 67–76 MJ/m2 cannot be explained by a coverage of the oxygen-containing or condensed aromatic polar groups that we observe. The surface energies reported for surfaces with very high oxygen-containing group coverage are all below 50 MJ/m2 [21] (e.g., polymethylmethacrylate with a high concentration of C![]() O groups in the backbone (49 MJ/m2); polycarbonate with aromatic rings and carbonyl groups in the backbone (46.7 MJ/m2) and polyetherester ketone PEEK with ether, ester and aromatic ring groups in the backbone (46 MJ/m2)). In the case of hydrogenated and oxidized surfaces of diamond, a surface energy of 47 MJ/m2 has been reported [22]. Low surface energy is observed for fullerenes (48.1 MJ/m2) [23] and carbon nitrides (51.9−41.9 MJ/m2) [24].
O groups in the backbone (49 MJ/m2); polycarbonate with aromatic rings and carbonyl groups in the backbone (46.7 MJ/m2) and polyetherester ketone PEEK with ether, ester and aromatic ring groups in the backbone (46 MJ/m2)). In the case of hydrogenated and oxidized surfaces of diamond, a surface energy of 47 MJ/m2 has been reported [22]. Low surface energy is observed for fullerenes (48.1 MJ/m2) [23] and carbon nitrides (51.9−41.9 MJ/m2) [24].
The surface energy of graphite-like structures is sensitive to the presence of dangling bonds at the surfaces. The surface energy of structures terminated with unpaired electrons is reported to be in range of 4000 to 1000 MJ/m2 [25,26]. Free uncoupled electrons create strong intermolecular interactions, as observed for metal surfaces, which have surface energies in range of 100–1000 MJ/m2 [27] corresponding to the complete coverage of the metal surface by a free electron cloud. The same high-density free-electron gas is responsible for the high surface energy of intrinsic graphite reported as 1750 MJ/m2 [28] (experimental data) and 3338 MJ/m2 (theoretical data) [29]. This high surface energy arises from the presence of unpaired electrons in the surface layer. We do not expect such a high coverage of unpaired electrons associated with radical groups on the surface of ion treated polymers; however, the high surface energy does indicate that the ion implantation treatment results in the generation of a significant number of radicals at the freshly treated polymer surface. The presence, and decay as a result of chemical reactions, of these radicals on the modified polyethylene surfaces changes the polar component of the surface energy due to the strong polar electrostatic interactions of uncoupled electrons, but does not affect the dispersive component. The fact that the kinetics of the radicals with time after ion implantation is similar to that of the surface energy in Figure 5.7, whereas the oxygen-containing groups show an opposite trend, indicates strongly that the hydrophobic recovery observed is due to the removal of radicals by reactions with atmospheric chemical species.
Therefore, most of the changes in wettability and surface energy after ion beam treatment of polymers are caused by radicals in the top surface layer that is in contact with the wetting liquid. Residual differences in surface energy for untreated and ion treated polymers after long storage times are due to stable oxygen-containing and carbon unsaturated groups that appear after the completion of the radical reactions.
The structure of the surface layer after ion implantation is similar for different polymers, therefore the wetting angles and the surface energy are also similar for different polymers after ion treatment. Relatively minor differences in radical and oxygen-containing group kinetics give the differences in surface energy behavior.
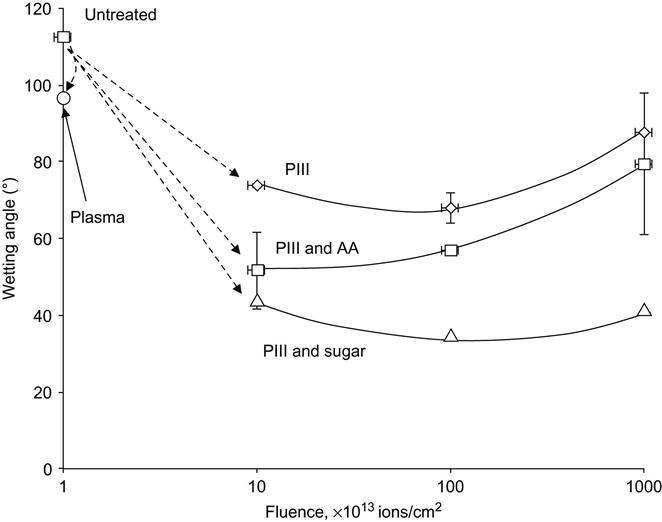
The chemical activity of active radical groups on a freshly treated surface can be used to obtain a stable, wettable surface on a polymer. For example, the polymer surface after ion implantation can then be activated by reaction with active hydrophilic compounds, such as acrylates or sugars. The water wetting angle for untreated polytetrafluorethylene is equal to 110–120°, but with PIII treatment this can be reduced to 60–80° after stabilization (Figure 5.9). It should be noted that the water wetting angle on plasma-treated polytetrafluorethylene reverts to 100° after stabilization if ion implantation is not employed during the treatment. If the same polytetrafluorethylene surface after PIII treatment is exposed to acrylamide or sugar solution, the water wetting angle decreases by up to 30° because an acrylamide gel forms on the polytetrafluorethylene surface. The acrylamide monomer reacts with radicals in the activated polytetrafluorethylene surface to form a crosslinked hydrogel layer on the surface. This layer is hydrophilic and stable. A similar hydrophilic layer is formed by sugar, which also reacts with the radicals in the polytetrafluorethylene surface. Such structures are stable and the wetting angle is stabilized. The same results were observed for different kinds of polymers, such as polyethylene, expanded polytetrafluorethylene, polypropylene, polystyrene, and a range of polyurethanes.
Applications and relevant theoretical aspects of surface wetting
Wettability is an important characteristic for polymer materials, and in some applications a wettable surface is necessary. Ion implantation is used for the regulation of wettability of polymer materials for various applications. Here we consider some examples.
Dishwashers have baskets for dishes, glasses, spoons, forks, and knifes. According to green technology, the baskets are made from polymers, for example polypropylene. If the basket surface were hydrophobic, water drops would adhere to the surfaces of dishes, glasses, spoons, forks, and knives and, after drying, these items would contain residual salt spots. Such spots are unwanted and modifications would be needed to counter this effect.
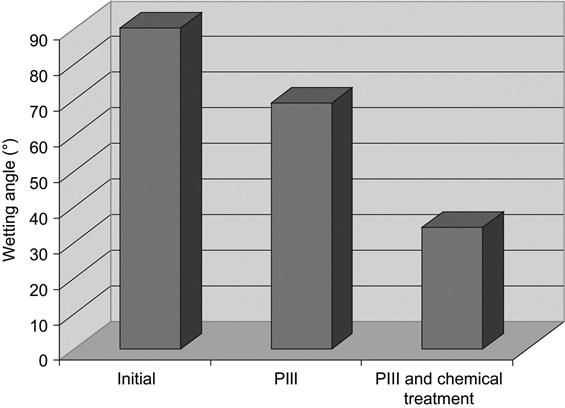
The polypropylene baskets are treated with PIII and afterward with acrylamide and its analogue N-(hydroxymethyl)-acrylamide, which is nontoxic. After treatment, the baskets are washed with water to completely remove residual monomers of acrylamide. The long-time stabilized wetting angle of a water drop after the PIII treatment is 65°, and after PIII treatment with subsequent coating with acrylamide gel it is 34° (Figure 5.10). Such an angle is sufficient for good wetting with water and removal of water drops from the hydrophilic surfaces of the dishwasher’s contents.
Wettability is responsible for friction if two surfaces are moving in a liquid environment. An example of the influence of wettability is polytetrafluorethylene in water. If a metal surface moves on dry polytetrafluorethylene, the friction is low. If the same metal surface moves on polytetrafluorethylene in water, the friction is high.
Thin polymer films have a wide range of applications, such as in painting, coating, printing, and so on. For such applications, the instability of a thin liquid film on substrate is one of the critical factors in the technological processes. In connection with the importance of technological application, the theoretical aspects of the instability of the thin liquid film have fundamental significance. The behavior of a thin liquid layer on the substrate can be described in terms of the classical mechanics of Newtonian liquids. The fluid film on the substrate can be considered as a large drop, which is pulled down to its thickness by the force of gravity on it. Following this approach, the height ec of the drop flatted by gravity equals [30,31]:
(Eq. 5.8)
where γ is the fluid surface tension, ρ is the fluid density, g is the acceleration due to gravity at the earth’s surface, and θ is the contact angle of the fluid drop with the substrate. A drop with height ec is in equilibrium and stable on the substrate. If the drop height is smaller than ec, the drop becomes unstable and the drop returns to the equilibrium state with height ec. In this case, the edge of the drop, where surface tension forces are stronger due to large surface curvature, moves to the center. This process is called dewetting. The dewetting process can be easily observed, for example, when oil is placed on a frying pan coated with Teflon or when rain falls on a car window.
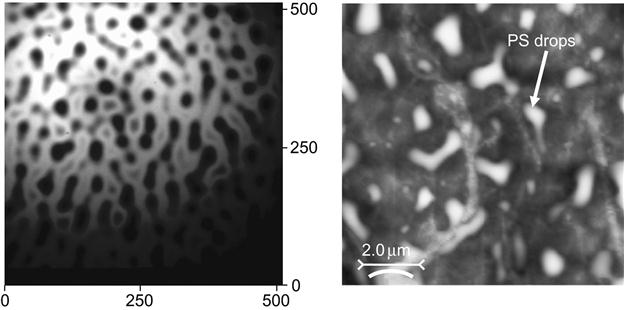
For example, the dewetting process is observed for a polystyrene film on a polytetrafluorethylene surface (Figure 5.11). The polystyrene film dewets on the polytetrafluorethylene surface and forms separated drops. The size and distribution of the drops depends on the thickness of the polystyrene film. Such a polytetrafluorethylene surface cannot be used for printing, due to low wettability by organic substrates. After PIII treatment, the surface energy of the polytetrafluorethylene is increased and it is close to the surface energy of hydrocarbon polymers, like polystyrene (Figure 5.12). In this case, the polar part of the surface energy is less important than the dispersive part, which is responsible for sufficient interactions with hydrocarbon polymers. After ion implantation, the polystyrene film is stable on the modified polytetrafluorethylene and the effect of dewetting is not observed.