
Adhesion
The problem of adhesion for polymer materials is well known. Every new polymer material to be incorporated in a device needs an estimation of adhesion ability and, in most cases, a selection of the appropriate surface modification method for adhesion improvement, for example energetic ion treatment. Commonly, there are about 20 theories of adhesion, all based on different interfacial interaction mechanisms. The key phenomena underpinning these theories can be classified as: mechanics, wettability, surface energy, thermodynamics, adsorption, chemical bonds, electrical adhesion, electrostatics, diffusion, weak layers, and others. Each of these theories describes the behavior of interfacial strength for different adhesion phenomena, adhesion joint load and testing, ageing, and aggressive media. Our view of the problem of adhesion is based on structure inhomogeneity of the adhesion joint in the interfacial region. Surface modification by ion implantation can give an ideal adhesion join if the chemical structure level is responsible for a poor adhesion.
Keywords
adhesion; polymer; ion treatment; interface; polymer network
The problem of adhesion for polymer materials is well known. Every new polymer material to be incorporated in a device needs an estimation of adhesion ability and, in most cases, a selection of the appropriate surface modification method for adhesion improvement, for example energetic ion treatment. This problem usually grabs the attention of scientists and technologists. Commonly, there are about 20 theories of adhesion, all based on different interfacial interaction mechanisms. The key phenomena underpinning these theories can be classified as: mechanics, wettability, surface energy, thermodynamics, adsorption, chemical bonds, electrical adhesion, electrostatics, diffusion, weak layers, and others [1–9]. Each of these theories describes the behavior of interfacial strength for different adhesion phenomena, adhesion joint load and testing, ageing, and aggressive media. Therefore, the selection of a modification technique for a new adhesion joint must be made on the basis of consideration of all the theories of adhesion, which requires great effort and experience. How does ion implantation perform to improve adhesion for a real polymer material?
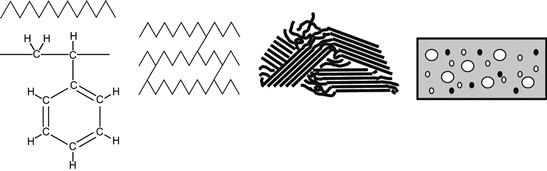
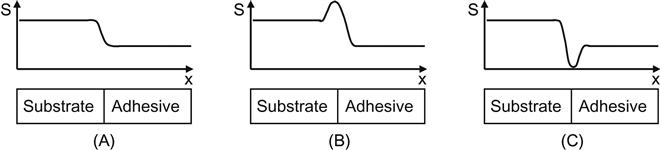
Our view of the problem of adhesion is based on structure inhomogeneity of the adhesion joint in the interfacial region. By structure, we mean the multilevel organization of the polymer material. Every polymer material has a reasonably complex structure, even a simple polymer with few additives. A number of levels of structure can be found in polymer materials. Classification of structure is based on various types of interactions and their roles in determining material properties. Usually, one can find the four following levels (Figure 6.1): molecular level (molecular groups, intermolecular interactions); topological level (macrochain branches, molecular weight, cross-links); super-molecular level (crystallinity, ordering, lamellas); and macrolevel (fillers, particles, gas bubbles, surface roughness). Such a division of structure helps us to understand the role of individual physical or chemical phenomena in determining the properties of polymers. Depending on the type and composition of polymer materials, their properties are determined by different structure levels. In terms of the structure levels, the adhesion joint is a break of the structural homogeneity. If we move from one material through an interface to another material, the structure has a transition at the boundary between the two jointed materials. If a particular structure level of the polymer material is responsible for its strength, then the nature of the transition at that level at the interface will determine the strength of the adhesion at the joint. There are three types of structural transitions that can occur at interfaces: (i) the structure changes smoothly, (ii) the structure has a positive discontinuity, and (iii) the structure has a negative discontinuity (Figure 6.2). Only in the last case does the adhesion joint need improvement. Let us now consider some different examples:
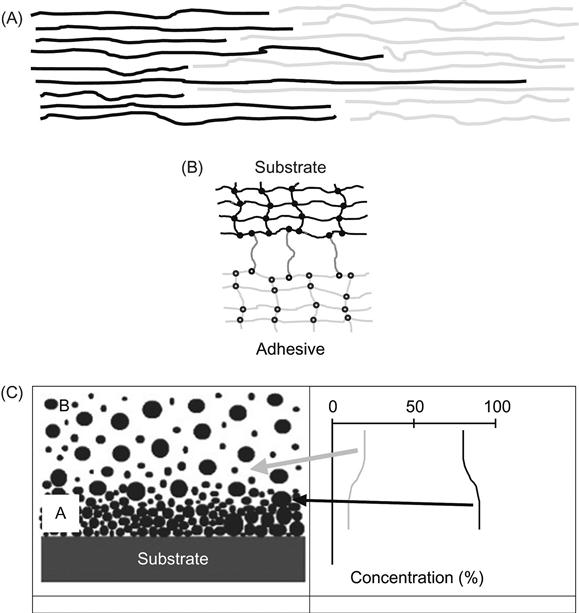
1. If the strength of polymers to be joined is determined by the relaxation processes of macromolecules caused by intermolecular interactions under mechanical load, then the interfacial region must be filled with interlinked macromolecules of both polymers, where the interactions between these different types of molecules is so strong that a mechanical load cannot separate the macromolecules into the different phases (Figure 6.3A). The formation process of the adhesion joint must achieve an interpenetration of macromolecules through the interface, with sufficiently strong intermolecular interactions between the macromolecules of the two materials. This case can be described by thermodynamic theory, mechanical theory, and diffusion theory.
2. If the polymers to be joined have a network of cross-linked macromolecules and contain low-molecular-weight components, such as plasticizers, then the network is responsible for the strength of the polymers (Figure 6.3B). Cross-links between the two polymer networks in the interfacial region are required for good adhesion. This case can be described by a chemical theory of adhesion.
3. If the polymers to be joined are highly filled materials with inorganic hard particles, then the particle distribution is an important factor for the mechanical behavior of the materials (Figure 6.3C). A disturbance of the particle distribution, caused, for example, by sedimentation processes or a speed distribution effect during molding of the filled adhesive, forms a high concentration of particles and low concentration of polymer matrix in the adhesive near the interface layer. The strength of this layer is less than that of the bulk polymer and the strength of the adhesion joint is, therefore, lower than the maximum available.
In which of these cases can surface modification be useful for the improvement of adhesion? Only in the second case is surface modification able to generate special active groups for the formation of cross-links in the interfacial region. In the other two cases, ion modification of the polymer surface cannot improve adhesion and adhesion strength.
From these examples, one can see that the analysis of the adhesion joint must be done sufficiently precisely. “What structure level undergoes a transition?”, “How smooth or discontinuous is the structural transition?” and “How does this structural transition influence the mechanical properties of the polymer materials?” are the questions whose answers show the reason for adhesion weakness (or strength) at a polymer joint. From this point of view, there is ideal adhesion when a homogeneous structure extends across the interface, homogeneous at least with regards to the structure levels that determine the strength of the two polymers. If there is no ideal adhesion joint and a sharp discontinuity of the important structure level is observed, we must reconstruct the structure of the materials to obtain a continuous structure across the interface. If this can be achieved by surface modification of one polymer material, then surface modification can be used to improve the adhesion.
It should be noted that this is only one side of the adhesion problem. The other side is related to the stress distribution in the adhesion joint under mechanical load. Typically, there are two cases: homogeneous and inhomogeneous distribution of mechanical stresses in the adhesion joint during testing and operation. Both depend equally on conditions of the load and on differences in elastic properties of jointed materials. Here, we don’t consider stress analysis of adhesion joints, but it must be taken into account for a complete prognosis of adhesion joint behavior in real technological situations.
Let us consider some other examples.
There is a well-known adhesion joint of polyethylene and its copolymers with epoxy adhesives. One of the industrial applications of polyethylene copolymers is EPDM rubber. This is a terpolymer of ethylene, propylene, and diene, which has excellent mechanical properties over a wide temperature range; this rubber is used in a variety of applications from automobiles to rockets. But EPDM rubber doesn’t adhere well to active epoxy or urethane adhesives.
EPDM rubber usually contains many additional components: plasticizers, inorganic fillers, stabilizers, antioxidants, and groups of vulcanizing agents. The rubber is comprised of polymer networks, as is the case for epoxy and polyurethane adhesives. The network of rubber provides excellent mechanical properties sufficient for exploitation at different temperatures and in aggressive media. In the presence of a plasticizer at high concentration, the polymer network is required to provide high mechanical strength. In the case of adhesion joint, the network is the primary structure that must be preserved, and cross-links in the interfacial region between the networks of rubber and those of the adhesive must be formed.
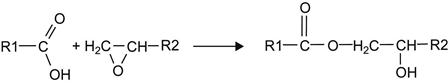
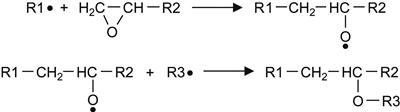
The FTIR ATR spectrum of EPDM rubber shows lines in the 1750–1710 cm−1 region, interpreted as vibrations of carbonyl groups. These groups are the result of the oxidation process of EPDM macromolecules in the surface layer when exposed to oxygen in air, UV light, and natural radiation. Some oxidation is observed for all polymers during storage in an oxygen-containing environment. As a result of oxidation, carbonyl, carboxyl, aldehyde, and hydroxyl groups are formed in the surface layer of the rubber. These groups can react with epoxy groups in adhesives in the following ways:
 (6.1)
(6.1)
![]() (6.2)
(6.2)
 (6.3)
(6.3)
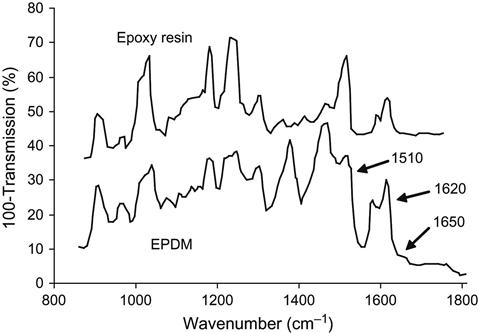
The results of these reactions can be observed by FTIR ATR spectrometry of the EPDM surface after exposure of the rubber to liquid epoxy resin without hardener (Figure 6.4). After being washed in toluene, the EPDM rubber surface contains some cross-linked epoxy resin that is chemically bonded onto the rubber network by the reactions in (6.1)– (6.3). The lines at 1620 and 1510 cm−1 are associated with vibrations of the aromatic rings of epoxy resin macromolecules, and the line at 1650 cm−1 is associated with vibrations of the ester groups that result from the above reactions. Therefore, the critical structure level of this adhesion joint are the cross-links between networks in the interface region, which are formed due to reactions between the epoxy group of the adhesives and the oxygen-containing groups of the oxidized surface layer of the rubber. But is the concentration of the oxygen-containing groups enough for an ideal adhesion joint?
The answer can be found by examining the characteristic failure mode of the adhesion joint. If the adhesive can be peeled off the interface boundary, then the cross-linking at the interfacial region is not strong enough, and adhesion can be improved. If the adhesion joint is broken in one of the jointed polymers, the adhesion strength is sufficient. The mode of failure depends on the mechanical properties of the jointed polymers, the geometry of the adhesion joint, and the load during the adhesion test. In some cases, the failure can be attributed to a weak region at the adhesion joint. In the experiments we describe here both polymers had similar elastic and strength properties. We used elastic resin PDI based on polyisoprene-polydivinyl with end epoxy groups and the hardener SKN based on butadiene acrylonitryl resin with carboxylic end groups. The geometry of the adhesion joint and load conditions provided the possibility to use the failure characteristics to identify the weakest region of the adhesion joint. We used a peeling test at a low loading rate.
The analysis of characteristic modes of failure is related to the dominant level of structure. In the following, we give an example of how it is possible to characterize adhesion or cohesion failure. In many adhesion joints, the interfacial boundary is not clearly determined. For example, a number of macromolecules can penetrate through the interface into the surface layer of the second polymer even when the adhesion is low. Or, in the case of high filler polymer concentration, the adhesion failure can occur some distance from the initial interface, but the failure occurs in the adhesive because the surface layer of adhesive may have a lower concentration of filler and therefore reduced strength. In both cases, the failure is associated with the interface, and the new surfaces created by the failure are the result of interfacial phenomena. The focus of analysis of an adhesion joint is to find the primary structure level that is responsible for determining the adhesion strength. In most cases, this structure level also determines the mechanical strength of the materials being joined.
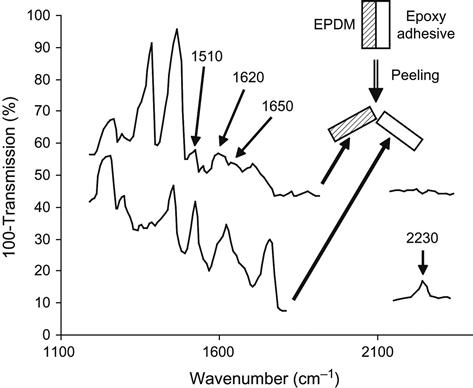
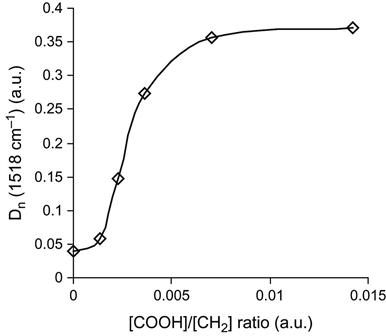
In the case of EPDM rubber, the adhesion failure occurred at the adhesion joint, as determined by the solvate method and FTIR ATR spectroscopy of the new surfaces created by the failure. For the solvate method, the adhesion joint is swelled in a binary solvent, in which both rubber and the cured resin are swelled by the same volume fraction. This prevents the generation of tangential stresses in the interface region. After swelling, the adhesion joint at the interface was very easily broken by peeling off the epoxy resin. The FTIR ATR spectra of the two new surfaces exposed by the failure (Figure 6.5) showed that the vibration lines characteristic of EPDM rubber are observed on one of the surfaces while the other surface showed only lines characteristic of the adhesive. Very weak lines characteristic of epoxy resin can also be seen in the spectrum of the EPDM rubber surface. This means that failure occurred at the interface. The network in the interface boundary was not sufficient for good adhesion, despite some epoxy macromolecules reacting with EPDM oxygen-containing groups. In this case, an increase in oxygen-containing active group concentration on the EPDM surface should improve the adhesion.
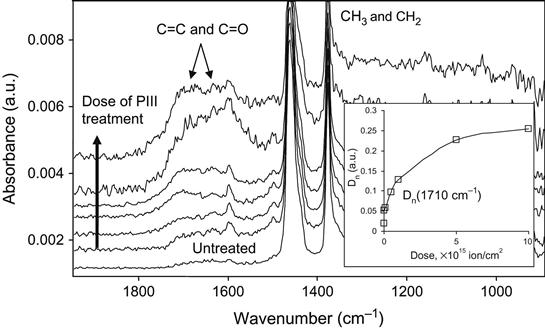
The FTIR ATR spectrum of EPDM rubber after ion implantation shows an increase in the carbonyl line intensity as a function of the ion fluence (Figure 6.6). The intensity in the 1750–1600 cm−1 region of the spectrum increases with fluence. A similar increase in the carbonyl line intensity is observed after both plasma discharge treatment and UV light treatment. The increase in the carbonyl group concentration leads to an increase in the chemical activity of the EPDM surface. After surface modification, the spectral line intensities associated with epoxy resin macromolecules bonded to the EPDM surface increases (Figure 6.7). This means that the concentration of the epoxy resin macromolecules increases and a denser network forms in the interface region of the adhesion joint. The strength of the adhesion joint initially increases with the ion fluence of the PIII treatment, corresponding to the increasing bonded network density in the interface region (Figure 6.8).
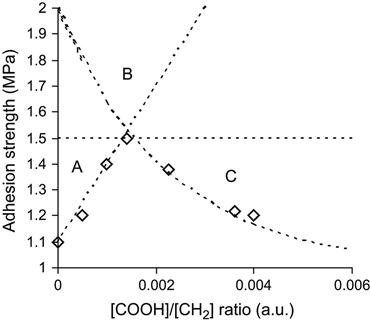
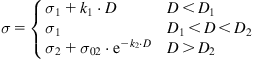
In should be noted that accompanying the positive effect of the surface modification under various kinds of irradiation, there is often also degradation of the surface layer in the irradiated polymer, and the strength of this layer can decrease as a function of the fluence of the treatment. Thus, the strength of the adhesion joint can decrease at high fluences (Figure 6.8). This dependence of adhesion strength on intensity of the surface modification is common for many methods of surface modification of polymer materials. The strength dependence can be expressed by a piecewise-continuous function such as [10]:
(Eq. 6.1)
 (Eq. 6.1)
where σ is the strength of the adhesion joint, σ0 is the initial strength of the adhesion joint, σ1 is the maximum strength of the adhesion joint that corresponds to strength of one of the joined materials, k1, k2 and σ02 are parameters, and D is the degree of surface modification.
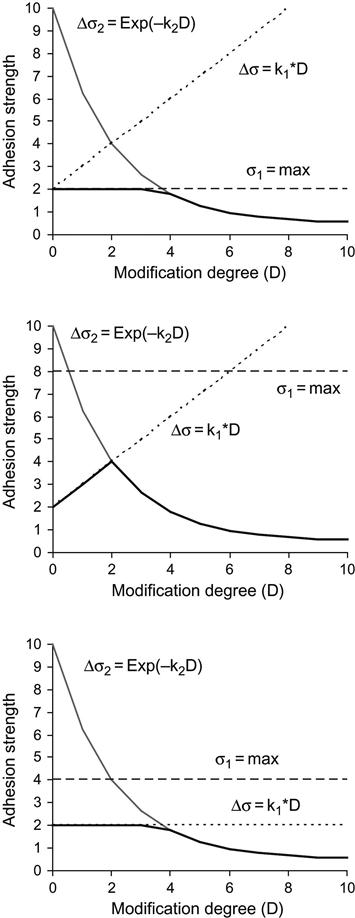
Based on this adhesion strength model, some particular cases can be considered (Figure 6.9):
1. The initial strength of a joint is close to the strength of one of the polymers (σ0=σ1). In this case, an ideal adhesion joint can be achieved without surface modification. Surface modification would only reduce the adhesion strength and should not be applied (Figure 6.9—top).
2. The adhesive strength is close to the substrate strength (σ1=σ2+σ20). Modification of the surface can increase the adhesion strength, but in some cases the destruction effect (if k2 is high) may reduce the strength of the surface layer and the ideal adhesion joint cannot be achieved (Figure 6.9—middle).
3. Modification of the substrate surface does not increase the adhesion, because the predominant structure level does not change with the modification (k1=0). In this case, the modification can only decrease the adhesion strength (Figure 6.9—bottom).
This type of model was applied for adhesion joints between different kinds of polymers with surface modifications based on UV light, plasma discharge, and ion beam treatment [11–12].
Let us now consider modification of the simplest polymers, polyethylene (LDPE) and polytetrafluorethylene (PTFE), which have poor adhesion to reactive epoxy and isocyanate adhesives.
LDPE and PTFE have poor thermodynamic compatibility with epoxy and isocyanate polymers. After ion beam treatment, the surface energy of LDPE and PTFE changes, which leads to a decrease in wetting angles of these substrates by adhesives in the liquid state. The wetting angle of LDPE by epoxy resin decreases from 60.4° for unmodified LDPE, to 37.3° for LDPE after nitrogen ion treatment with an energy of 20 keV and a fluence of 3×10¹⁴ ions/cm2. The wetting angle of PTFE by epoxy resin decreases from 96° for unmodified PTFE, to 76° for PTFE after nitrogen ion treatment with an energy of 20 keV and a fluence of 1015 ions/cm2.
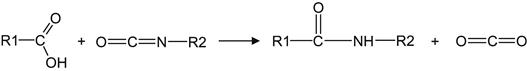
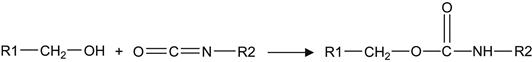
The appearance of the oxygen-containing groups after ion treatment also changes the chemical activity of the LDPE and PTFE surfaces—observed in experiments with treated LDPE and PTFE films exposed in liquid toluene diisocyanate (TDI). After exposure of the LDPE film in TDI, the surface of the LDPE contains the urea and urethane groups as a result of a chemical reaction of the LDPE active groups with the isocyanate group in TDI. FTIR ATR spectra show the appearance of amide lines at v(C![]() O)=1700–1750 cm−1 and δ(N
O)=1700–1750 cm−1 and δ(N![]() H)=1520–1550 cm−1; a line of the TDI aromatic ring at 1610 cm−1; and a line at v(NCO)=2285 cm−1 attributed to the second isocyanate group in the TDI molecule (Figure 6.10). The reactions occur as follows:
H)=1520–1550 cm−1; a line of the TDI aromatic ring at 1610 cm−1; and a line at v(NCO)=2285 cm−1 attributed to the second isocyanate group in the TDI molecule (Figure 6.10). The reactions occur as follows:
 (6.4)
(6.4)
 (6.5)
(6.5)
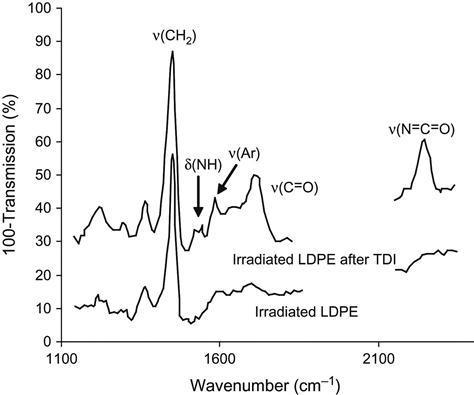
The intensity of these new lines is not modified by washing the LDPE surface with acetone and toluene. The FTIR ATR spectra of untreated LDPE films, including the untreated side of the ion-modified LDPE film, do not show these new spectral lines after exposure in TDI. Therefore, one can conclude that it is the ion-modified macromolecules of polyethylene in the surface layer that react with the isocyanate group of TDI. Such reactions occur in the interface region between the liquid adhesive and the LDPE surface during the formation of the adhesion joint. After curing the isocyanate adhesive, the interface region contains cross-links between the polymer networks of the substrate and the adhesive.
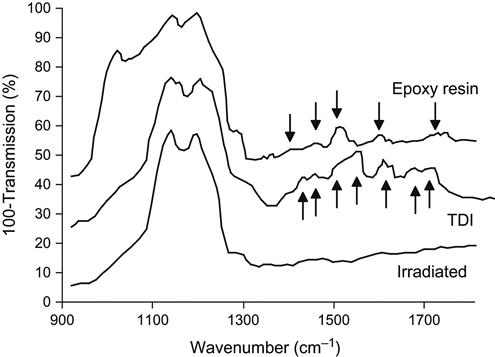
The same method can be applied to analyze the interaction of the modified LDPE surface layer with epoxy adhesive. After exposure of the LDPE film in epoxy, the spectrum of the surface layer shows new lines at 1250 and 1040 cm−1 that are interpreted as vibrations of epoxy macromolecules. These are observed on the modified side and not on the untreated side of the LDPE film. The intensity of these lines does not change when the LDPE film is washed in acetone and toluene. This indicates that the epoxy resin reacts with oxidized macromolecules of LDPE in the interface region of the adhesion joint. These kinds of chemical reactions are similar to those previously discussed for EPDM rubber and shown in Reactions (6.1)– (6.3).
The surface of PTFE becomes active to isocyanate and epoxy compounds, as well (Figure 6.11). After exposure of ion-modified PTFE film in TDI, the spectra of the surface show the appearance of additional lines of the urethane group at v(C![]() O)=1720 and 1700 cm−1; of the urea group at v(C
O)=1720 and 1700 cm−1; of the urea group at v(C![]() O)=1670 cm−1; of aromatic rings in TDI at 1610 cm−1; of the urea and urethane groups at δ(NH)=1563, 1530–1520 cm−1; of TDI at δ(CH3)=1460, 1430, 1390 cm−1; and of the second isocyanate group of the TDI molecule at v(NCO)=2285 cm−1. These lines remain, even after washing of the ion-modified PTFE surface with solvents. The same effect is observed after exposure of the ion-modified PTFE film in liquid epoxy resin. The spectrum of the treated PTFE surface contains lines at 920, 1468, 1480, 1520, 1610, 1630 cm−1, attributed to vibrations of epoxy resin macromolecules. These lines remain in the spectrum after washing with acetone and toluene. However, if the washing is carried out with sufficient mechanical effort, the modified PTFE layer can be removed together with the bonded epoxy resin. This is due to the weak interactions between the macromolecules of PTFE, which can be removed or rearranged by the mechanical forces.
O)=1670 cm−1; of aromatic rings in TDI at 1610 cm−1; of the urea and urethane groups at δ(NH)=1563, 1530–1520 cm−1; of TDI at δ(CH3)=1460, 1430, 1390 cm−1; and of the second isocyanate group of the TDI molecule at v(NCO)=2285 cm−1. These lines remain, even after washing of the ion-modified PTFE surface with solvents. The same effect is observed after exposure of the ion-modified PTFE film in liquid epoxy resin. The spectrum of the treated PTFE surface contains lines at 920, 1468, 1480, 1520, 1610, 1630 cm−1, attributed to vibrations of epoxy resin macromolecules. These lines remain in the spectrum after washing with acetone and toluene. However, if the washing is carried out with sufficient mechanical effort, the modified PTFE layer can be removed together with the bonded epoxy resin. This is due to the weak interactions between the macromolecules of PTFE, which can be removed or rearranged by the mechanical forces.
The strength of epoxy adhesion joints formed on LDPE increases sharply with the fluence of the ion implantation treatment (Figure 6.12). The strength achieves a value, which corresponds to the strength of the epoxy resin determined at the same geometry and test conditions. The next fluence increase results in a slight decrease in the strength, and the failure character changes as well. For unmodified LDPE, the failure occurs at the interface boundary. The spectra of the failure surfaces show a clear division between the LDPE and the adhesive surfaces. The failure of modified polymer joints is cohesive in the epoxy adhesive, which can be observed even visually. Adhesion on the ion-modified LDPE does not change after washing with acetone and CCl4. The maximum value of the adhesion strength is similar to and even higher than that provided by the well-known methods of modification of polyolefin surfaces by chromic acid and corona discharge (8.3–9.0 MPa).
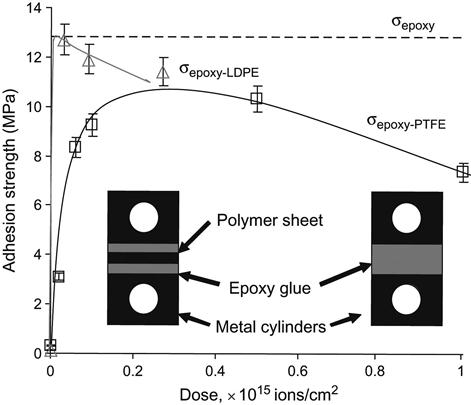
The same behavior is observed for the adhesion strength of epoxy resin on PTFE. The adhesion strength increases with the fluence of the ion implantation treatment. The characteristic mode of failure transforms from adhesive for untreated PTFE to cohesive for the modified PTFE. The maximum strength of the adhesion joint (13.55 MPa) reaches the cohesive strength of the epoxy resin, and this value is higher than the well-known adhesion strength of PTFE modified with potassium/naphthalene complex (11.0 MPa). The modified PTFE keeps its superior adhesion properties for a long time after treatment. We observe the same adhesion after the modified PTFE has been stored for two years under laboratory conditions prior to the formation of the adhesion joint.
The polymer network cross-links of the epoxy adhesive with LDPE and PTFE in the interface region are stable, because they are formed by chemical bonds. This means that the adhesion strength is stable in aggressive environments and across the range of temperature over which the joined materials and the epoxy are stable.
Therefore, after ion implantation treatment, the adhesion strength reaches its maximum value and the adhesion joint becomes ideal. The scientific problem has been solved and applications for particular polymer devices will be determined by cost/value considerations.
A note of caution—a real polymer device usually has a blend of different components, which satisfy a number of requirements simultaneously: plasticizers, inorganic fillers, stabilizers, antioxidants and groups of vulcanizing agents, color additives, inhibitors, and other components. Some of these additional components can sometimes interfere with the formation of adhesive joints. An example of such a problem was observed with rubber used for sealing in car doors. Ethylene–propylene rubber was used and good adhesion was provided with plasma methods of modification. However, the elasticity of the rubber was not sufficient and the rubber was modified with a porosity agent to enhance the elasticity. During vulcanization, the porosity agent is decomposed and gas released, so that the rubber forms an elastic foam. When the rubber is glued to the door with acrylic adhesive, the residual porosity agent diffuses into the acrylic adhesive and inhibits the curing reaction. As a consequence, the adhesion becomes weak. In such cases, neither ion implantation treatment nor other surface modification methods can improve the adhesion.
Plasma methods can also be employed to form adhesion joints between two very different materials, for example polymers and metals. Due to different surface energies, thermal expansion coefficients, chemical activities, and elasticity, metal-polymer adhesion is usually very poor. The interface between these materials can be improved with the formation of a gradient layer, which gives a smooth profile of properties through the interface. If the metal vapor can form a mixed phase with a polymeric precursor gas such as acetylene, such a graded interface can be made using ion-assisted deposition. The ions of one material are embedded into the other material to form a transition layer at the interface. In some cases, where chemical bonds between carbon and the metal are possible (as for carbide forming metals), a thin graded interface will provide sufficient adhesion. An example is the deposition of a hydrocarbon coating from plasma onto a cobalt chromium substrate. The low bias (500 V) used during deposition is sufficient to provide strong adhesion (Figure 6.13). A calculation of the carbon ion penetration depth suggests that interfacial mixing due to ion bombardment during deposition is of the order of 1.7 nm.
When the metal and polymer form separate phases (e.g., noncarbide forming metals), a thick gradient layer with a smooth profile of the phase concentration is needed. A good example of this is a hydrocarbon plasma polymerized coating on stainless steel. In this case, the gradient layer must be created using a separately tunable metal plasma source, such as a magnetron or cathodic arc. The deposition at the interface must begin with pure metal onto the clean metal surface. A polymerizing precursor is then fed into the deposition chamber, with gradually increasing flow rate, so that the partial pressure of the precursor is increased with deposition time. The deposited layer is thereby tuned from pure metal, through a mixed layer of metal and plasma polymer with a gradually increasing plasma polymer fraction, finally terminating in a top layer of pure plasma polymer. A deposited graded interface region of width 20 nm was found to provide sufficient adhesion of the plasma polymer to survive the stresses induced in crimping and expansion of a stainless steel cardiovascular stent [13]. This adhesion joint also survives in a boiling water environment.