
Structure of polymers after ion beam treatment
The treatment of polymers by ion implantation changes their color from rainbow-like and brownish yellow to brown and silver-like. The optical absorbance in the UV-Visible transmission spectra of the polymers can be used for the calibration of the ion implantation treatment fluence. The carbonization of the surface layer is characterised by D and G peaks in the Raman spectrum. The radicals in graphite-like structures and their kinetics are detected by electron paramagnetic resonance spectroscopy. The carbonisation and oxidation effects are observed by attenuated total reflection Fourier-transform infrared spectroscopy and X-ray photoelectron spectroscopy. Gel-fractions thicker than the ion penetration depth are detected in the treated surface. A three-layer model of the modified surface structure is presented. Due to cross-linking and carbonization of the treated polymer, differential stresses and strains appear in the surface layer, giving rise to some bizarre surface morphology effects.
Keywords
carbonization; oxidation; crosslinking; gel-fraction; surface morphology
Color changes
The treatment of polymers by ion implantation changes their color starting from a fluence of 1014 to 1015 ions/cm2. At such a low fluence, the surfaces of polyethylene, polyethylene terephthalate (PET), polystyrene, and other polymers become rainbow-like in appearance. At fluences higher than 1015 ions/cm2, the surface becomes dark yellow and changes to brown as the fluence increases (Figure 4.1). At a fluence of 1016 ions/cm2, the surface becomes dark or silvery. These color changes can be used for an initial visual inspection of the surface treatment effect and for visual analysis of fluence distribution on the sample surface in cases where the fluence over the surface is nonuniform. Color changes are observed for all kinds of polymers, but the strongest changes are observed for polymers with high carbonization potential, such as polyethylene and polystyrene. For polymers that depolymerize under irradiation, the color becomes lighter. For example, polytetrafluorethylene (PTFE) changes color from white to gray under irradiation only after high fluence is applied. Polylactic-co-glycolic acid (PLGA) film becomes milky in reflection and light brown in transmission at high fluence. But at low fluence, it is not possible to gauge by visual inspection alone whether PTFE and PLGA have been treated or not.
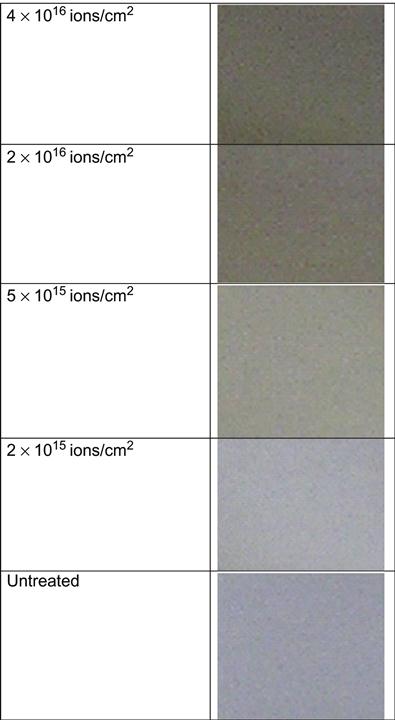
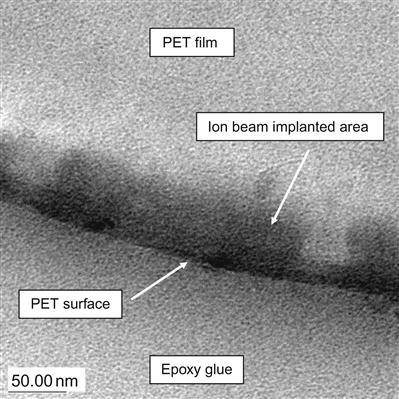
The color changes are observed only in the thin surface layer affected by the penetrating ions. The untreated side of the polymer films does not change. The dark area corresponds to areas of the polymer in which the ions have induced structural changes through their collision cascades with atoms in the polymer macromolecules. For example, the color change in a modified layer of PET after PIII with nitrogen ions of 20 keV energy is observed up to a distance of about 100 nm from the surface (Figure 4.2). The boundary between the modified and bulk unmodified layer is not sharp. The dark color decreases smoothly to white in the unmodified layer. Variation of the modified layer thickness is significant in comparison with the thickness of the layer itself. The color of the modified surface is stable and cannot be changed by solvents without completely removing the modified layer, for example by sand paper.
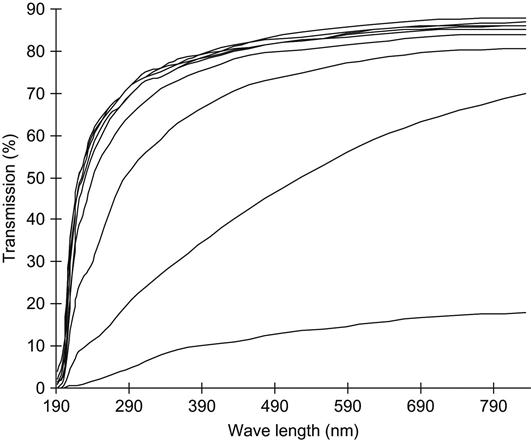
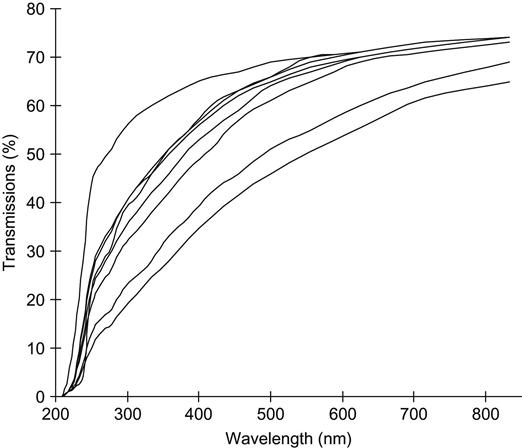
The changes in the modified layer can also be observed by their effect on the transmission UV-Vis spectra. The UV-Vis spectrum of an untreated polymer film shows peaks of light absorbance corresponding to transitions between energy levels of valence electrons in the polymer macromolecules. For most types of polymers, the spectra do not contain any absorbance lines in the visual region of the spectrum. The absorbance in the UV region depends on the presence of chromophoric groups like carbonyls or aromatic rings. In the spectra of ion beam-implanted polymers, an additional absorbance appears as a broad shoulder that is stronger at short wavenumbers and weaker at long wavenumbers (Figure 4.3). This absorbance appears due to carbonized structures, such as unsaturated carbon—carbon double bonds in macromolecules, aromatic ring structures, and condensed structures that include graphite-like planes. When the fluence or energy of the ions increases, the absorbance in this region also increases. The increase in the long wavelength shoulder indicates a higher concentration of carbonized structures (more absorbing centers) and an increase in the concentration of conjugated unsaturated structures. Therefore, changes in the optical absorbance (UV-Vis spectra) of polymers after ion implantation treatment can be used for the calibration of the ion implantation treatment fluence.
Darkening as a measure of fluence
For example, Figure 4.4 shows the absorbance as a function of fluence of polyethylene films at a number of wavelengths. As fluence increases, the absorbance curve rises. The curve is strongly nonlinear when plotted on both linear and logarithm scales. Despite its complex shape, the curve can be used for fluence calibration for previously uncharacterized equipment/treatment parameters and new PIII setups or ion beam implanters. This calibration curve was obtained using polyethylene films that were treated in an ion beam implanter in which the ion current density (and, therefore, the fluence) was directly measured using a Faraday cap.
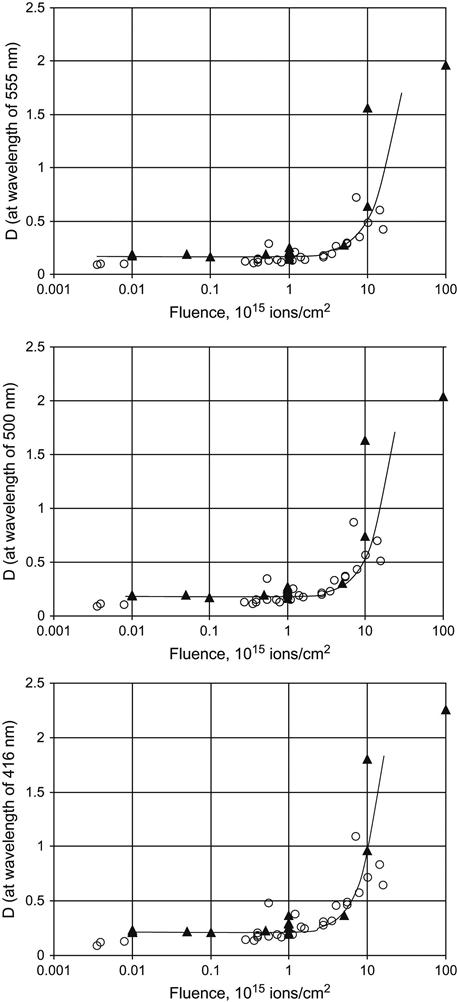
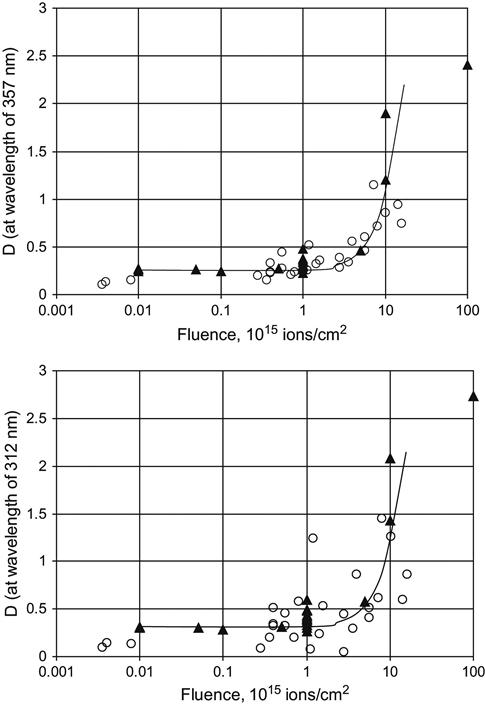
This curve is valid for 50 μm thick, low-density polyethylene (LDPE) films treated by nitrogen ions with an energy of 20 keV. New calibration curves are needed for treatments with other types of ions and different ion energies. The fluence was delivered in pulses of 300 μs duration at a frequency of 1 Hz. The calibration curve does not require a correction for electrical charging of the polyethylene film during the ion beam treatment, because the film is thin enough that electrical breakdown events regularly discharge the surface, preventing the buildup of any significant charge. The polyethylene was not deformed or melted, indicating that the film was not significantly heated during the ion beam treatment, either.
The calibration curves for 357, 416, 500, and 555 nm wavelengths give slightly different calibration coefficients, which can be used to estimate the standard deviation of the calculated fluence. Different wavelengths of the UV-Vis spectra are sensitive to different fluence ranges. The short wavelengths (250–350 nm) are more sensitive to low fluence, while the longer wavelength region (500–600 nm) is preferable for the estimation of high fluence.
If the bias voltage and, therefore, the energy of ions and ion current changes, the fluence that depends on the current density will also change. If a calibration curve for these conditions is not available, the new current density may be calculated. In some cases, for example for plasma immersion ion implantation or similar ion beam sources, the current density of the ion beam follows roughly the law:
(Eq. 4.1)
where I is the current and U is the bias applied to the high-voltage electrodes. With an increase in ion energy achieved by increasing the bias, the ion current and the corresponded fluence of ion beam treatment also increases. For a more accurate calculation, the current density distribution based on the plasma sheath dynamics must be recalculated for each different bias voltage.
If plasma immersion ion implantation is to be done using another type of ion, the plasma density would typically change, resulting in a different ion current through the sheath and the need for fluence recalculation or new calibration curve. For recalculation, the plasma density must be measured for each type of ion, including the ions used for calibration. For a rough estimation, the fluence could be recalculated proportionally to the plasma density:
(Eq. 4.2)
where F1 and d1 are the fluence and plasma density for the first type of ion, and F2 and d2 is the fluence and plasma density for the second type of ion.
A similar adjustment for changes in the plasma density must be made if the pressure of the working gas or magnetic field or configuration of plasma electrodes is modified. By measuring the new plasma density, a new value of the fluence can be calculated using Eq. (4.2).
A fluence estimation curve cannot be adjusted as described above when the configuration of the high-voltage electrodes is modified compared to that used to obtain the data for the calibration curve. In such a case, a new calibration curve must be developed. The only other way to potentially deal with the problem would be to conduct a calculation of the plasma sheath dynamics with the new geometry of the high-voltage electrodes, however this is much more complicated and less accurate than repeating the experimental measurement of the fluence with a Faraday cup to create a new calibration curve.
If the pulse parameters of the applied bias, such as pulse duration or pulse frequency, change, then the fluence can be recalculated. The adjustment can be made using a proportionality relation with pulse duration and pulse frequency as follows:
(Eq. 4.3)
where Fi is the fluence, fi is the frequency, and τi is the pulse duration of the i-regime of ion beam treatment.
The calibration procedure described above can give an estimation of fluence with an accuracy of ±10%. According to our experience, a more accurate measurement is not possible, due to fluctuations in the plasma density, the plasma sheath, the quality and composition of the polymer surface layer, and errors of the measurements.
Carbonization of the surface layer
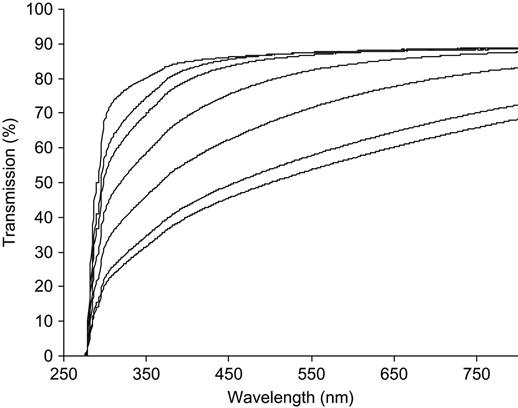
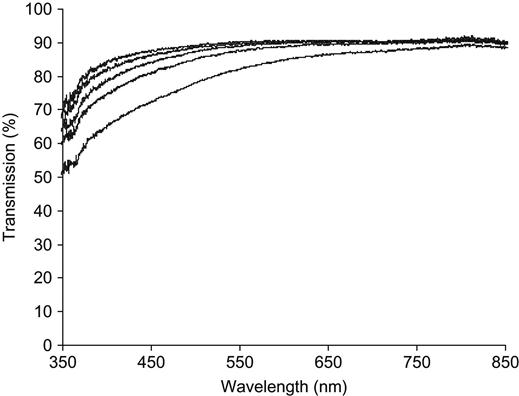
The absorbance of UV-visible light in the modified polymer also depends on the type of polymer, and, specifically, its degree of carbonization in response to ion implantation treatment (Figures 4.5–4.7). For example, PET (Figure 4.7) has oxygen atoms in the polymer backbone; its carbonization capability is lower than that of polyethylene, polystyrene, and polyvinyl chloride; and, thus, the UV-vis absorbance of the modified layer is weaker at the same ion fluence. Thus, carbonization decreases with an increase in the gaseous products available for release during the destruction of the macromolecules in the ion tracks. Examples of polymers with the lowest carbonization levels are PLGA and PTFE, which mostly decompose under any kind of irradiation. However, these polymers can be at least partially carbonized with ion implantation treatment.
The appearance of unsaturated carbon![]() carbon bonds in ion-implanted polymers in the form of diene structures and condensed aromatic structures, occurs in the local vicinity of the penetrating ion track. This localization of structural defects with high density leads to the appearance of unsaturated carbon clusters. The number and size of these clusters depends on the fluence and energy of the implanting ions, as well as the polymer type. At high fluence, there is a high concentration of structural defects, resulting in a larger number of carbon atoms in each cluster and consequently larger clusters. However, even at the highest fluences, continuous carbon clusters are not observed in the irradiated polymers. The carbon clusters have sp2 island structures and are separated by sp3 bonded structures, oxygen-containing groups, and residual hydrogen-containing groups. The presence of carbon clusters significantly decreases the energy gap between the conduction and valence bands in irradiated polymers. Consequently, less energy is required for electrons to make the transition to the conduction band, and the conductivity of the irradiated polymer in the modified surface layer is greatly increased. The band gap width may be calculated using the Tauc formula for semiconductors:
carbon bonds in ion-implanted polymers in the form of diene structures and condensed aromatic structures, occurs in the local vicinity of the penetrating ion track. This localization of structural defects with high density leads to the appearance of unsaturated carbon clusters. The number and size of these clusters depends on the fluence and energy of the implanting ions, as well as the polymer type. At high fluence, there is a high concentration of structural defects, resulting in a larger number of carbon atoms in each cluster and consequently larger clusters. However, even at the highest fluences, continuous carbon clusters are not observed in the irradiated polymers. The carbon clusters have sp2 island structures and are separated by sp3 bonded structures, oxygen-containing groups, and residual hydrogen-containing groups. The presence of carbon clusters significantly decreases the energy gap between the conduction and valence bands in irradiated polymers. Consequently, less energy is required for electrons to make the transition to the conduction band, and the conductivity of the irradiated polymer in the modified surface layer is greatly increased. The band gap width may be calculated using the Tauc formula for semiconductors:
(Eq. 4.4)
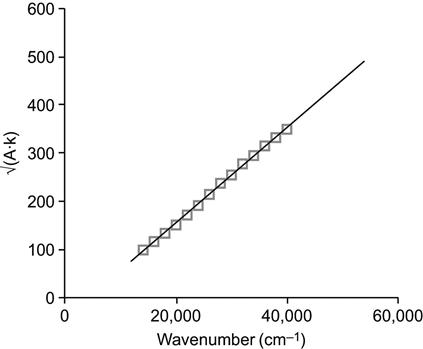
where A(E) is the absorbance at photon energy E, Eg is the band gap, and B is a constant. To determine the band gap, Eg, graphically, the UV-vis spectra is plotted in Tauc coordinates:
(Eq. 4.5)
where k(cm−1) is the wavenumber and A is the absorbance calculated from the UV-vis spectrum, as A=log(100/T), where T is the transmittance (%). Fitting of the curve (Eq. (4.5)) by a linear function gives the coefficients (Eq. (4.4)) for the calculation of Eg (Figure 4.8).
We must note that the electronic band gap value calculated from the UV spectrum by Eq. (4.4) can serve only as an estimate of the real electronic structure of the carbonized clusters in the irradiated polymer. This method does not consider the distribution of the clusters by size, the regularity of the clusters, or their depth distribution in the polymer surface layer, all of which influence the energy levels of the π-electron system in the irradiated polymer. Despite of the absence of structural detail, the changes of the average band gap in the surface layer of the polymer when irradiated using different ion implantation treatment parameters can be estimated in this way.
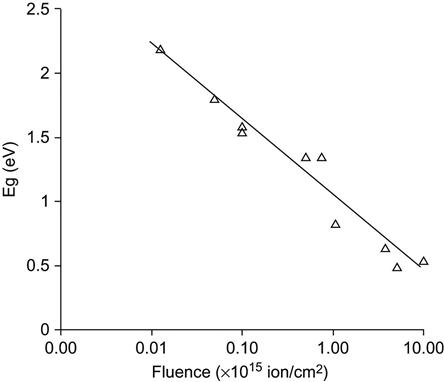
The typical dependence of band gap on the ion fluence (F) follows an asymptotic curve described by the exponential function:
(Eq. 4.6)
where Eg∞ is the band gap of the completely carbonized polymer layer, ε is the specific growth rate of the carbon clusters with ion fluence, Eg0 is the band gap of untreated polymer. An example showing the fluence dependence of the band gap for a modified polyethylene surface layer after nitrogen ion implantation is presented in Figure 4.9. The band gap of the untreated polymer is about 2–3 eV for different kinds of polymers, which is typical of electrical insulators with low conductivity (ρ=1012–1015 Ohm cm). The polymers modified with high fluence have a band gap close to amorphous carbon or graphite 0.6 eV. The conductivity of the implanted layer can reach up to 102–100 Ohm cm. However, it should be noted that the measured surface conductivity of the treated polymer samples remains low, due to the fact that the modified surface layer is very thin.
Raman spectroscopy analysis of the modified layer
The carbonization of the surface layer is also observed by changes in the Raman spectrum. Raman spectroscopy is based on the scattering of monochromatic laser light by molecular vibrations. The intensity of Raman lines is proportional to the derivative of the quadrupole moment of the scattering molecule on the normal vibration coordinate. As a result, the intensity is higher for nonpolar fragments of the molecule than it is for polar fragments. An advantage of Raman spectroscopy is the high intensity of vibrational modes in carbonized structures, such as diene groups and aromatic rings.
The modified layer of the polymer after ion beam treatment is typically only a few tens to a few hundred nanometers thick, and it is difficult to get Raman spectra from this thin modified layer on top of the unmodified polymer. Good-quality Raman spectra from the thin treated layer can be recorded using an optical microscope, when the exciting laser beam is focused on the thin surface layer of the polymer and the scattered light is collected in reflection. As a result, the micro-Raman spectra in a layer some tens of μm thick can be recorded. Best results are typically obtained using an exciting laser wavelength in the visual spectral region; in comparison, excitation in the near-infrared may result in overheating (or even burning) of the polymer due to the high-intensity laser beam and high absorbance of the carbonized layer.
If Raman spectra are excited by a laser line in the visual light region, the laser beam excites the energetic levels of the π-electrons in carbon clusters. As a result, the Raman spectra show resonance excitations and the intensity increases by 50–230 fold in comparison with ordinary Raman spectra. This resonance effect gives significant amplification of the Raman signal from the thin carbonized layer, making it significantly stronger than the Raman signal from the bulk polymer.
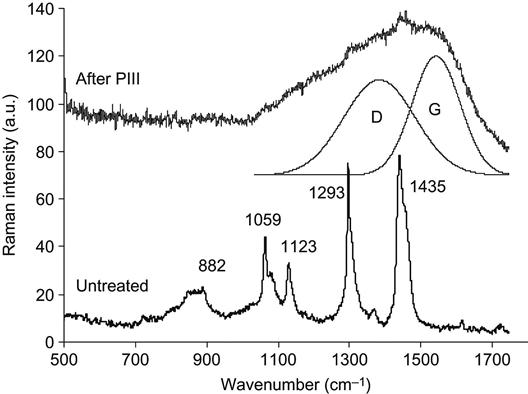
As an example, the Raman spectra of a polyolefin elastomer EG-8200 (co-polymer of ethylene and octene-1) before and after PIII are presented in Figure 4.10. The spectra were recorded with a microscope attachment that focuses the excitation laser beam in a thin layer at the polymer surface. However, the focused spot of the laser beam is larger than the thickness of the modified layer on the polymer surface so the Raman spectra typically contain features also from unmodified parts of the polymer. The Raman spectrum of the unmodified polyolefin elastomer EG-8200 contains narrow lines associated with macromolecular vibrations at 846, 882, 1059, 1123, 1293, 1366, and 1435 cm−1. The spectrum of the PIII-treated elastomer does not contain these narrow lines, but rather shows a high-intensity broadband from 1000 to 1700 cm−1. This broadband is attributed to vibrational states in carbon structures. Two peaks can be fitted to this band: the G-peak at 1543 cm−1 is attributed to vibrations of the E2g mode in graphite structures, where the carbon has sp2 valence electron hybridization; the D-peak at 1384 cm−1 is attributed to A1g mode graphite vibrations. The A1g mode becomes visible in the Raman spectra of graphitic structures that are disordered by the presence of carbon structures with sp3 hybridization on the edges of the graphitic clusters. The ratio of D/G peak intensities and positions of the lines can be used for analysis of the carbon structure and to calculate the size of the graphitic clusters.
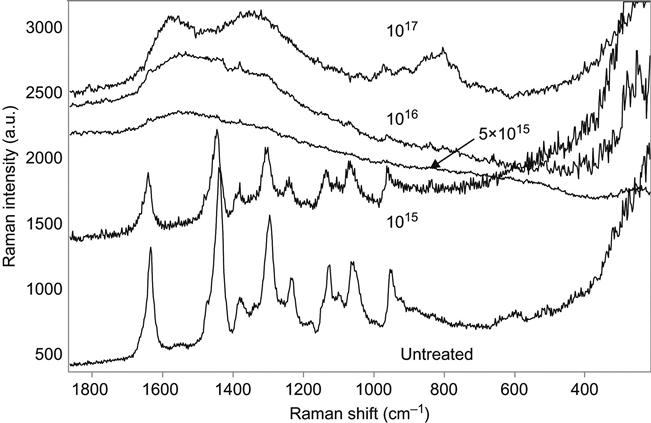
In comparison with the olefin elastomer, the presence of a significant amount of oxygen in the backbone of polyethylene terephtalate macromolecules increases the etching rate and decreases the amount of carbon collected in the surface layer during ion treatment. The Micro-Raman spectra of a PET film shows that the vibrational lines of the PET macromolecules remain in the spectra even after high-fluence ion implantation treatment (Figure 4.11). These narrow lines at 633, 858, 1096, 1291, 1615, and 1727 cm−1 observed in the spectrum of the unmodified PET are superimposed on top of the wide carbon bands that appear in the spectra after PIII modification. The intensity of the PET macromolecular lines decreases with ion treatment fluence. However, even at the highest fluence used (1017 ions/cm2), these lines are still present in the Raman spectrum. The intensity of the carbon D-peak and G-peaks increases with ion fluence, but the shape of the carbon peaks does not change.
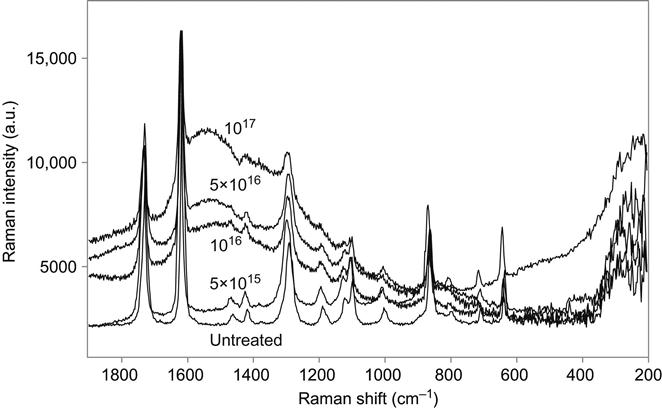
Figure 4.12 shows spectral changes observed after ion implantation into polyamide-6.6 (Ultramid@A) as measured by micro-Raman spectroscopy. The spectrum of the unmodified polyamide contains narrow lines from the characteristic vibrations of the macromolecules. After PIII treatment with low fluence, the spectrum of the macromolecular vibrations becomes weaker and a broadband from 1800 to 600 cm−1 associated with vibration of the carbon structures appears. With higher ion fluence, the carbon band becomes more intense and narrower. The shape of this band is similar to that for EG-8200 co-polymer and PET up to a PIII ion fluence of 1016 ions/cm2 (i.e., an intense peak at 1540 cm−1 with a low-frequency shoulder). At the highest fluence of 1017 ions/cm2, the band splits into two narrow lines at 1589 and 1361 cm−1, corresponding to the G and D peaks described above. These lines are attributed to vibrational modes in the carbon structure of the surface modified layer of polyamide.
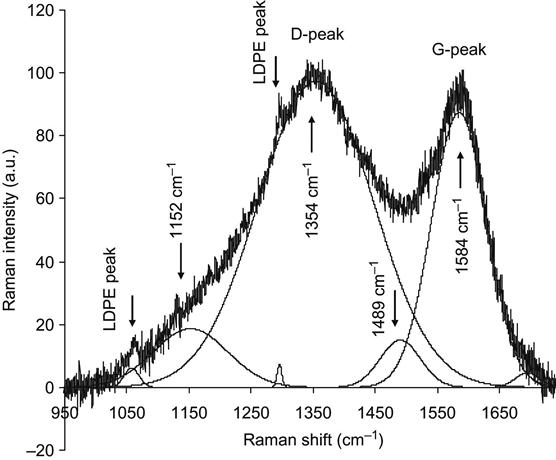
The doublet of narrow separated G and D peaks lines is observed in the Raman spectra of highly carbonized polymers. These characteristic lines do not appear after low-energy ion treatment (lower 20 keV) or at low fluence (lower 1016 ions/cm2). Also, these doublets do not appear in all kinds of polymers. We observed the doublet only in polymers with a high rate of carbonization, for example, polyethylene (Figure 4.13). The micro-Raman spectra of unmodified polyethylene sometimes show a high level of fluorescence and vibrational lines may not be discernable on the wide and intense background fluorescence signal. However, the spectrum of PIII-treated polyethylene contains clearly visible vibrations of the carbonized structures at 1588 and 1353 cm−1.
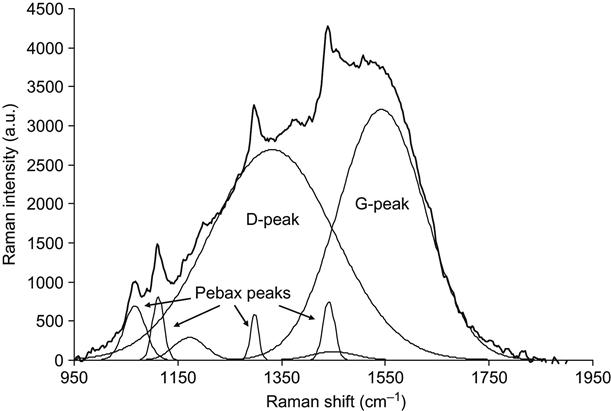
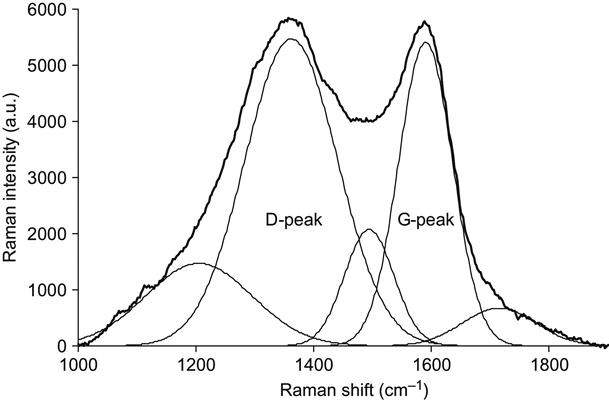
The influence of ion energy on the carbonized structures can be observed by looking at the example of a PIII-treated Pebax co-polymer. The micro-Raman spectra of the Pebax co-polymer are presented in Figures 4.14 and 4.15. The same fluence, type of ions, pulse duration, and frequency was used for all treatments so that only the ion energy was varied. At the lower energy, the Raman spectrum contains the graphitic doublet and narrow peaks of the Pebax macromolecular vibrations. At high ion energy, the graphitic structure dominates over the macromolecular vibrational lines, and the carbon G- and D-peaks become sharper and separated.
Detailed analysis of the carbonized layer structure can be performed based on a three-stage model of changes in the Raman spectra, depending on the carbon structure formed [1]. For the analysis, we have to consider carbon atoms in different hybridization states. The electron configuration of free carbon atoms is the 1 s22 s22p2 state. In molecules, the electron orbits of carbon exist in the following hybridization states: sp or sp2 or sp3, depending on the kind of molecule. Due to these different hybridization states, carbon has different allotrope forms: diamond-like (sp3) and graphite-like (sp2). Due to different ordering and orientations of the carbon atoms in the different hybridization states, clustering, and hydrogen content, carbon structures are classified into a wide variety of forms as follows: diamond, diamond-like carbon DLC, amorphous carbon a![]() C, and hydrogenated amorphous carbon a
C, and hydrogenated amorphous carbon a![]() C:H, tetrahedral amorphous carbon ta
C:H, tetrahedral amorphous carbon ta![]() C and hydrogenated tetrahedral amorphous carbon ta
C and hydrogenated tetrahedral amorphous carbon ta![]() C:H, graphite, graphene, fullerite (fullerene-containing), carbon nanotubes, and nanofoam, chaoite, and carbene. The transformation of the target polymer under ion implantation is a random process, guided by energy minimization and the number of configurations accessible to the system through the mobility provided by each ion impact [2–4]. The high energy of the implanted ions provides enough local mobility to allow volume relaxation driving the carbon clusters into energetically favored, predominately sp2 coordinated forms, such as nanocrystalline graphite or sp2 coordinated amorphous carbon. High intrinsic stress, pressure, or volume constraints would be required to allow diamond or tetrahedral amorphous carbon (t
C:H, graphite, graphene, fullerite (fullerene-containing), carbon nanotubes, and nanofoam, chaoite, and carbene. The transformation of the target polymer under ion implantation is a random process, guided by energy minimization and the number of configurations accessible to the system through the mobility provided by each ion impact [2–4]. The high energy of the implanted ions provides enough local mobility to allow volume relaxation driving the carbon clusters into energetically favored, predominately sp2 coordinated forms, such as nanocrystalline graphite or sp2 coordinated amorphous carbon. High intrinsic stress, pressure, or volume constraints would be required to allow diamond or tetrahedral amorphous carbon (t![]() aC) to form, so these are typically absent [2–4]. An amorphous structure containing sp3 bonds forms in regions where sufficient hydrogen remains to partially hydrogenate the structures.
aC) to form, so these are typically absent [2–4]. An amorphous structure containing sp3 bonds forms in regions where sufficient hydrogen remains to partially hydrogenate the structures.
A phenomenological model (proposed by Ferrari and Robertson [1]) is useful for the analysis of carbon structures by Raman spectroscopy. The analysis is based on the G-peak position and I(D)/I(G) ratio of D-peak and G-peak intensities. The carbon structure is considered as a stage of amorphization from well-ordered graphite structures (sp2) to the tetrahedral amorphous carbon (sp3). Four different forms of the carbon are considered:
1. graphite (well-ordered infinite graphite sp2 bonded planes);
2. nanocrystalline graphite (graphitic sp2 clusters with limited size that are separated by edge defects, but sp2 hybridization of the carbon remains);
3. amorphous carbon a![]() C (graphitic sp2 clusters with smaller cluster size and about 20% sp3 bonds);
C (graphitic sp2 clusters with smaller cluster size and about 20% sp3 bonds);
4. tetrahedral amorphous carbon (sp3 hybridized bonds dominate and form structures with inclusions that contain sp2 hybridization).
The Raman spectra of carbon have a resonance character, and analysis must be acquired using a suitable wavelength of laser light excitation. Let us consider Raman spectra excited by a 514 nm laser line. The Raman spectra of well-ordered graphite are characterized by a G-peak positioned at 1580 cm−1 and I(D)/I(G)=0. With disordering of the graphitic structures, the G-peak shifts to a position at 1600 cm−1, and I(D)/I(G) increases to 2. This corresponds to the nanographite (nc-graphite) structure. The La characteristic size of the graphitic clusters can be calculated by Tuinstra and Koenig’s formula [5]:
(Eq. 4.7)
where C(λ) is constant for a given laser excitation wavelength. For a 515.5 nm wavelength, C(λ) is about 4.4 nm [1]. This formula works down to La values of 2 nm. Further disordering converts the edge defects into a sufficiently significant amount of sp3 bonds; however, the graphitic structure is still a major fraction (up to 80%). The G-peak then shifts to 1510 cm−1 and the I(D)/I(G) ratio decreases to about 0.2. The position of the G-peak depends on excitation laser line. The La characteristic size of graphite clusters becomes proportional to the I(D)/I(G) ratio as follows:
(Eq. 4.8)
where C′(λ) is about 0.55 nm−2. This is a![]() C amorphous carbon. The graphitic clusters are now less than 2 nm in size.
C amorphous carbon. The graphitic clusters are now less than 2 nm in size.
If the number of sp3 orbitals increases such that ta![]() C tetrahedral amorphous carbon is formed, then the position of the G-peak shifts from 1510 to 1570 cm−1. The I(D)/I(G) ratio decreases to 0.
C tetrahedral amorphous carbon is formed, then the position of the G-peak shifts from 1510 to 1570 cm−1. The I(D)/I(G) ratio decreases to 0.
In polymers after ion beam treatment, we have never seen Raman spectra corresponding to well-ordered graphite or ta![]() C structures. Usually, the carbon layer has a structure between nc-graphite and amorphous carbon.
C structures. Usually, the carbon layer has a structure between nc-graphite and amorphous carbon.
By using this model, the Raman spectra of ion beam-implanted polymers can be further analyzed. Returning to Figure 4.14, which shows the Raman spectrum of Pebax after PIII with 20 keV energy nitrogen ions, the fitting of the spectrum by Gaussian peaks gives narrow lines related to polyamide/polyether macromolecular vibrations as well as broad peaks associated with the carbonized structures at 1542 cm−1 (G-peak) and 1332 cm−1 (D-peak). The I(D)/I(G) ratio is thus 1.2. The G-peak position and I(D)/I(G) ratio correspond to carbon structures between the nc-graphite and a![]() C states. Therefore, the carbon cluster size, La, can be calculated using the formula Eq. (4.8), giving a value of 1.5 nm.
C states. Therefore, the carbon cluster size, La, can be calculated using the formula Eq. (4.8), giving a value of 1.5 nm.
Returning to Figure 4.15, which shows the Raman spectrum of Pebax after PIII with 30 keV energy nitrogen ions, fitting of the spectrum by Gaussian peaks gives broad peaks at 1590 cm−1 (G-peak) and 1362 cm−1 (D-peak). The I(D)/I(G) ratio is 1.74. The G-peak position and I(D)/I(G) ratio correspond to carbon structures between the nc-graphite and a![]() C states. But the carbon structure of the present sample is closer to nc-graphite than the sample after PIII with 20 keV ion energy. The carbon cluster size is again calculated by the formula Eq. (4.8), giving an La value of 1.8 nm. This increase in the nanocrystal size is associated with free energy minimization being able to occur over a larger volume of mobile atoms, as created by an ion impact with greater energy [3].
C states. But the carbon structure of the present sample is closer to nc-graphite than the sample after PIII with 20 keV ion energy. The carbon cluster size is again calculated by the formula Eq. (4.8), giving an La value of 1.8 nm. This increase in the nanocrystal size is associated with free energy minimization being able to occur over a larger volume of mobile atoms, as created by an ion impact with greater energy [3].
Similar fitting applied to the Raman spectra of polyethylene after PIII shows that the nc-graphite structure is observed with graphitic clusters of 2 nm size.
Electron spin resonance spectroscopy analysis of structural changes
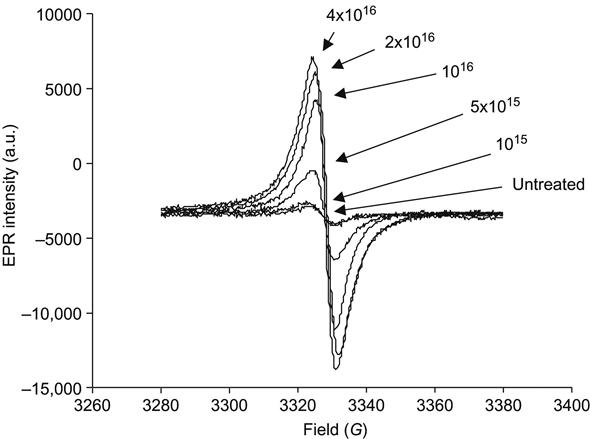
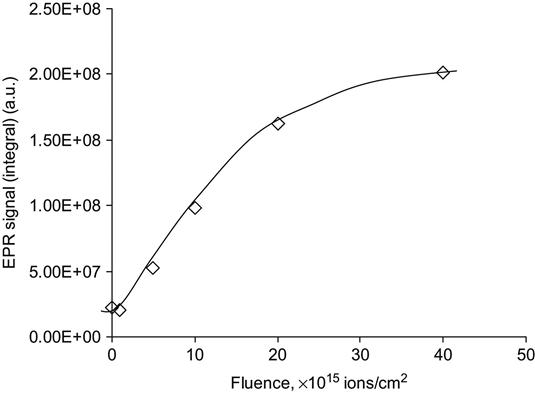
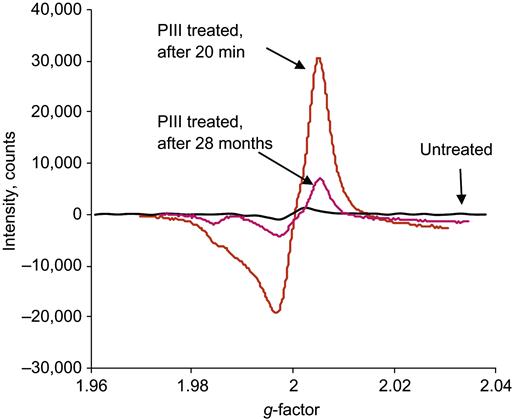
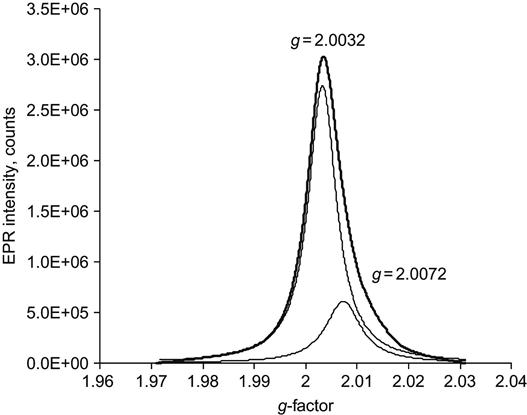
The effects of the bonding rearrangements and dehydrogenation associated with carbonization can also be observed by the presence of unpaired electrons in graphite-like structures revealed by electron paramagnetic resonance or electron spin resonance (EPR or ESR) spectroscopy. The EPR spectra of polyethylene after PIII treatment with 20 keV nitrogen ions are presented in Figure 4.16. A symmetrical peak with a g-factor of 2.0028 is observed. This value is close to the g-factor found in the noncoupled electron EPR spectra of amorphous carbon structures (2.0027), which are formed by carbon-thin film deposition techniques and by pyrolysis of polymers at high temperature in vacuum or in inert atmospheres. The signal intensity is related to the total number of uncoupled electrons in carbon structures of the ion-implanted polymer sample. The integral intensity of the EPR signal increases with the ion fluence applied in PIII treatment, as shown in Figure 4.17. The signal becomes visible at a fluence of 1015 ions/cm2 and increases asymptotically as fluence increases. At high fluence (5×10¹⁶ ions/cm2 and higher), the signal intensity reaches its saturation point, indicating saturation of the carbonization process in the modified surface layer of the polymer. Further increases in fluence do not lead to increases in the number of unpaired electrons. The EPR signal decays with storage time after the PIII treatment, but it remains detectable over a period of a few years (e.g., Figure 4.18) while the sample is stored under laboratory conditions (25°C in air).
The decay process of the radicals containing unpaired electrons in a PIII-treated polymer can be described by polychronic kinetics. The radical concentration as a function of time t and temperature T can be written as:
(Eq. 4.9)
Where CR0- is the initial concentration of radicals, Emin and Emax are boundaries of the energy distribution function f(E), and G[k(E),t] is the ensemble of kinetic equations for radicals with activation energy E. Most radical reactions can be described by first order reactions with kinetic equation:
(Eq. 4.10)
or the second-order reactions with the kinetic equation:
(Eq. 4.11)
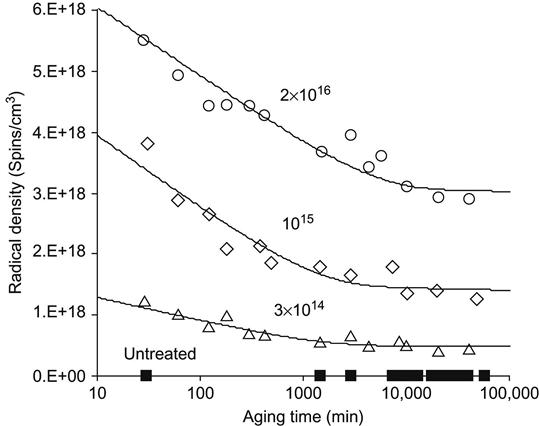
The fitting of experimental EPR data with Eqs. (4.9–4.11) gives a solution with a constant, indicating that unpaired electrons in the carbonized polymer surface layer do not disappear even after a long duration after the ion implantation treatment (Figure 4.19). The carbonized clusters, consisting of aromatic rings with short fragments of polymer macromolecules at the edges, help stabilize the unpaired electrons. The radicals in the residual macromolecular fragments can migrate and collapse according to the radical reactions considered in Chapter 3, whereas the radicals located at the edges of the aromatic structures or in defect sites of the carbonized clusters are more stable. These unpaired electrons are delocalized in the π-orbitals of the aromatic rings. The probability cloud of the electron is larger, decreasing the probability of finding the unpaired electron in a position at another carbon atom, where it can interact with another electron to form a pair. Moreover, the migration of vacancies is impossible in carbonized structures. Therefore, the lifetime of the unpaired electrons is much longer in carbonized structures than in the damaged macromolecules.
The EPR signal depends on the kind of polymer used. In case of more complicated signals, a fitting procedure can be used to identify the types of radicals present. An example with two kinds of radicals (carbon and sulfur) is presented in Figure 4.20. Sometimes, if the concentration of certain noncarbon elements is too high, a graphite-like carbonized structure cannot form and the radicals are less stable. An example of such nonstabilized radicals occurs in PDMS, where the carbon cannot form large graphite-like clusters, due to the presence of high levels of silicon.
The fitting of experimental EPR data with Eqs. (4.9–4.11) can give “an initial” concentration of the radicals “immediately” after PIII. However, the measured EPR signal can only be recorded some time after the ion beam treatment. The kinetics of radicals in residual macromolecules is much faster at room temperature than the time needed to make an EPR measurement. Therefore, the fast kinetics of radicals is not observed. For example, an estimation of the damaged chemical bonds in polystyrene (PS) by the TRIM/SRIM code gives a value 70,000 times higher than that calculated from the experimental data. This is because TRIM/SRIM codes calculate all bond-breaking events but do not take account of the formation of new bonds that occurs as energy is dissipated after each ion impact during ion implantation treatment and because many of the rapid radical decay reactions that take place after the treatment occur on very short times scales prior to the EPR measurement. Therefore, with EPR measurements, we can see only the remaining radicals stabilized in condensed aromatic clusters.
Fourier-transform infrared spectroscopy analysis of structural changes
The effects of structural transformations that occur in polymer surface layers after ion implantation treatment can be observed also by Fourier-transform infrared (FTIR) spectroscopy measured using an attenuated total reflection (ATR) crystal accessory. The spectra show the vibrational modes of molecules in the modified layer. The intensity of the spectral lines is proportional to derivative of the dipole moment of the molecule on the vibrational coordinate. Therefore, polar fragments of macromolecules are best observed in FTIR spectra.
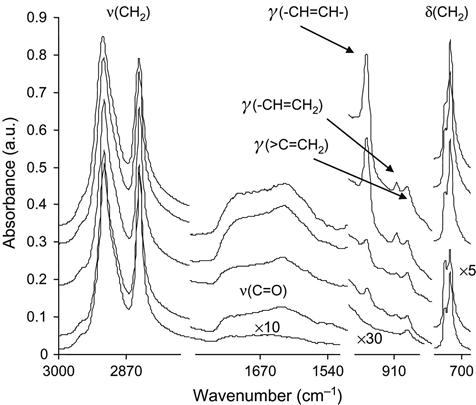
In the ATR mode of FTIR spectroscopy, the treated surface of the polymer sample is placed in contact with an ATR prism crystal with a high refractive index in the infrared region. The crystal must be transparent in the infrared region. Usually, crystals of Ge (n=4.37), KRS-5 TlBr/TlI mixture (n=2.45), or KRS-6 ZnSe (n=2.49) are used for measurements in the mid infrared region (4000–700 cm−1). Detailed information about FTIR ATR spectroscopy can be found in Ref. [6]. The sample is pressed onto the crystal to enable good optical contact between the crystal and the polymer surface. For this reason, soft or elastic polymers as well as thin films of polymers are preferable for the measurement of ATR FTIR spectra. An evanescent field of the totally internally reflected infrared beam in the ATR crystal penetrates into the surface layer of the sample. Such an evanescent field arises when light crosses the boundary between an optically dense medium to an optically soft medium at an angle higher than the critical angle. Since the evanescent field is strongest at the interface between the two media, decaying exponentially in the polymer, the FTIR ATR spectra give information about a thin surface layer of the sample. The thickness of infrared beam penetration into the polymer can be calculated using the following equation:
(Eq. 4.12)
 (Eq. 4.12)
where λ is the wavelength of the infrared beam, α is the angle of the crystal prism (incident angle of the infrared beam), n0 is the refractive index of the crystal, and n1 is the refractive index of the polymer sample. Usually, the thickness of the polymer layer probed is 0.2–0.6 µm for a Ge crystal, and 0.8–2.5 µm for KRS-5 crystal in the mid IR spectral region (3000–1000 cm−1). Therefore, the analyzed layer is usually thicker than the modified polymer layer (about 0.01–0.1 µm) after ion treatment with midrange ion energies. Therefore, the FTIR ATR spectrum shows the vibrational modes of macromolecules in the bulk unmodified polymer as well as in the thin modified layer.
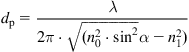
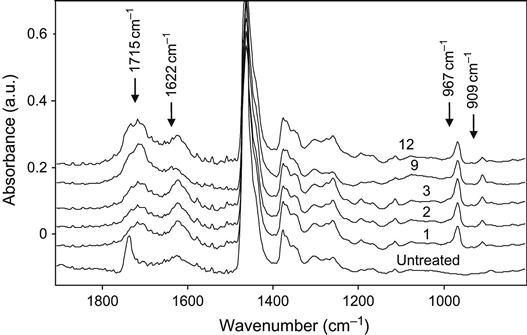
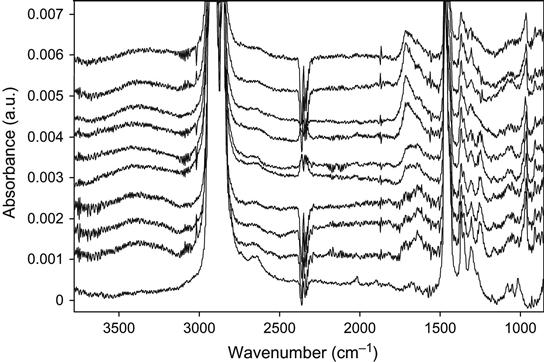
As an example, the FTIR ATR spectrum of polyethylene after ion treatment is presented in Figure 4.21. All the spectra show strong vibration lines of the polyethylene macromolecule at: 2920 cm−1 and 2850 cm−1 associated with C![]() H stretch vibrational modes; 1462 cm−1 and 1375 cm−1 associated with CH2 and CH3 deformation vibrational modes; and 720 cm−1 and 730 cm−1 doublet associated with out-of-plane CH2 vibrational modes. As fluence increases, the intensity of all these spectral lines decreases, due to the progressive damage of the macromolecules and the formation of a carbonized layer. The carbonized layer is hard and optical contact of the polyethylene sample with the ATR crystal worsens and the bulk unmodified polymer is further from ATR crystal surface so its contribution to the spectra is reduced as the ion fluence increases. The spectral changes are typically weak and cannot be recognized without expanding the absorbance scale. The basic vibrational lines of the polyethylene macromolecule become broader at high fluence (1016 ions/cm2) because of an accumulation of structural defects.
H stretch vibrational modes; 1462 cm−1 and 1375 cm−1 associated with CH2 and CH3 deformation vibrational modes; and 720 cm−1 and 730 cm−1 doublet associated with out-of-plane CH2 vibrational modes. As fluence increases, the intensity of all these spectral lines decreases, due to the progressive damage of the macromolecules and the formation of a carbonized layer. The carbonized layer is hard and optical contact of the polyethylene sample with the ATR crystal worsens and the bulk unmodified polymer is further from ATR crystal surface so its contribution to the spectra is reduced as the ion fluence increases. The spectral changes are typically weak and cannot be recognized without expanding the absorbance scale. The basic vibrational lines of the polyethylene macromolecule become broader at high fluence (1016 ions/cm2) because of an accumulation of structural defects.
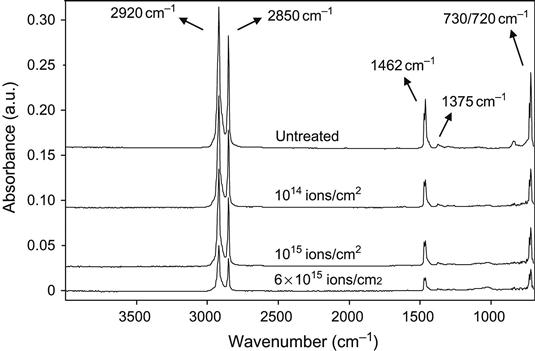
For quantitative analysis, the FTIR ATR spectra must be normalized with respect to the intensity of the main lines of the unmodified polymer (Figure 4.22). The normalized spectra then show changes that are related to the structure of polymer after modification.
In the spectra of treated polyethylene, the lines of the carbonyl group in the 1650–1800 cm−1 region appear as a result of oxidation process of the surface after ion treatment. The oxidation is caused by reactions of the active surface layer with atmospheric oxygen that occur mostly after removal of the modified sample from the vacuum chamber of the implanter. If the sample is not exposed to oxygen, the oxidation effect is not observed. We did not see any oxygen-containing group lines in the 1650–1800 cm−1 region of FTIR ATR spectra of polyethylene after PIII, when the spectra were recorded inside the vacuum chamber prior to contact with the atmosphere after PIII.
The band of the carbonyl group vibrations is very broad and contains some individual peaks. Curve fitting and deconvolution of the carbonyl band can give a number of narrow peaks, which can be attributed to carbonyl bond vibrations in different kinds of oxygen-containing groups (see Chapter 10). Some of the lines can be interpreted based on both the well-known spectra of individual substances as well as on the spectra of the surface after selected reactions with separate oxygen-containing groups. For example, lines at 1685 and 1692 cm−1 can be attributed to unsaturated ketones; lines at 1706 cm−1 to the carboxylic acid groups; lines at 1726 cm−1 to saturated ketones; lines at 1740 cm−1 to aldehydes; and lines at 1754 and 1765 cm−1 to esters. The same lines are present in the spectra of polyethylene after UV light irradiation. Some of the lines (e.g., 1712 and 1718 cm−1 and other high-frequency lines) could be attributed to carbonyl groups on the edges of the graphitic or aromatic ring structures.
The shape of the carbonyl group band is unchanged after washing of the modified polyethylene surface with organic inactive solvents, such as acetone, pentane, and toluene. This means that the oxidized layer is bonded to the polymer network and cannot be removed from the polymer. It was found that the shape of the carbonyl line was the same for ion-implanted polyethylene regardless of whether it was treated with nitrogen, oxygen, or argon ions up to a fluence of 1016 ions/cm2. This seems reasonable, since the concentration of implanted ions in the treated polymer surface layer is significantly lower than the concentration of polymer target atoms. The implanted ions play the role of an energetic projectile that damages the macromolecules by energy deposition into the structure, but they are not present in sufficient concentrations to significantly affect the composition of the implanted layer.
For example, the FTIR ATR spectra of polyethylene after ion beam treatment by vacuum oil ions are presented in Figure 4.23. The polyethylene film was treated with a very high-current-density ion beam (60 A/cm2). However, the pulse was short (50 ns), so that the average current density was low enough (1 µA/cm2) to avoid overheating of the polyethylene film. The spectrum of the unmodified polyethylene shows lines typical of polyethylene macromolecule vibrations and additionally a weak peak at 1737 cm−1 related to the antioxidant in the film. After ion beam treatment, a wide band in the 1600–1750 cm−1 region of the spectrum appears as a result of surface layer oxidation. There are no additional lines associated with vacuum oil molecules or their fragments in the FTIR ATR spectra.
The 1620–1670 cm−1 region of the spectra can be attributed to C![]() N vibrations in the FTIR spectra. Sometimes weak lines that indicate C
N vibrations in the FTIR spectra. Sometimes weak lines that indicate C![]() N and C
N and C![]() N groups are observed by x-ray photoelectron spectra (XPS), too. The nitrogen-containing groups appear in the modified polymer due to implanted nitrogen ions and/or reaction with atmospheric nitrogen after removal of the treated polymer from the vacuum chamber to atmosphere. Compared to the previously discussed lines, the C
N groups are observed by x-ray photoelectron spectra (XPS), too. The nitrogen-containing groups appear in the modified polymer due to implanted nitrogen ions and/or reaction with atmospheric nitrogen after removal of the treated polymer from the vacuum chamber to atmosphere. Compared to the previously discussed lines, the C![]() N and C
N and C![]() N lines are more difficult to interpret because molecular nitrogen is less active than oxygen and the reaction of molecular nitrogen with radicals in the polymer surface layer is less probable; also the extinction coefficient of the v(C
N lines are more difficult to interpret because molecular nitrogen is less active than oxygen and the reaction of molecular nitrogen with radicals in the polymer surface layer is less probable; also the extinction coefficient of the v(C![]() N) lines is lower than that for the carbonyl group vibration. Therefore, even with the clear presence of nitrogen-containing groups in the surface layer of the polymer after ion beam treatment, the contribution of the v(C
N) lines is lower than that for the carbonyl group vibration. Therefore, even with the clear presence of nitrogen-containing groups in the surface layer of the polymer after ion beam treatment, the contribution of the v(C![]() N) line intensity to the 1650–1800 cm−1 band of the FTIR spectra is expected to be lower than that of the carbonyl line intensity.
N) line intensity to the 1650–1800 cm−1 band of the FTIR spectra is expected to be lower than that of the carbonyl line intensity.
In the 1600–1650 cm−1 region, the lines of unsaturated carbon–carbon structures are observed and attributed to vibrations in C![]() C bonds. Such lines have quite low intensity in the infrared spectra and are overlapped by carbonyl group lines. More intense lines attributed to out-of-plane C
C bonds. Such lines have quite low intensity in the infrared spectra and are overlapped by carbonyl group lines. More intense lines attributed to out-of-plane C![]() H vibrations in unsaturated groups are observed in the 800–1000 cm−1 region:
H vibrations in unsaturated groups are observed in the 800–1000 cm−1 region:
| 887 cm−1 for the vinyliden group | >C |
| 906 cm−1 for the vinyl group | |
| 964 cm−1 for the vinylen group |
These lines are situated in the transparent region of the FTIR spectrum of polyethylene, and so are clearly observed after ion treatment.
FTIR spectra can be used for quantitative analysis of structural changes in the polymer surface layer after ion beam treatment. The analysis is based on the Beer–Lambert–Bouguer law:
(Eq. 4.13)
where I0 is the incident light intensity, I is the transmitted light intensity, d is thickness of absorbing sample, C is the concentration of absorbing groups, ε is the extinction coefficient, and A is the value of the absorbance.
In FTIR ATR spectroscopy, the thickness d is limited to the effective propagation depth of the infrared beam and this depends on wavelength. Therefore, FTIR ATR spectra have absorbance varying across the spectral regions. However, practically, the absorbance also depends on the quality of optical contact between the ATR crystal and the sample. Such effects preclude using the Beer–Lambert–Bouguer law directly for quantitative analysis of the spectra. However, relative quantitative analyses of the structure can be performed using spectra normalization. For analysis, the absorbance (intensity) of spectral lines which are related to the vibrations of the structure (A1) being studied must be normalized with respect to the intensity of lines (A2) which are related to stable groups or structures (internal standard):
(Eq. 4.14)
where λ1 and λ2 are the positions of the lines 1 and 2. The presence of a wavenumber is due to different penetration depths of the infrared beam into the sample in ATR mode. Therefore, if the sample has a gradient structure, as in the case of ion beam-treated polymers, the spectral information at the λ1 and λ2 wavelengths comes from different layers. Therefore, Eq. (4.14) indicates that the internal standard line position (λ1) should be as close as possible to the position of the analyzed line (λ2).
For example, for the analysis for the carbonyl group line in the 1600–1750 cm−1 spectral region, the 1462 cm−1 line associated with bending vibrations in the polyethylene macromolecules can be used as the internal standard line (Figure 4.24).
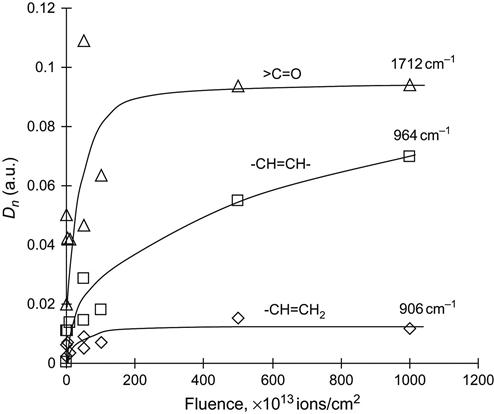
The analysis of the carbonyl group intensity in PIII-treated polyethylene gives an asymptotical curve with increasing ion fluence. The carbonyl group concentration increases at low fluence (up to 1015 ions/cm2) and then it saturates. Further fluence increases do not lead to a rise in the oxidation product concentration. The same asymptotical behavior of the concentration with fluence is observed for vinyl groups. However, the vinylen group concentration continues to increase with fluence, and the intensity of the vinylen groups is higher than the intensity of the vinyl and vinyliden groups. The high intensity of the vinylen groups is interpreted as being due to the fact that they are the main product in the destruction process of polyethylene macromolecules in radical reactions. Due to the high level of carbonization of the polyethylene in the surface layer, the vinylen groups cannot survive in the thin layer with a high concentration of structural defects. However, the vinylen groups can survive and be collected in deeper layers than the ion penetration depth. The free radical reactions of unpaired valence electrons travel along the macromolecules and can lead to vinylen groups in layers much deeper than the ion penetration depth.
Similar spectral changes are observed in the FTIR ATR spectra of other olefin polymers after ion implantation treatment. For example, the FTIR ATR spectra of EPDM rubber after PIII with nitrogen ions are presented in Figure 4.25. The strong lines at 1462 and 1375 cm−1 are oversaturated. The weak lines at 1630, 1597, 1503, 1153, and 945 cm−1 are related to vibrations in the dicyclopentadiene fraction of the EPDM macromolecule. In spite of this, a very weak broadband in the 1650–1750 cm−1 region can be observed. It is related to a surface oxidized layer that forms under environmental conditions.
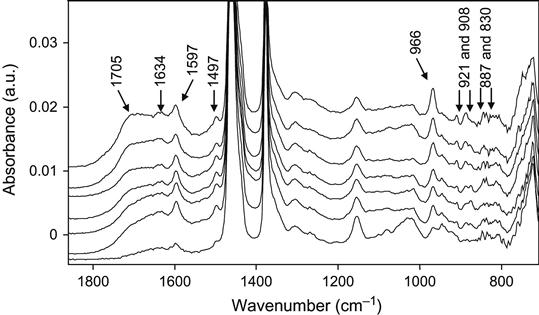
After ion beam treatment, the new broadband at 1600–1750 cm−1 appears as the result of surface layer oxidation; the narrow lines at 1597 and 1497 cm−1 show the presence of unsaturated rings that are synthesized under the ion beam irradiation; the line at 966 cm−1 of the vinylen groups, the lines at 921 and 908 cm−1 of the vinyl groups, and the lines at 890 and 830 cm−1 of vinyliden groups show the presence of new unsaturated C![]() C groups in the irradiated rubber as the result of the ion treatment.
C groups in the irradiated rubber as the result of the ion treatment.
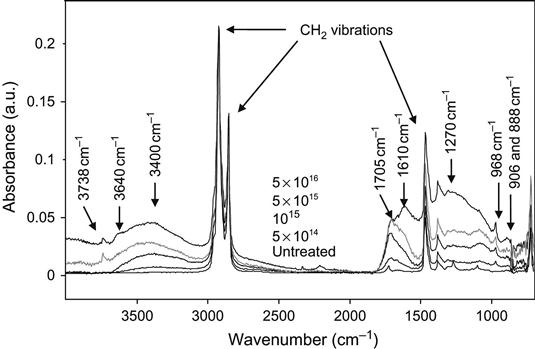
The FTIR ATR spectra of an ethylene and octane-1 co-polymer are presented in Figure 4.26. The spectrum of the untreated polymer shows strong lines associated with aliphatic hydrocarbon vibrations of CH, CH2, and CH3 groups at 2920, 2850, 1464, 1377, and 720 cm−1. The weak narrow line at 1725 cm−1 corresponds to a vibration of the carbonyl group in the surface layer, created by oxidization of the implanted layer under environmental conditions. After ion treatment, a broad line appears in the 1600–1750 cm−1 region corresponding to vibrations of C![]() O and C
O and C![]() C groups. New lines at 968, 906 and 888 cm−1, corresponding to CH out-of-plane vibrations in unsaturated C
C groups. New lines at 968, 906 and 888 cm−1, corresponding to CH out-of-plane vibrations in unsaturated C![]() C groups, also appear. The very broad lines in the 3200–3700 cm−1 region correspond to hydroxyl group vibrations. Separate maxima of this line at 3400 and 3500 cm−1 correspond to vibrations of the hydroxyl groups, which are connected by hydrogen bonds. The narrow peak at 3738 cm−1 is caused by vibrations of the free hydroxyl group. With increasing fluence, the intensity of the oxygen-containing group lines increases. At high ion fluence, a very broadband with a maximum at 1250 cm−1 is observed, which corresponds to carbon
C groups, also appear. The very broad lines in the 3200–3700 cm−1 region correspond to hydroxyl group vibrations. Separate maxima of this line at 3400 and 3500 cm−1 correspond to vibrations of the hydroxyl groups, which are connected by hydrogen bonds. The narrow peak at 3738 cm−1 is caused by vibrations of the free hydroxyl group. With increasing fluence, the intensity of the oxygen-containing group lines increases. At high ion fluence, a very broadband with a maximum at 1250 cm−1 is observed, which corresponds to carbon![]() carbon vibrational states in the carbonized surface layer of polymer. Such a band is observed in polyethylene and other polymers after high-fluence ion implantation (higher than 5×10¹⁶ ions/cm2).
carbon vibrational states in the carbonized surface layer of polymer. Such a band is observed in polyethylene and other polymers after high-fluence ion implantation (higher than 5×10¹⁶ ions/cm2).
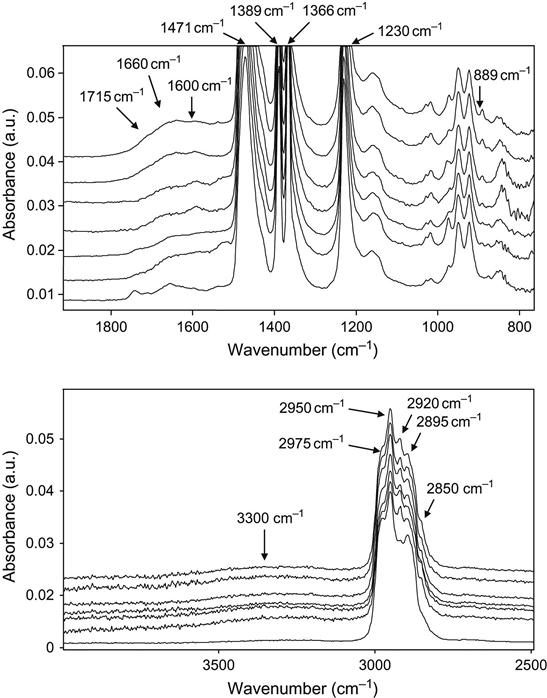
The FTIR ATR spectra of butyl rubber after ion beam treatment show fewer intense changes than polyethylene and its co-polymers (Figure 4.27). The spectrum of untreated butyl rubber has its main vibrational peaks at 1230, 1366, 1389, 1471, 2895, 2950, and 2975 cm−1. After modification by ion implantation, the spectra show a weak broadband at 1600–1730 cm−1 corresponding to C![]() O and C
O and C![]() C groups, and a 3300 cm−1 broadband corresponding to OH group vibrations. However, the spectra of treated rubber also shows lines at 2920 and 2850 cm−1, which are attributed to vibrations of the CH2 group. Here we have to remind ourselves that butyl rubber is depolymerizes under various kinds of irradiation. The depolymerization of butyl rubber occurs under UV, electron, and gamma-irradiations. The depolymerization reaction of butyl rubber was considered in Chapter 3. However, depolymerization is not the only reaction that occurs in butyl rubber under the influence of ion implantation. Due to the high-density defects and the high temperature in the ion track, a range of reactions of radicals result in the formation of new groups of hydrocarbons, which are synthesized by the rearrangement of separated groups and atoms and the formation of simple aliphatic structures containing
C groups, and a 3300 cm−1 broadband corresponding to OH group vibrations. However, the spectra of treated rubber also shows lines at 2920 and 2850 cm−1, which are attributed to vibrations of the CH2 group. Here we have to remind ourselves that butyl rubber is depolymerizes under various kinds of irradiation. The depolymerization of butyl rubber occurs under UV, electron, and gamma-irradiations. The depolymerization reaction of butyl rubber was considered in Chapter 3. However, depolymerization is not the only reaction that occurs in butyl rubber under the influence of ion implantation. Due to the high-density defects and the high temperature in the ion track, a range of reactions of radicals result in the formation of new groups of hydrocarbons, which are synthesized by the rearrangement of separated groups and atoms and the formation of simple aliphatic structures containing ![]() CH< and
CH< and ![]() CH2
CH2![]() groups. As a result, strong lines of CH2 vibrations also appear in the spectra. With increasing treatment fluence, the intensity of the lines that represent such groups increases. The presence of out-of-plane CH vibrations in the 967 and 910 cm−1 regions is shown by two intense lines at 923 and 950 cm−1. A weak peak at 889 cm−1, corresponding to vinyliden groups, is observed in the spectra of samples treated with high fluence.
groups. As a result, strong lines of CH2 vibrations also appear in the spectra. With increasing treatment fluence, the intensity of the lines that represent such groups increases. The presence of out-of-plane CH vibrations in the 967 and 910 cm−1 regions is shown by two intense lines at 923 and 950 cm−1. A weak peak at 889 cm−1, corresponding to vinyliden groups, is observed in the spectra of samples treated with high fluence.
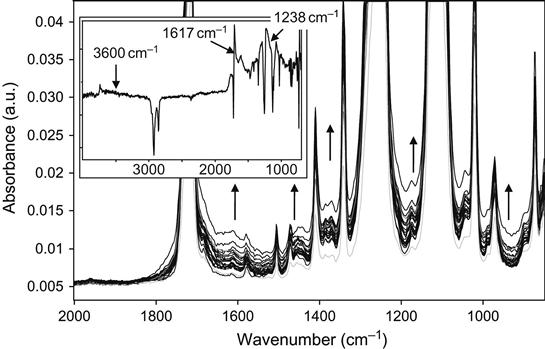
The spectra that reflect the ion implantation-induced structural changes of polymers with heteroatoms in the backbone are more difficult to analyze. For example, the FTIR ATR spectrum of PET contains a number of high-intensity lines at 1717, 1342, 1260, 1124, 1104, and 1021 cm−1 that are attributed to vibration modes of the highly polar groups: C![]() O and C
O and C![]() O (Figure 4.28). The lines of aromatic ring vibrations at 1581 and 1507 cm−1 and the lines of the aliphatic group vibrations at 2925, 2854, and 1472 cm−1 have very low intensity. After ion treatment, the spectra change slightly: the absorbance in the 1600–1700 and 1400−1000 cm−1 spectral regions increases with increasing fluence. Such weak spectral changes are best observed in the difference spectra of PET, where the spectrum of the unmodified polymer is subtracted from the spectrum acquired after ion treatment. The difference spectrum shows clearly a new broad peak with a center at 1617 cm−1, corresponding to the new carbonyl and C
O (Figure 4.28). The lines of aromatic ring vibrations at 1581 and 1507 cm−1 and the lines of the aliphatic group vibrations at 2925, 2854, and 1472 cm−1 have very low intensity. After ion treatment, the spectra change slightly: the absorbance in the 1600–1700 and 1400−1000 cm−1 spectral regions increases with increasing fluence. Such weak spectral changes are best observed in the difference spectra of PET, where the spectrum of the unmodified polymer is subtracted from the spectrum acquired after ion treatment. The difference spectrum shows clearly a new broad peak with a center at 1617 cm−1, corresponding to the new carbonyl and C![]() C groups in the modified surface layer of the PET. Also, at high-treatment fluence, a strong broad peak with a center at 1238 cm−1 attributed to the carbon structure is observed. In the region of OH vibrations, a weak broad peak with a center at 3600 cm−1 related to hydrogen-bonded hydroxyl groups and a narrow peak at 3745 cm−1 related to free hydroxyl groups are observed. These spectral changes as well as the decrease of the 1250 and 1125 cm−1 line intensities shows that carbonization of the PET surface layer with ion implantation is combined with degradation of the ester group and the formation of hydroxyl groups.
C groups in the modified surface layer of the PET. Also, at high-treatment fluence, a strong broad peak with a center at 1238 cm−1 attributed to the carbon structure is observed. In the region of OH vibrations, a weak broad peak with a center at 3600 cm−1 related to hydrogen-bonded hydroxyl groups and a narrow peak at 3745 cm−1 related to free hydroxyl groups are observed. These spectral changes as well as the decrease of the 1250 and 1125 cm−1 line intensities shows that carbonization of the PET surface layer with ion implantation is combined with degradation of the ester group and the formation of hydroxyl groups.
PET is one example of a polymer that degrades under irradiation. Together with spectral changes induced by oxidation and carbonization effects, the polymer’s chemical decomposition under ion irradiation is also observed in polymers with heteroatoms in the backbone. In the case of polyethers, amides, imides, and other polymers with similarly more complex structures than polyethylene, the effects of hydrolysis, regrouping, and substitution reactions are also evident.
Another example of degradation reactions under ion implantation treatment is that of ion-modified polyurethane. There are different kinds of polyurethane with various structures of their macromolecules. One type of polyurethane, with microphase segregation of its structure, is called segmented polyurethane. FTIR ATR spectra of a polyurethane based on polyoxypropylene glycol, polyoxyethylene glycol, and toluene diisocyanate are presented in Figure 4.29.
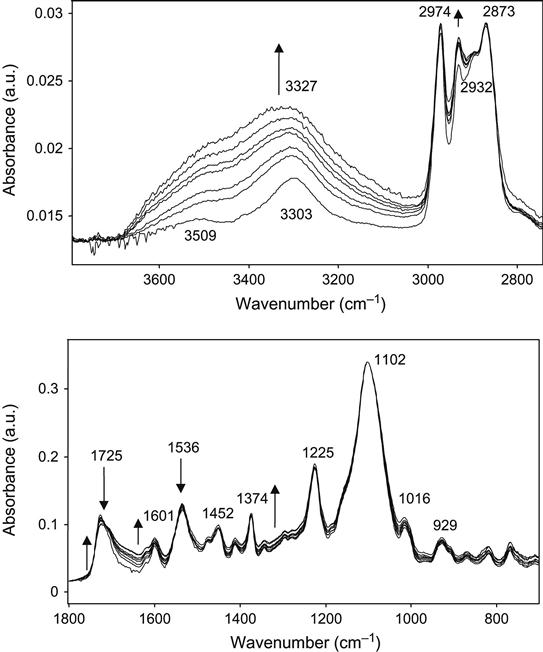
The spectra contain strong lines at 1102, 1225, 1536, 1725, 2873, 2974, and 3327 cm−1. These lines correspond to vibrational modes of the most polar groups in the polyurethane macromolecules. These are urethane (![]() NH
NH![]() CO
CO![]() O
O![]() ) and ether (
) and ether (![]() C
C![]() O
O![]() ) group vibrations. The urethane group has well-identified characteristic lines: Amide A (3327 cm−1), Amide 1 (near 1725 cm−1), and Amide 2 (1536 cm−1), which can be used for the structural analysis of changes in the urethane group. This polyurethane has two parts of the macromolecule, which are not compatible with each other: polyether and urethane fragments. The presence of two incompatible fragments causes a microphase separation in the polyurethane. The first phase is formed by the polyether fragments of the macromolecules. This phase is amorphous and has a high flexibility. The second phase is formed by urethane groups connected with each other by hydrogen bonds:
) group vibrations. The urethane group has well-identified characteristic lines: Amide A (3327 cm−1), Amide 1 (near 1725 cm−1), and Amide 2 (1536 cm−1), which can be used for the structural analysis of changes in the urethane group. This polyurethane has two parts of the macromolecule, which are not compatible with each other: polyether and urethane fragments. The presence of two incompatible fragments causes a microphase separation in the polyurethane. The first phase is formed by the polyether fragments of the macromolecules. This phase is amorphous and has a high flexibility. The second phase is formed by urethane groups connected with each other by hydrogen bonds:
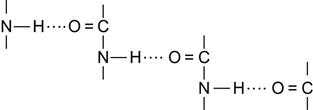 (4.1)
(4.1)
Such a phase has semicrystalline hard structures called domains. The presence of hard domains in polyurethane is very important. It provides good mechanical properties in combination with high elasticity. The presence of the domains in polyurethane can be analyzed by studying the form of the Amide 1 peak in the FTIR spectra. In this case, the peak has a maximum at 1725 cm−1 and a low-frequency shoulder up to 1650 cm−1.
After ion beam treatment, the spectra show some changes similar to those observed for olefin molecules. In particular, an additional absorbance appears in the 1600–1700 cm−1 region as an increase in broadband intensity. This band is caused by carbonization and the oxidation of the carbon structure. The intensity this line is significantly weaker than is observed in the spectra of olefin polymers after ion treatment. A small decrease in Amide 1 and Amide 2 line intensities is observed with increasing ion fluence. A strong increase of absorbance in the 3600−3300 cm−1 region is observed associated with the appearance of a number of hydroxyl group vibrations.
These spectral changes are associated with the complex hydrolysis process of polyurethane macromolecules. These chemical transformations are caused by energy transfers and excitation of separate groups of macromolecules which take part in decomposition reactions of irradiated polymer in regions deeper than the ion penetration depth. Radicals created by the ion implantation diffuse to these deeper regions and cause chemical processes similar to UV irradiations and γ-irradiations. As a result of this, a much deeper layer of polymer can be activated by the implanting ions, especially in polymers that are not stable under irradiation.
A highly degradable polymer under ion irradiation is PTFE. This polymer has very low carbonization after ion treatment. The FTIR ATR spectra show small changes that are slightly higher than the level of the noise (Figure 4.30). The broadband with two maxima at 1714 and 1651 cm−1, corresponding to oxidized carbon structures, and the hydroxyl group line at 3400 cm−1 (only appearing at high fluence) are observed after ion treatment. The intensity of these lines increases with ion fluence.
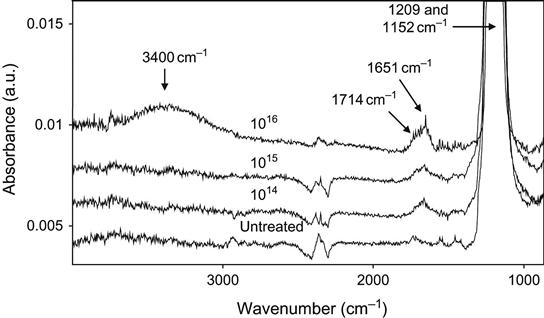
The PTFE surface becomes very attractive to any pollution from the surrounding atmosphere; thus, sometimes the FTIR ATR spectra of ion-modified PTFE show a high concentration of hydrocarbons of various structure (and FTIR spectra). However, careful treatment of PTFE before and after ion implantation treatment can prevent the accumulation of any hydrocarbons on the surface of the PTFE after ion implantation.
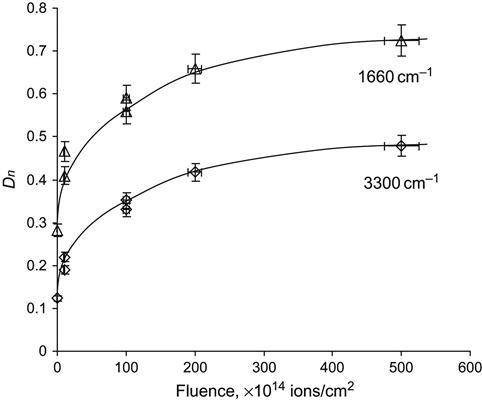
The structure transformations accumulate with an increase of ion fluence. The effects of structural changes can be calculated quantitatively from FTIR spectra. Figure 4.31 shows the values for the relative concentrations of carbonyl groups, unsaturated carbon groups and hydroxyl groups determined by FTIR ATR spectroscopy of polyurethane with increasing ion fluence. The lines at 1660 and 3300 cm−1 are used for calculations according to Eqs. (4.10) and (4.11). The concentration of carbonyl and unsaturated carbon groups increases at low fluence and saturates at high fluence (more than 1016 ions/cm2). A similar dependence is observed for the concentration of hydroxyl groups. Hydrolysis can proceed in a region of the polymer where the macromolecules are not yet carbonized, but nevertheless activated by radiation effects of the ion penetration. In these regions, the macromolecules accept diffused oxygen from the atmosphere to form oxygen-containing groups and to take part in the hydrolysis process with depolymerization of macromolecules and formation of glycols.
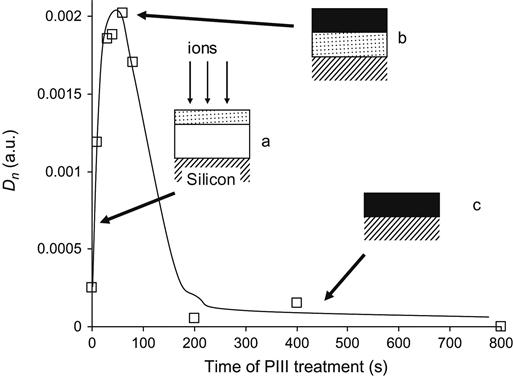
When the polymer layer becomes highly carbonized, oxidation is reduced, because of the low activity of amorphous carbon to react with molecular oxygen under normal conditions. The inactivity of the carbonized polymer to oxidation can be demonstrated for a thin layer of polystyrene spin-coated onto a silicon wafer (Figure 4.32). When a polystyrene film is treated with low ion fluence, the modified layer is thin and the oxidation effect increases with fluence (picture a). When the whole polystyrene film is completely modified and the carbonization of the film becomes significant, the subsequent ions cannot produce any more active polystyrene macromolecules (picture b). When the polystyrene film becomes carbonized, the reactivity of the film with oxygen decreases, despite the sufficiently thick residual carbonized film on the silicon wafer (picture c).
In comparison with plasma treatment without bias, ion implantation treatment has a longer period of oxidation kinetics under normal atmospheric conditions. This is caused by stabilization of the surface layer of the polymer in the case of ion beam treatment by the formation of cross-linked and highly carbonized structures. The penetration depth of the ions and corresponding thickness of the modified layer plays a significant role in this stabilization. The thick modified layer prevents reorientation of the modified fractions of macromolecules into the bulk of the polymer. The thickness depends on polymer structure and the type of polymer macromolecules. The effects of globular structure (thickness must be more than one globule in diameter), etching rate (to enable the creation of enough carbon fraction), and fillers (absorbers of ion energy) are important for predicting the kinetics of structural transformations in the polymer surface layer after ion beam treatment. The post-history kinetics of ion beam-irradiated polymers has not yet been investigated in detail. However, some experimental data can be found and used to predict the structure and property evolution during ageing of the modified polymer surface.
The active species in the environment influence the relaxation processes after ion implantation treatment. The FTIR ATR spectra of polyethylene (ultrahigh molecular weight polyethylene, UHMWPE) as a function of time after PIII treatment are presented in Figure 4.33 for high fluence (4×10¹⁶ ions/cm2) and in Figure 4.34 for low fluence (5×10¹⁴ ions/cm2). In both spectra, the lines of the oxygen-containing groups in the 1600–1750 cm−1 and 3000–3600 cm−1 regions appear “immediately” after treatment (about 3 min after switching off the pulses, removing the sample from the vacuum chamber, and placing it on the ATR crystal). It was not possible to record FTIR ATR spectra any sooner after stopping the ion treatment, however, the FTIR ATR spectra of polyethylene samples that did not make contact with atmosphere after the ion treatment did not contain any carbonyl or hydroxyl group lines. The spectra of those samples not exposed to atmosphere that were treated with high fluence, contained a broadband between 1000 cm−1 and 1700 cm−1, indicating that carbon structures were formed in the surface layer.
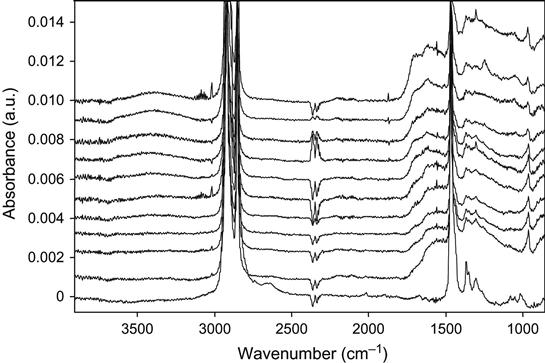
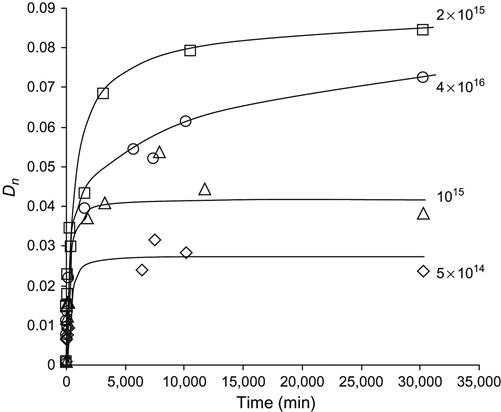
The lines of unsaturated carbon![]() carbon groups (vinyl, vinylene, and vinyliden) in the spectra of polyethylene after PIII with high and low fluence do not change with storage time. In contrast, the 1712 cm−1 line of carbonyl groups and the 3500 cm−1 line of hydroxyl groups both become more intense with storage time after the ion treatment. The dependence of the carbonyl line intensity on ageing time after PIII is presented in Figure 4.35. The saturated concentration of carbonyl groups is achieved more quickly for low ion fluence, whereas for high fluence, saturation was not achieved over the duration of the experiment. The initial concentration of the carbonyl group determined immediately after PIII treatment does not depend on the ion treatment fluence. The difference between the carbonyl line intensities for low- and high-fluence samples appears after some storage time. Therefore, we conclude that the concentration of the oxygen-containing groups grows continually for high-fluence implanted samples, whereas the oxidation process in low-fluence implanted samples stops during the experiment. The saturated concentration is increases with increasing ion fluence. As reported in Chapter 3, radical reactions with atmospheric oxygen are responsible for the oxidation kinetics of ion-implanted polymers. The difference in carbonyl group accumulation for different fluences is indicative of different reaction kinetics of radicals with oxygen.
carbon groups (vinyl, vinylene, and vinyliden) in the spectra of polyethylene after PIII with high and low fluence do not change with storage time. In contrast, the 1712 cm−1 line of carbonyl groups and the 3500 cm−1 line of hydroxyl groups both become more intense with storage time after the ion treatment. The dependence of the carbonyl line intensity on ageing time after PIII is presented in Figure 4.35. The saturated concentration of carbonyl groups is achieved more quickly for low ion fluence, whereas for high fluence, saturation was not achieved over the duration of the experiment. The initial concentration of the carbonyl group determined immediately after PIII treatment does not depend on the ion treatment fluence. The difference between the carbonyl line intensities for low- and high-fluence samples appears after some storage time. Therefore, we conclude that the concentration of the oxygen-containing groups grows continually for high-fluence implanted samples, whereas the oxidation process in low-fluence implanted samples stops during the experiment. The saturated concentration is increases with increasing ion fluence. As reported in Chapter 3, radical reactions with atmospheric oxygen are responsible for the oxidation kinetics of ion-implanted polymers. The difference in carbonyl group accumulation for different fluences is indicative of different reaction kinetics of radicals with oxygen.
 O)=1712 cm−1 line in the ATR FTIR spectra of polyethylene (UHMWPE) as a function of storage time after 20 keV nitrogen ion PIII. The fluence in ions/cm2 is indicated beside each curve on the graph.
Changes in surface energy
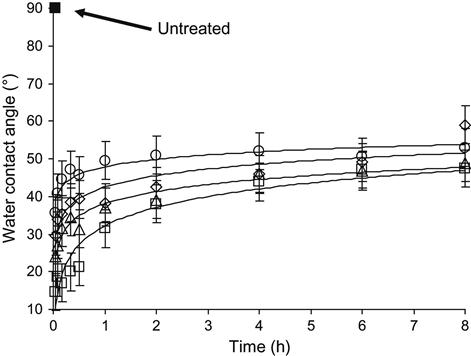
A similar time-dependent effect is observed for changes in the surface energy of the polymer. The wettability of the polymer surface changes strongly after ion treatment. For example, the water contact angle of polyethylene changes from 90° for the untreated to 15–20° for the ion-treated polymer. These changes are observed at low and high fluence. For polyethylene, it starts to be observed from fluences as low as 1012 to 1013 ions/cm2. The wettability is an easily measureable characteristic of the surface energy of the polymer, which depends on the structure and composition of the very top surface layer. The increase in wettability after ion treatment shows that the surface layer becomes hydrophilic and more polar chemical groups appear in this layer. Immediately after treatment, the wettability is extremely high. With storage time after ion treatment, the wettability of the polyethylene sample, as it is observed by the wetting angle of a water drop, decreases (Figure 4.36). The kinetics of wettability depends on the applied fluence. For low fluence, the wetting angle reverses more quickly than for the high-fluence treated samples. The wetting angle of ion-modified polymers after stabilization depends on the treatment fluence, and varies by 50–70°.
Ageing of the modified polymer surface causes the changes in wettability with time after ion treatment. The kinetics of wettability is associated with the decay of radicals, and changes in surface structure due to environmental influences, such as oxidation. The oxidation process has a complex character; it depends on the type of polymer, structure of the surface layer, temperature, and environmental contamination. It is associated with the complexities of radical transformations and oxygen-containing group formation during exposure to air. The carbon structure of the polymer surface layer also has an influence on wettability. Therefore, the wettability of the polymer surface after ion treatment is a result of radicals, oxygen-containing groups, and carbonization of the polymer surface layer. Variations in the radical and oxygen-containing group concentrations results in the changes in wettability during ageing of the modified polymer surface. Detailed consideration of the wettability of polymers after ion treatment is presented in Chapter 5.
X-ray photoemission spectroscopy analysis of structural changes
Structural changes in the ion-implanted surface layer may also be observed using XPS. In XPS, the polymer sample is irradiated by x-ray photons and electrons that are ejected from the core shell levels of the atoms present escape from the samples and are analyzed. The kinetic energy of the electrons equals the energy of the incident photons minus the binding energy of the electrons in the core bonding orbitals of the atoms. Therefore, the electron energy spectrum provided by XPS gives the values of the electron energy levels in the atoms present in the surface layer of the sample. Due to the small escape depth of the electrons, XPS provides information about the chemistry of only the top 5–10 nm nanometers of the sample. The electron energy levels are unique for each element and include small energy shifts that are due to bonds with neighboring atoms. For example, in the spectrum of unmodified polyethylene, a single C1s peak related to carbon bonded with two carbon atoms and two hydrogen atoms is observed at 285.0 eV. In the spectrum of ion-implanted polyethylene, the main peak at 285.0 eV has satellites at 286.5, 288.0, and 289.4 eV, which are attributed to the carbon atoms in oxygen-containing groups (Figure 4.37). The line at 286.5 eV is related to carbon in the C![]() O group, the line at 288.0 eV is related to carbon in the carbonyl C
O group, the line at 288.0 eV is related to carbon in the carbonyl C![]() O group, and the line at 289.4 eV is related to carbon in the O
O group, and the line at 289.4 eV is related to carbon in the O![]() C
C![]() O group. The ratio of intensities of these lines corresponds to the ratio of their concentrations.
O group. The ratio of intensities of these lines corresponds to the ratio of their concentrations.
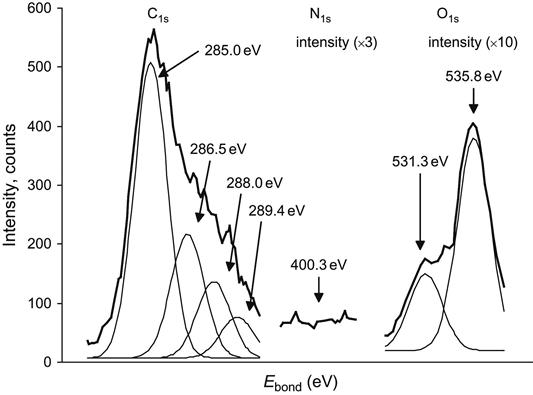
The O1s peak also appears in the XPS spectrum of ion beam-implanted polyethylene as a result of reactions with oxygen in air. The peak is fitted with two individual peaks at 531.3 and 535.8 eV, which are attributed to the oxygen atoms bonded in C![]() O and C
O and C![]() O groups, respectively.
O groups, respectively.
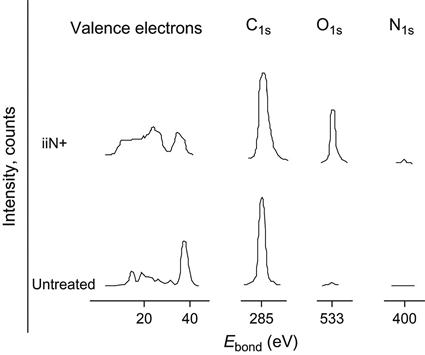
Despite the fact that the ion beam treatment in this case was done by nitrogen ions, the N1s peak at 400.3 eV is not present. The fluence of the treatment (1016 ions/cm2) is not high enough for the signal from the implanted nitrogen to be visible in this polyethylene spectrum. The spectrum was collected on a spectrometer using magnetic separation in the electron analyzer.
Using another XPS spectrometer, it was possible to obtain spectra of polyisoprene rubber with a higher signal/noise level and, in this case, an N1s peak was clearly observed in the spectrum of the ion beam-implanted polymer (Figure 4.38). The intensity of the nitrogen peak is much smaller than the intensity of the O1s peak. Implantation by nitrogen to a fluence of 1016 ions/cm2 does not give a significant amount of nitrogen in comparison with the oxygen incorporated by the oxidation processes that occur in the polymer after exposure to air. This supports a model in which the implanting ions play the role of projectiles penetrating the polymer network and breaking bonds in the vicinity of their paths through collisional energy transfer. A more significant influence of the implanting atoms on the treated layer chemistry begins at higher fluences, when the structure of the polymer can be completely converted into inorganic structures.
Some polymers are very sensitive to x-ray irradiation during recording of spectra. It was not possible to measure at low enough x-ray beam intensity for a PTFE sample because of the low sensitivity of our detector at the time of the experiment. Modern spectrometers have higher sensitivity and the polymer degradation due to x-ray irradiation can be sufficiently minimized. The spectrum of untreated PTFE shows a symmetrical F1s peak at 690.2 eV, a C1s peak at 292.0 eV, and a number of low-energy peaks of valence electrons with definite maxima at 37.0, 30.0, 15.0, and 6.0 eV (Figure 4.39). Due to degradation under the x-ray beam, the C1s peak is observed at 285.9 eV and it grows with duration of x-ray irradiation.
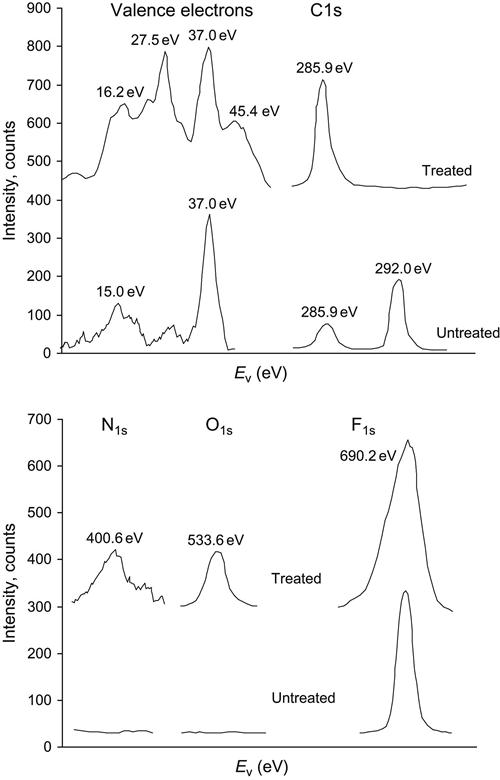
After ion beam treatment, the XPS spectrum of PTFE shows an F1s peak at 690.2 eV, a O1s peak at 533.6 eV, a N1s peak at 400.6 eV, and a C1s peak at 285.9 eV. The peaks of F1s and C1s have complex shapes corresponding to the overlapping of some narrow peaks. These individual peaks support the presence of oxygen-containing and nitrogen-containing groups in the surface layer of PTFE after ion beam treatment. The spectrum in the region of the valence electrons is greatly altered. Interpretation of the valence electron spectrum is more complicated and it is not usually used for structural analysis of the polymer after ion treatment. However, this region of the spectra contains information on the valence electron structure and the chemical structure of the ion-modified layer of the polymer.
A quantitative analysis of elemental contamination can be done by XPS without a detailed chemical group analysis. The intensity of the XPS peak, adjusted according to a sensitivity factor, is proportional to the concentration of elements present in the surface layer. The variations in the intensity of the peaks show the dynamics of elemental concentrations with ion fluence. For example, Figure 4.40 shows the dependence of element contamination determined by integral intensity of the C1s, F1s, O1s, and N1s XPS peaks on fluence of 20 keV nitrogen ions. The thin surface layer analyzed by XPS (about 1 nm in thickness) is defluorinated under low fluence (1013 ions/cm2). At the same time, a small amount of nitrogen and oxygen atoms are bonded to the activated PTFE surface. Subsequent treatment does not increase the defluorination effect. At high fluence, the fluorine concentration increases slightly, perhaps due to etching.
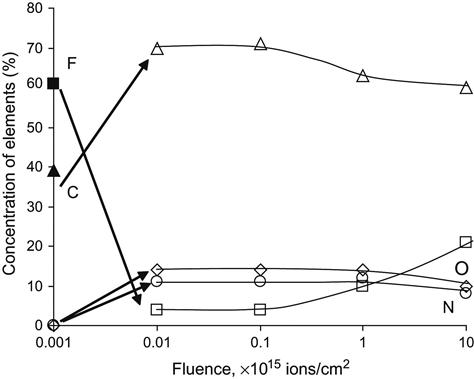
Etching of the polymer layer in a low-energy argon beam with intermittent XPS recording is a popular method for obtaining a profile of elemental contamination. Comparison of profiles measured in this way with the defect profiles (as calculated by SRIM, for example) shows good agreement for different kinds of polymers and penetrating ions [7]. However, it should be noted that etching by argon ions also induces some structural transformations in the polymer layer, and the XPS profile can be modified in the etching process. The etching ion beam parameters must be selected carefully.
X-ray diffraction for crystalline fractions
Some polymers have a crystalline structure. For example, polyethylene has an orthorhombic structure. The fraction of crystalline phase in polyethylene depends on the regularity of the macromolecules. For LDPE, the crystalline fraction is about 40%. X-ray diffraction data shows clear diffraction patterns of untreated LDPE. A decrease in the crystalline phase of the polymer is observed with ion implantation treatment fluence. The x-ray diffraction peaks of the polyethylene crystalline phase become broader and weaker after ion treatment (Figure 4.41). The decreasing intensity of the crystalline peaks corresponds to the disappearance of the crystalline phase, which can also be observed by FTIR spectroscopy of polyethylene. The 720/730 cm−1 doublet, characterizing the ratio of crystalline/amorphous phases, does not change with ion fluence, but the absolute intensity of the doublet lines decreases with fluence due to the degradation of the polyethylene macromolecular structure. The disappearance of the crystalline phase of the polymer under ion implantation occurs due to the disappearance of the polymer structure and its transformation into the amorphous carbon phase. Polarization FTIR measurements of a stretched polyethylene film show that the macromolecular orientation of the film does not change after ion implantation treatment. Here we do not consider the thermal regime of implantation, where the polymer film or surface layer is heated up to melting point temperature or glass transition temperature (Tg). Amorphization of the surface layer and disorientation of the film has been observed in the thermal regime.
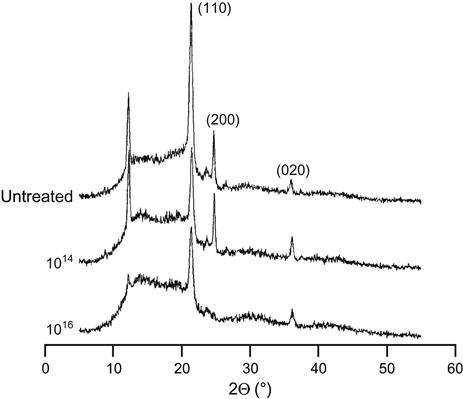
Analysis of cross-linking by gel-fraction measurements
An important aspect of polymer structure is the topology of the macromolecules. If a polymer has linear macromolecules, it can be dissolved in an appropriate solvent. When the polymer is treated by ion implantation with sufficiently high fluence, the ion-implanted surface layer becomes cross-linked and insoluble. The macromolecules become chemically bonded to each other, and these bonds cannot be broken by intermolecular interactions with the solvent. The treated polymer surface layer becomes one huge macromolecule. The formation of cross-links is by the reactions of radicals in which the radicals of neighboring macromolecules react with each other and form chemical bonds (bridges) between the macromolecules. The extent of such cross-linking can be determined by gel-fraction measurements. A solvent, in which the linear untreated polymer completely dissolves, must be used. The solvent must be chemically inert with respect to the polymer so that it does not induce further cross-linking. After ion implantation treatment, a fraction of polymer becomes insoluble in the solvent and the insoluble part of the polymer contains the cross-linked macromolecules. If the polymer dissolves only in a heated solvent, it can be dissolved by boiling solvent in a Soxhlet extractor. After separation from solution, the residual insoluble part of the polymer is dried and weighed. The gel-fraction content is determined as:
(Eq. 4.15)
where m1 is the weight of the insoluble part of the polymer and m0 is the initial weight of the polymer prior to dissolution. The gel-fraction formation under various types of irradiation can be described by the theory of Charlesby–Pinner:
(Eq. 4.16)
where s is the sol-fraction of the polymer, p0 is the fracture density per unit dose in kGy, q0 is the density of cross-linked units per unit dose in kGy, u1 is a number indicative of the average degree of polymerization, and R is the radiation dose in kGy.
The cross-linking formation depends on the type of polymer and it can be expressed as the gel-formation parameter: the chemical yield G(x) is the number of cross-links per 100 eV deposited energy by the ions. G(x) is calculated from the assumption that the cross-linking process occurs proportionally to the linear energy transfer (dE/dx) along the tracks of the ions. In this case, the chemical yield is calculated as:
(Eq. 4.17)
where Mw,0 is the average molecular weight of nonirradiated polymer macromolecules, Dge1 is dose per unit weight gel formation in eV/g, and Na is Avogadro’s number. A similar parameter G(s) could be introduced for the analysis of scissions in polymer under irradiation. G(x) and G(s) characterize the cross-linking and scission tendencies of the polymer macromolecules under ion irradiation. For example, the G(x)/G(s) ratio for polyethylene is 1.2/0 and for PTFE is 0/(4–20), which is indicative of the high level of cross-linking occurring in polyethylene and the high level of scission that occurs in Teflon under ion irradiation.
These measurements assume that the cross-linking process occurs uniformly in the polymer film or coating. If ions penetrate the film with negligible energy loss and the profile of the defect distribution across the film’s thickness is close to constant, the gel-fraction measurement gives a real value. These conditions are met for ions of very high energy and very thin polymer films. However, in most cases of industrially relevant processes, the ion energies are not high enough and polymer films are not thin enough for the complete penetration of ions through the film. Therefore, the gel-fraction estimation is not correct because the cross-linking profile caused by structural defects is not constant across the thickness of the polymer film.
For typical ion energies and thickness of polymer films used, the structure defect profile drops at a particularly depth from the surface characterized by stopping of the ions. In this case, the gel-fraction can be recalculated to give the thickness of the cross-linked film:
(Eq. 4.18)
where h0 is the thickness of the polymer film before dissolving. For this calculation, the density of the cross-linked part of the film is assumed to be equal to the density of the unmodified film and the cross-linked layer edge has a step profile with depth. Of course, in reality, the cross-linked layer is usually denser than the unmodified material, so its actual thickness is correspondingly lower than estimated by Eq. (4.18).
The dependence of the cross-linked fraction of a polyethylene film treated with 20 keV nitrogen ions is presented in Figure 4.42. At low fluence, the insoluble amount of polyethylene increases up to a maximum value. The maximal thickness of the cross-linked layer is 1.75 µm, which is observed at a fluence of 3.1014 ions/cm2. It is more than 20 times the ion penetration depth (75 nm). At a higher fluence, the cross-linked layer of polyethylene decreases to 0.8 µm, which is ten times thicker than the ion penetration depth.
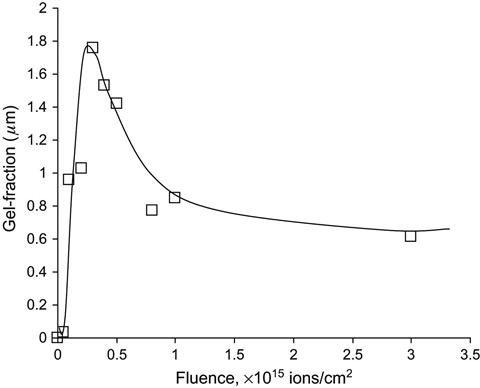
The color of the residual insoluble fraction of polyethylene varies and depends on the ion fluence. At low fluence (1013 ions/cm2), the color is white, similar to untreated polyethylene. At higher fluence, the color transforms in the following order: milky white, creamy orange (5×10¹⁴ ions/cm2), creamy brown (1015 ions/cm2), red-green depending on angle of view (3×10¹⁵ ions/cm2), and green-black (1016 ions/cm2). The color changes correspond to changes in the absorbance in the UV-visual spectral range of the polyethylene, which occur due to the increasing conjugation number of unsaturated and aromatic structures in the modified surface layer with increasing fluence.
A similar dependence of the cross-linked layer thickness in polyethylene is observed for treatment with ions of oxygen (maximum is at 0.855 µm), carbon (maximum is at 0.84 µm), and argon (maximum is at 2.09 µm). A similar dependence of the gel-fraction is also observed for polyisoprene and polystyrene films after ion implantation treatment.
The formation of a thick cross-linked layer is explained by the propagation of radicals due to chain reactions in the deep unmodified layer, diffusion of destruction products, and penetration of secondary irradiations released in collisions of target atoms and implanting ions, including high-energy phonons, electrons, and photons released into the bulk layer deeper than the ion penetration depth. Such secondary effects of the ion treatment easily remove hydrogen atoms in virgin macromolecules in the polymer bulk and generate cross-links in this deep region by radical reactions.
The appearance of a thick cross-linked layer in the implanted polymer changes significantly the properties of the polymer thin films and coatings. The polymer coating becomes insoluble, even if the implanting ions do not penetrate through the entire thickness of the polymer. For example, optical microphotos of a polystyrene coating on a silicon wafer as well as scanning electron microscope (SEM) images are presented in Figures 4.43 and 4.44. The polystyrene coating of 100 nm thickness was implanted with 20 keV argon ions. In this case, the ions penetrate into a 60 nm layer at the surface. Therefore, the carbonized layer can be no more than 60 nm in thickness. Before treatment, the polystyrene film can be washed off in a toluene flow in a few seconds. After ion treatment, the polystyrene film becomes insoluble, even with low fluence (2.5×10¹⁴ ions/cm2). There are some regions of the polystyrene film that swell differently in toluene. As the toluene evaporates, the film shrinks and forms wrinkles. With an increase in fluence, the size of the wrinkled area reduces and completely disappears at high fluence (1016 ions/cm2). At the highest fluence, the film is cross-linked sufficiently densely that the film cannot swell in the toluene at all.
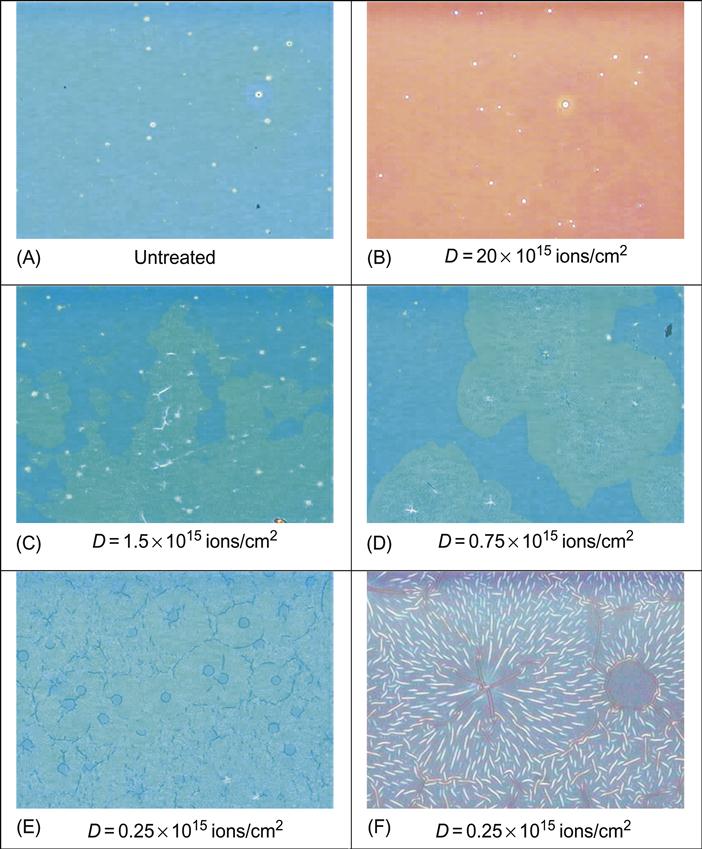
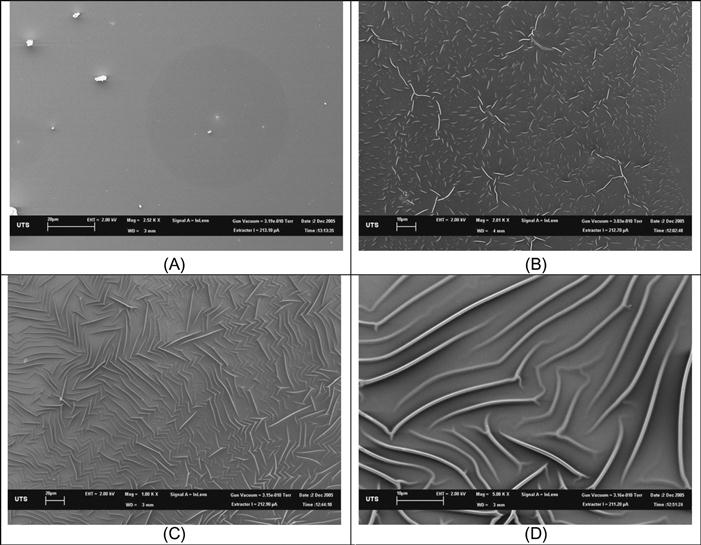
Due to cross-linking and carbonization of the treated polymer, the stresses appear in the surface layer. The stresses are strong enough to cause deformation of a thick surface layer of µm and tens of µm in thickness. These deformations lead to bizarre surface morphologies of polymer materials after ion implantation treatment. The morphology of the surface depends on the type of polymer, the parameters used for the ion implantation treatment, temperature, thickness of the film, presence of fillers, and other parameters. We have observed structures such as parallel wrinkles in polyethylene (Figures 4.45 and 4.46) and in silicon rubber (Figure 4.47); “domain” structures of wrinkles in polyurethane (Figure 4.48); stair structures (Figure 4.49), worm structures (Figure 4.50), and star structures (Figure 4.51) in EPDM rubber; and fir tree-like structures in silicon rubber (Figure 4.52). These morphologies appear when there are two layers present: the denser hard surface layer on the top of a soft under layer. The soft layer may be unmodified or depolymerized under the surface layer. In both cases, the deformations arise as intrinsic stresses in the surface layer relax through deformations of the soft under layer. If the thin polymer film is bonded to a hard substrate (e.g., a silicon wafer or glass) and the soft undersurface layer is absent, the new surface morphology does not arise.
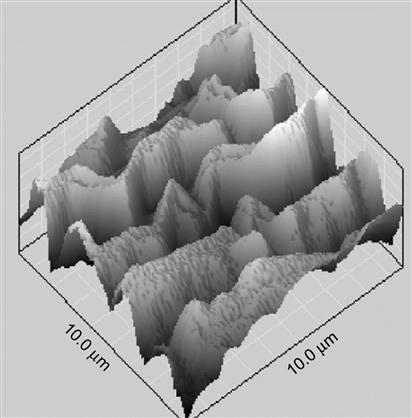
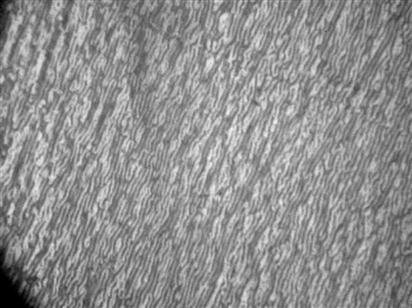
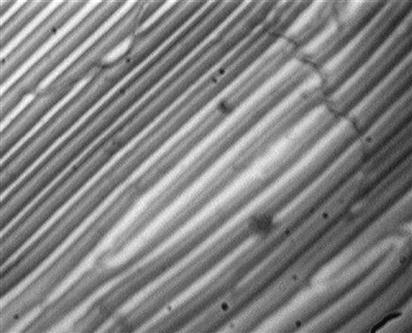
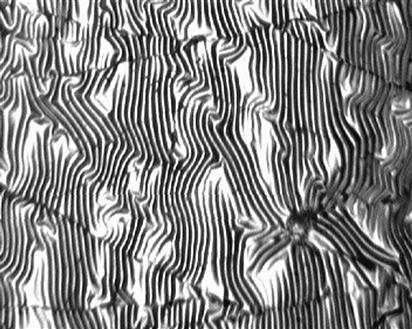
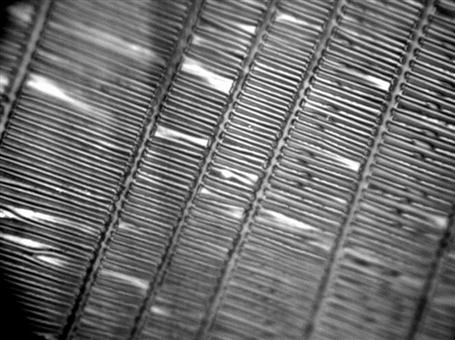
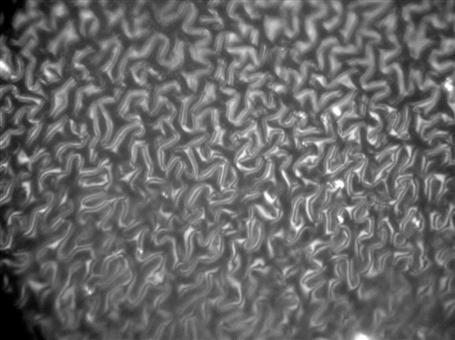
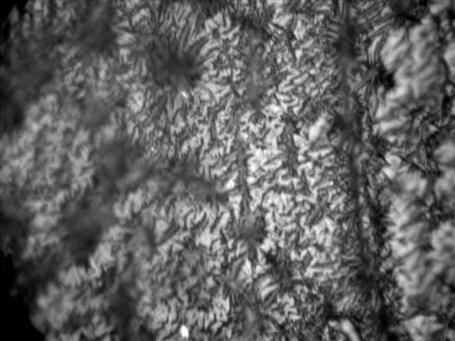
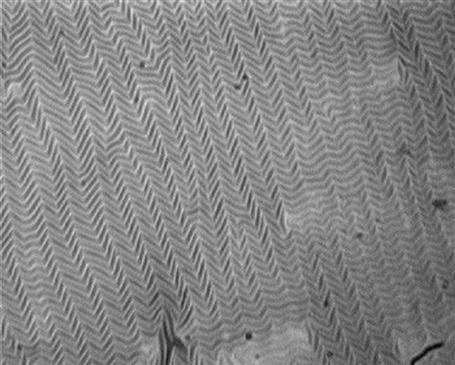
In some cases, the stresses in the surface layer do not deform the undersurface layer. In such cases, the relaxation of stresses can come through the formation of cracks in the hard surface layer, as seen in polyurethane (Figures 4.53 and 4.54) and butyl rubber (Figure 4.55). The density and depth of the cracks increase with the fluence of the ion treatment. In all cases, we observed that the thickness of the hard layer (according to the depth of cracks) was greater than the ion penetration depth. Therefore, the surface morphology changes are caused not only by the carbonized thin layer, but also by the cross-linked layer, which is thicker than the ion penetration depth.
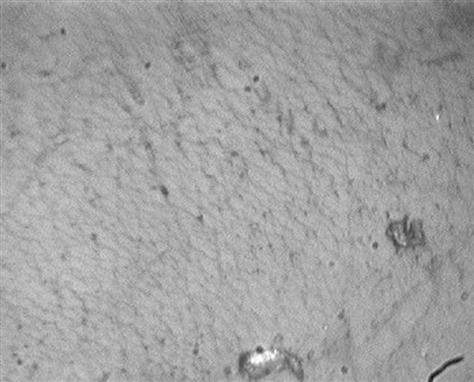
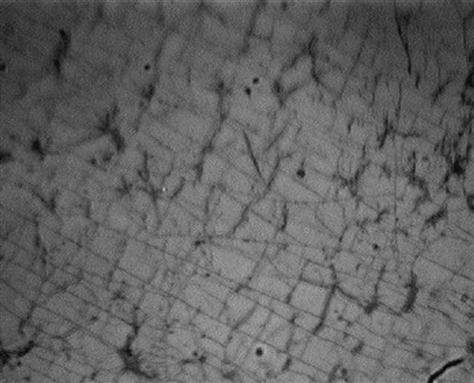
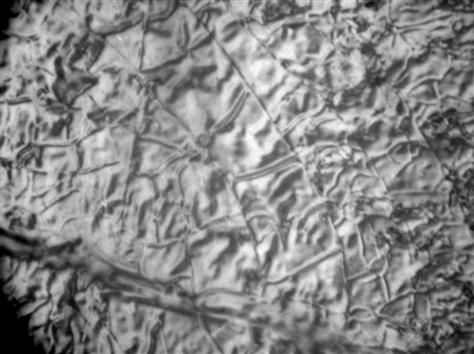
Effects of structural changes on mechanical properties
The structural changes in polymers after ion treatment also affect the mechanical properties of treated polymer. The mechanical behavior depends on the type of polymer, the thickness of polymer film or coating, and the ion implantation parameters. Typically, the strength of the polymer film decreases with increasing fluence of the ion treatment (Figure 4.56). The elastic modulus increases due to carbonization and cross-linking, the elongation to breakage decreases due to embrittlement of the polymer. This is observed for polymers with a low etching rate and a high cross-linking rate, such as polyethylene and polystyrene. For polymers that have high etching and depolymerization rates, the mechanical properties do not change significantly (Figure 4.57). This is observed for polymers such as PTFE and polyether.
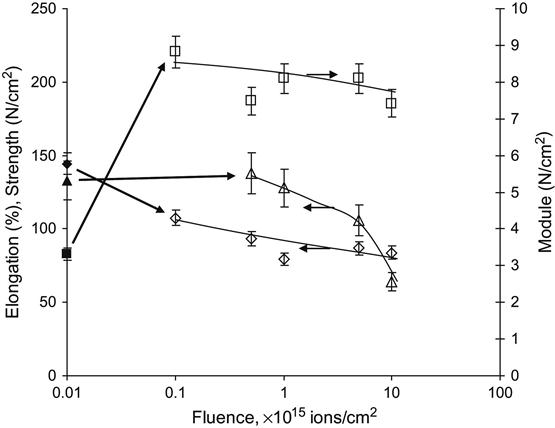
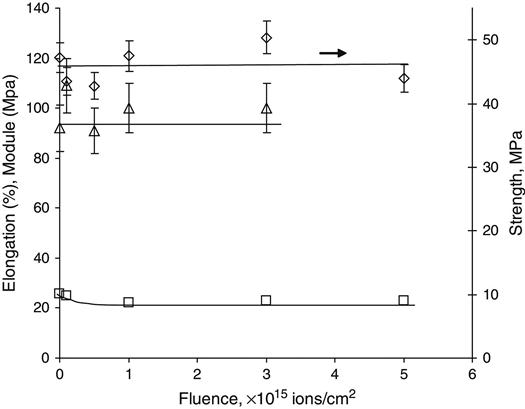
Summary
Drawing together all of the information obtained from the various approaches used for analysis, a model for the structure of the ion-implanted polymer can be deduced as follows. The modified structure consists of a number of layers and can be described according to the following layer-by-layer system (from the surface down).
First layer—the thin top layer is characterized by oxygen-containing groups (or other compounds that result from reactions with active compounds in the proximate environment) bonded with damaged polymer macromolecules in the case of low fluence or with the carbonized structure at high fluence. The structural changes in this layer are formed by the direct action of penetrating ions and subsequent interaction with the environmental that begin to alter the polymer upon the first ion penetration event.
Second layer—this layer includes the most damaged structure and it extends as far as the ion penetration depth. This layer is highly carbonized for sufficiently high fluences. The structure of this layer is formed by the interactions of displaced target atoms and a high density of defects at high temperature. The structure is a direct result of free energy minimization in the mobile collision cascades of the implanted ions.
Third layer—this constitutes a cross-linked layer or depolymerized layer (depending on the type of polymer). The structure of this layer is formed by radical reactions, which can be described in terms of radiation chemical processes in the presence of a low density of defects and at low temperatures in the absence of an aggressive environment. The structure of the macromolecules in this layer is not significantly changed from that of the unmodified polymer.
Fourth layer—this comprises the unmodified bulk polymer that is not changed by the ion implantation treatment.
An example of this layer-to-layer structure for polyethylene is presented in Figure 4.58. The structure changes from layer to layer gradually. The sharp boundaries are absent. Also, the boundaries between layers are rough, because the ion beam treatment process has a stochastic character with some nonuniformity in the distribution of ions on the polymer surface. Areas with variable structure changes as well as variations in the depths of the modified layers can be found across the polymer surface.
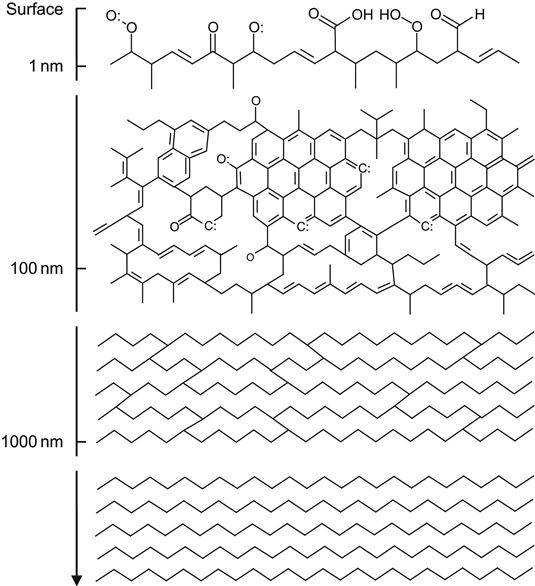
This unique structure on the top of the polymer brings about unusual properties, which can be used for different applications.