
Social Bookmarking Sites
Abstract
This chapter presents two representative examples of social bookmarking sites: CiteULike and BibSonomy. These sites are the embodiment of the folksonomy philosophy because they aspire to create an information resource which rests exclusively on the participation of its users through the posting and tagging of documents, resulting in a self-organized information system. However, the evolution of each has been opposed, taking them on different courses. While CiteULike was spreading across countries and disciplines, BibSonomy headed to becoming a specialized tool for computer scientists and limited to German-speaking countries. However, at the time that CiteULike is recording a deep stagnation with the gradual slowdown of its functions, Bibsonomy survives with high activity in a small niche. This chapter describes the principal functionalities of each service and analyses quantitatively their document repository, social instruments and user profiles.
Keywords
BibSonomy; CiteULike; folksonomy; social bookmarking; tagging
Under the influence of Web 2.0, many websites emerged with the purpose of building a community of users that feed the platform with their own creations. These in turn were organized according to the perception and valuation of the members themselves. In this form, this content could be set up for members without any mediation, from which emerged a self-organized and autonomous system. This structure was centred on the use of words for tagging the content supplied by the users themselves. These tags constitute the axis of the system because they are the main vehicle for browsing and searching these materials, in addition to having become the principal collaborative instrument. Following this model, dozens of sites, specializing in all sorts of content, arose across the web. Thus web platforms for sharing and tagging photographs (Flickr), videos (YouTube, Vimeo), presentations (Slideshare), links (Delicious, Reddit), etc., were born following this procedure.
This philosophy of building online social spaces where the content is organized by individual criteria was founded on folksonomy (Hayman, 2007). This concept of knowledge organization arose in around 2004 and advocated a system in which contents were directly and freely described by the users in natural language simply using keywords or tags. In some way, it intended to create a self-organized and universal knowledge system taking into account the individual perceptions of the persons. Its advantages are: its simplicity – no previous classification scheme is necessary, only tags that describe concepts; flexibility – there are no limits when it comes to assigning labels to an object; and findability – as more tags are used more the likelihood of finding an item. However, this system presents important limitations as well, for example: it is subjective – users may use contradictory words to describe the same object; there is no structure – because there is no previous scheme that relates these tags so there are no narrow and specific terms, no controlled language, polysemy, no plural/singular distinction, many words with a similar stem, etc. These problems make the retrieval of documents difficult and produce confusion and noise during the search (Marieke & Tonkin, 2006; Mathes, 2004).
Social bookmarking sites were born imbued with the spirit of the folksonomy and social tagging, proposing an alternative space where information was self-organized according to this model. At the same time, these platforms were aiming to create a collaborative environment which allowed discussion of, commenting on and valuing the posts of other members as well as producing collective products such as selected collections. In the academic environment, these sites offered the opportunity to create bibliographic services through the sharing and tagging of article references. These materials are the primary output of the research activity and it is essential they are informed in a discipline. So, it is not surprising that the social bookmarking sites for scholars rested upon these materials. Apart of this novel and relevant information model, social bookmarking sites favoured the establishment of an online academic community that took part in adding and tagging references, but also in valuing and discussing the impact of those items on the network. It is possible that these services appeared more as an alternative to other models of information management (i.e. search engines, directories) rather than as a place where a cohesive Science 2.0 community could be developed. In spite of this, they laid the foundations of the first social environment in which contents were the main goods for networking.
The first product of this nature was Connotea, a service launched by Nature Publishing Group in 2004, and was the first social medium addressed to scholars. It was closed in March 2013 due to growing problems with spam and associated service outages. Another ephemeral product was 2collab, a creation of Elsevier that was launched in 2007 and discontinued in 2011. CiteULike and BibSonomy were both born in 2006, are now the principal bookmarking services for scientists. This chapter will therefore focus on these two products as a way to explore the importance of social bookmarking for the scholarly community.
3.1 CiteULike
CiteULike is an online bookmarking service that helps to store, organize and share bibliographic references available on the Web. It was designed by Richard Cameron from the University of Manchester in 2004 for only private use. In 2006, Cameron was joined by Chris Hall, Kevin Emamy and James Caddy to set up Oversity Ltd, a company created to further develop and support CiteULike. In 2009, CiteULike signed an agreement with Mendeley to use the CiteULike library in the Mendeley desktop software (Mendeley blog, 2009). This is because CiteULike does not work as a reference management tool and it is not possible to insert references in any text. However, in February 2013, Mendeley stopped supporting the bridge.
CiteULike is a storage service of research references directed towards the academic community. It operates through a wide range of bibliographic formats that enable the automatic extraction of bibliographic records from any website and then their insertion in the library of each user thanks to a plug-in added to the web browser. This add-on software is a bridge that extracts the metadata of the source after including them in CiteULike. In this easy way users can feed their personal references database from any bibliographic source such as journals, repositories, citation databases, etc. It can extract/export citations from CiteULike itself, BibTex and RIS, which makes it compatible with reference management tools as well. Once the system extracts the bibliographic references, users can tag them in a natural language. In addition, these references can be edited to include more information such as external links to the original source or to upload a PDF file of the document. This turns CiteULike into a repository of researcher papers only accessible to the user him or herself.
3.1.1 A Decayed Database
One of the most successful aspects of this site is that it introduces a collaborative environment to enrich the value of the references posted. Created in the context of the folksonomies, Science 2.0 and social tagging, it develops a space where users can manage a wide list of references in touch with others, creating a great virtual library which organized through the individual actions of its users. In this way, CiteULike attempts to generate a large bibliographic service where the information is classified and organized thanks to the particular decisions of its members.
Figure 3.1 plots the number of articles posted to CiteULike and its accumulative curve. WayBack Machine from Archive.org was used to extract these data, but unfortunately CiteULike did not start publishing these data until 2008. In total by March 2015 CiteULike had reached 8 million papers uploaded to the system. The columns describe a general drop in the number of documents added annually, describing a slowing down in posting activity. The general annual growth was 19.5 per cent though during the last five year this has dropped to 7 per cent. These results provide evidence that the posting activity was already slowing down in CiteULike from 2008.

3.1.2 Building a Social Library
CiteULike operates using various social instruments to ensure the interaction of its members and the contribution of content. In this sense, two types of social tools can be differentiated, those that are addressed to the bookmarking of documents (groups, tags, watchlists) and those that are exclusively oriented to contact between users (blogs, connections). The first are instruments that support the creation and organization of a library from the previous actions of other users. With the exception of Groups, these elements are not collaborative but generate public results that can be taken advantage of by other users when they come to create their own libraries.
3.1.2.1 Tags
CiteULike employs a document classification system based on the use of tags or keywords created freely by their users. Each tag can be used again by each user, generating a participative process in the organization of papers named folksonomy. This system has the advantage that it does not need a previous scheme and the tags directly reflect the perception of the users of the document content. On the contrary, the use of labels or tags generates many terms that have similar meaning and ought to be processed (stemming) to analyse their vocabulary. In addition, these keywords do not belong to any scheme so it is not possible to build hierarchical relationships between broad and narrow terms.
Tags illustrate to some extent the thematics of the document posted and the most active users from a disciplinary point of view can be observed. Table 3.1 shows the ten most frequent labels extracted from CiteULike in March 2015. The six most frequent terms are related to the nematode c. elegands, an organism studied in developmental biology – as such, it seems that biologists are the most active members posting documents. However, these tags have the same frequency because they are used by a very active group, C. elegans/WormBase, most of whose papers have been uploaded to CiteULike. This also shows that the use of tags is very varied without a clear thematic pattern. For example, from a sample of 444,233 tags, 71 per cent were used less than ten times, which suggests a low rate of tags per document (Good, Tennis, & Wilkinson, 2009). The next most used tags, meeting_abstract (0.38 per cent) and articles (0.22 per cent), are transversal tags without a thematic sense but related to the typology of the documents.
Table 3.1
The ten most frequent tags in CiteULike
| Tag | Frequency | % |
| Elegans | 55,536 | 0.78 |
| c_elegans | 55,528 | 0.78 |
| Nematode | 55,528 | 0.78 |
| caenorhabditis_elegans | 55,523 | 0.78 |
| Celegans | 55,520 | 0.78 |
| Wormbase | 55,518 | 0.78 |
| meeting_abstract | 27,389 | 0.38 |
| Article | 15,750 | 0.22 |
| Diatomics | 8,962 | 0.13 |
| Unassigned | 8,962 | 0.13 |
| Total | 7,149,443 | 100 |
3.1.2.2 Groups
Another section linked to the collaborative posting of documents is Groups, a social tool addressed to put users in contact through their own libraries. Each group acts as a shared and open library in which each member can post references and tag them. In addition, members may interact between themselves by sending internal messages, holding discussions through a forum and publishing the results in a blog. There were 5,085 groups identified, from which 28,990 (13.9 per cent) users were inscribed in at least one group (Santos-Neto, Condon, Andrade, Iamnitchi, & Ripeanu, 2014). This percentage is rather low and suggests that this social tool is not attractive to the majority of the users. In fact, only 55 per cent of the groups have more than one user. On average, each group consists of 5.7 members, the same number as in 2008 (Lee & Brusilovsky, 2010), which suggests that many of these are old groups and that no new users have joined them recently.
Figure 3.2 shows the number of groups by the year in which they posted their last paper as an indicator of the degree to which group activity is updated. The annual columns describe a descending trend since 2008, which confirms the general drop in performance of the service viewed earlier (see Figure 3.1). Since 2010, half of the groups show no action, with the years 2008 and 2009 having the most activity (12 per cent). In addition, from 2014, only 11.3 per cent of the groups show any activity. These figures suggest that the Groups utility is falling into disuse and many are becoming inactive. Another significant fact from this decline in CiteULike’s groups is that since the creation of the platform, the number of groups has increase annually by 42 per cent, but in the last five years this creation rate has drastically fallen to 7 per cent.

Only 538,921 (8 per cent) papers are posted to these groups, a rather low proportion that again confirms the poor success of this social functionality and suggests that CiteULike is mainly used for private purposes. It is also interesting that 1,093 (21.5 per cent) groups do not include any documents. However, 106.3 papers on average were posted to these groups, an average much higher than that found in Profiles (25.7). This means that, although these groups are not numerous, they are very active in uploading references.
This activity contrasts with the lack of use of communication tools included in Groups. For example, each group has a forum in which group’s members can open threads when posting comments and generate discussions. However, the number of threads in these communities is only 2,427, 0.4 threads on average, reflecting that these groups are not used to discuss or comment on any information. Moreover, the group CiteULike-discussion, used as place for reporting bugs and solving usage problems, collects 2,220 threads, 91.5 per cent of all the threads in the system. This means that the use of forums is almost non-existent. Another communication tool in Groups is blogs. The purpose of this service is for news to be posted or any other text that helps the group working. These comments may be open or closed according to the type of group. As with forums, blogs are even less used. Only 114 (2.2 per cent) blogs with any posts were located and 63 per cent of them had not had any new content since 2010, which indicates that the blogs are anecdotal tools with a very low performance.
Table 3.2 presents the groups that contain most documents. As it was seen before, C. elegans/WormBase (5.15 per cent) is the most active group uploading documents, followed by Computational Cognitive Neuroscience Lab (3.04 per cent) and Journal picks (1.85 per cent). It is interesting to note that the distribution of users in these groups is very different, with very populated groups such as Bioinformatics (245) and biodiversity_conservation (100), and small sets with just a few of members such as Climate Change and Forests (2) and Computational Cognitive Neuroscience Lab (3). This suggests that the reasons for creating a group are very varied and arise from a wide range of needs. Thus there are groups built from a purely thematic view such as C. elegans/WormBase and Computational Cognitive Neuroscience Lab which attempt to create specialist libraries on specific issues. Other groups, such as PARDEM and T-MAPPP, emerge as supporting tools for research projects, delivering a basic library that helps the accomplishment of their tasks. In other cases these groups have an institutional origin, such as Journal picks (Wellcome Trust Sanger Institute) and FAB-lab (Simon Fraser University), whose function is to coordinate an update bibliographic collection for their research staff. Although the PARDEM and T-MAPPP groups are devoted to Physics and Computational methods, the rest of groups in the list are related to Biomedicine and Environmental Sciences, which seems to suggest that biologists and biomedical researchers are more likely to create groups in this networking service.
Table 3.2
The ten most important groups by number of documents uploaded
| Name | Documents | Members | Activity | % documents | Type |
| C. elegans/WormBase | 27,741 | 29 | 956 | 5.15 | Open |
| Computational Cognitive Neuroscience Lab | 16,363 | 3 | 5454 | 3.04 | Applying |
| Journal picks | 9,963 | 81 | 123 | 1.85 | Applying |
| biodiversity_conservation | 6,599 | 100 | 65 | 1.22 | Open |
| HEIRS – Environmental Illness Research | 6,427 | 18 | 357 | 1.19 | Open |
| PARDEM | 6,276 | 30 | 209 | 1.16 | Applying |
| T-MAPPP | 6,255 | 7 | 893 | 1.16 | Applying |
| Climate Change and Forests | 4,926 | 2 | 2463 | 0.91 | Invitation |
| Bioinformatics | 4,529 | 245 | 18 | 0.84 | Open |
| FAB-lab | 4,300 | 8 | 537 | 0.80 | Applying |
| Total | 538,921 | 28,990 | 18.6 | ||
| Average | 106.3 | 5.72 | 32.6 | 0.48 |

3.1.3 A Community in Decline
CiteULike includes a profile for each user in order to identify their members in the network and these can take part in any bibliographic group. These profiles comprise valuable information about location, position, affiliation, date joined and research fields that assists in the description of the distinctive features of this community. During March 2015, a crawler was developed to extract the most exhaustive list of profiles. An initial strategy was to select profiles by Research Fields, because this part is mandatory and all users have to be listed there. However, the system does not display more than 2,500 users by category, so not all the profiles in large disciplines can be retrieved. Another limitation is that this classification was not incorporated until 2010, meaning that users that joined the service before that date could be not listed. Thus a complementary crawler was designed to randomly select profiles from Everyone’s Library, a place where the most recent posts are listed. Finally, a total number of 208,243 profiles were retrieved. The representativeness of the sample was tested comparing with previous studies. For example, Emamy and Cameron (2007), creators of the site, detailed that there were 33,000 users in 2007, while the present sample contains only 17,582 (53 per cent) for that year. This disparity could be explained because pre-2010 profiles cannot be retrieved if they do not post an article, so this number actually corresponded to users that posted any papers. Emamy and Cameron (2007) also detailed that only 45 per cent of the users had posted a paper, a figure close to the 53 per cent found by the recent crawler. In consequence, this sample contains a proportion rather close to that of Emamy and Cameron (2007). Another study (Santos-Neto et al., 2014) detected 40,327 profiles in 2009, while the present sample contains 38,336 (95 per cent) at that date. However, Jiang, He, and Ni (2011) found 87,174 profiles in December 2010, 33 per cent less than our sample. Taking these reference figures into account, we would suggest that this sample is not greatly different to the others and may be representative of the total population of CiteULike.
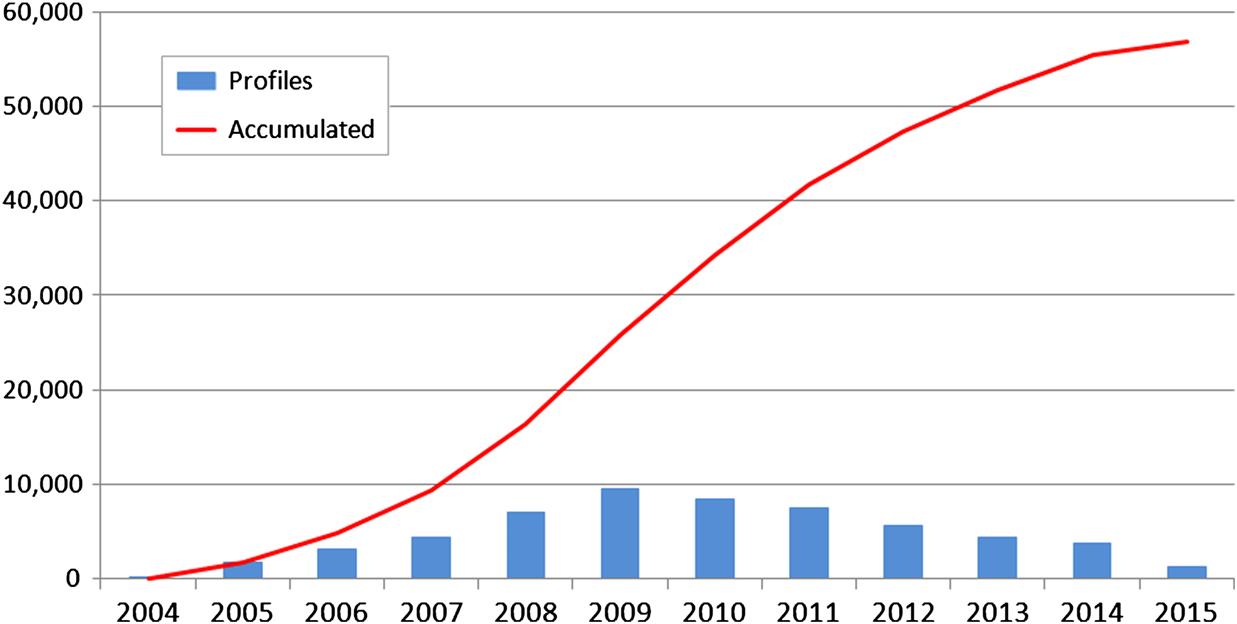
Figure 3.3 shows the total number of profiles retrieved and grouped by joining date. It describes a regular increase in profiles from 2004 up to 2009, with a little gap between 2007 and 2009 that could be motivated by the extraction problems mentioned above. Then, a sudden jump occurs between 2009 and 2010 where the population is doubled, being the year with most profiles. However, since 2010 the ascription of new users gradually falls each year with only 17,730 new entries in 2014. The annual growth rate proves this fact, observing a total growth of 84.1 per cent in the entire period, but only 9.8 per cent during the last five years. This trend coincides with the drop of activity previously observed in Groups, confirming that this drop of activity is not exclusive to profiles but occurs in the whole site in general.

Another way to observe the evolution of the activity on the site is to measure when their users stopped posting documents. This could be an indicator of when they gave up being interested in the site. Figure 3.4 shows the number of users by the year in which they posted their last paper. Since 2004, the posting activity appreciably increases till 2009, which saw the highest number of posted papers (Bogers & Van den Bosch, 2008). From that point, activity decreases more and more to the present. In general, this slow decline since 2009 could indicate a gradual loss of interest in this site by part of the scientific community due perhaps to the emergence of new, more advanced competitors or the obsolescence of many of their developments.
An important method to measure the activity in CiteULike is to observe the effort of users make in posting references into their personal libraries, to illustrate user interest in using platform. Figure 3.5 graphs on a logarithmic scale the distribution of papers by user. It follows a power law trend with a low exponent (γ=1.66), which means that the differences between users are not very high. In fact, only 25 per cent of the users have any documents in their libraries and of these 45 per cent host less than ten papers. These results describe a low use of the libraries and suggests that only a small number of users are using this function to a great degree.

According to the academic position of the profiles, 139,333 (66.9 per cent) users included information on this aspect (see Table 3.3). Many of these were Not Specified or Others (59.2 per cent), so only 41.9 per cent included specific information on their scholarly posts. This distribution also indicates, in an approximate way, the academic age of the users. The most frequent categories are Graduate Student (17.5 per cent) and Undergraduate Student (9.36 per cent), which correspond to young scholars at the start of their research careers. On the other hand, Researcher (3.2 per cent) and Professor (2.6 per cent) are academic staff that have an established scholarly activity. These figures illustrate that the service is preferred by young researchers who are preparing their doctoral dissertations or are starting their publishing career. This could be because in this point, researchers need to be informed of other work in their respective research fields and check the most recent literature. Thus it is natural that students would be the users most interested in this type of platform.
Table 3.3
Distribution of profiles by academic position
| Position | Profiles | % Profiles |
| Graduate Student | 24,428 | 17.53 |
| Undergraduate Student | 13,039 | 9.36 |
| Researcher | 4,415 | 3.17 |
| Professor | 3,660 | 2.63 |
| Lecturer | 2,962 | 2.13 |
| Assistant Professor | 2,629 | 1.89 |
| Associate Professor | 2,169 | 1.56 |
| Reader | 1,771 | 1.27 |
| Postdoctoral Researcher | 1,736 | 1.25 |
| Research Fellow | 1,555 | 1.12 |
| Total | 139,333 |
Finally, Table 3.4 presents the ten countries with the highest number of profiles in CiteULike. Only 9,619 (5 per cent) users included information on their location or affiliation, so these results have to be considered for informative purposes only. This low proportion could be due to the fact that many of them are students, and do not have a definite institutional affiliation. Otherwise, it is possible that this information is not relevant when it comes to sharing bibliographic references and was not filled in most cases. In any event, Table 3.5 shows that users mostly come from the United States (27.2 per cent) and the United Kingdom (10.7 per cent), the country where the service was born. It is not surprising that the highest penetration index is for the same country (2.9), followed by Australia (2.2) and Italy (2.1). In general, the distribution of users by country suggests that this platform is better entrenched in Commonwealth countries. The Country Spreading index shows that 68 per cent of users came from the first ten countries, which suggests a wide diffusion of the service to the entire world.
Table 3.4
The ten countries with most users in CiteULike in 2015
| Country | Profiles | % profiles | Penetration |
| United States | 2,619 | 27.23 | 1.47 |
| United Kingdom | 1,033 | 10.74 | 2.89 |
| India* | 459 | 4.77 | 1.67 |
| Germany | 445 | 4.63 | 0.92 |
| France | 384 | 3.99 | 1.08 |
| Brazil* | 362 | 3.76 | 1.83 |
| Spain | 326 | 3.39 | 1.76 |
| Canada | 321 | 3.34 | 1.43 |
| Italy | 313 | 3.25 | 2.07 |
| Australia** | 291 | 3.03 | 2.21 |
| Total | 9,619 | 100 |

*2010.
**2008.
Table 3.5
Distribution of profiles by research fields
| Research fields | Total | % |
| Biological Sciences | 32,974 | 14.61 |
| Medicine and Dentistry | 25,574 | 11.33 |
| Education | 25,255 | 11.19 |
| Mathematical and Computer Sciences | 21,837 | 9.68 |
| Business and Administrative Studies | 20,099 | 8.91 |
| Engineering | 20,050 | 8.88 |
| Social Studies | 19,439 | 8.61 |
| Physical Sciences | 13,744 | 6.09 |
| Subjects Allied to Medicine | 8,184 | 3.63 |
| Technologies | 7,088 | 3.14 |
| Creative Arts and Design | 5,473 | 2.43 |
| Mass Communications and Documentation | 5,029 | 2.23 |
| Historical and Philosophical Studies | 4,627 | 2.05 |
| Architecture, Building and Planning | 4,618 | 2.05 |
| Law | 3,372 | 1.49 |
| Linguistics, Classics and Related Subjects | 3,210 | 1.42 |
| Veterinary Sciences, Agriculture and Related Subjects | 3,208 | 1.42 |
| Eastern, Asiatic, African, American and Australasian Languages, Literature and Related Subjects | 1,081 | 0.48 |
| European Languages, Literature and Related Subjects | 820 | 0.36 |
| Total | 225,682 | 100 |
3.1.4 Research Fields
In 2010, a classification system was incorporated to thematically group the members, with the aim that users might find and contact other members with similar interests. CiteULike uses the Joint Academy Coding System (JACS) (HESA, 2015) for classifying the research interests of their users. This hierarchical scheme is structured on three levels, but CiteULike groups these levels into two subsections, selecting certain classes and omitting others. It is mandatory for each user to select at least one research field as primary and then select other fields as secondary. A crawler launched in March 2015 extracted a list of users by research field. However, CiteULike only shows the first 2,500 users by field, so in some cases the total value was estimated. As seen above, this classification was added in 2010, so a high proportion of users may not have been classified. The fields with most users are Biological Sciences (14.6 per cent) and Medicine and Dentistry (11.3 per cent), whereas the smallest fields are Eastern, Asiatic, African, American and Australasian Languages, Literature and Related Subjects (0.5 per cent) and European Languages, Literature and Related Subjects (0.4 per cent) (see Table 3.5). These percentages show that biologists and biomedicine researchers have a strong presence in this space, which could explain why these users are the members that most groups create and are the most active tagging papers.
3.1.5 The Decay of an Extended Service
CiteULike has become the most representative example of social bookmarking sites for the scholarly community because it has brought together the most extended community of members (more than 200,000 users) and covers all the main research areas. In this sense, it could be said that CiteULike contains a representative sample of the scientific community with an important presence of biologists (14.6 per cent) and physicians (11.3 per cent). On the other hand, it also describes a balanced geographical distribution, although some of the best represented countries are from the Commonwealth. However, this platform also contains an important but disproportionate presence of graduate and postgraduate students (26.8 per cent), many of them perhaps attracted by the possibilities for uncovering new and updated bibliographic references.
Another relevant feature of CiteULike is that the social interaction is not limited only to sharing content through tags and groups, but it also aims to create a real networking environment where it is possible to discuss opinions on uploaded references or publish results obtained from these references. However, the analysis of these social tools demonstrates that most of the users are not interested in collaboration tasks. For example, only 13.9 per cent of users are linked to some group, who post just 8 per cent of the total number of documents in the system. On the other hand, the activity in these groups (32 posts/user) is slightly greater than in the site overall (26 posts/user), which suggest that members linked to groups are more active than the profiles not affiliated to groups. On the other hand, blogs and forums are instruments designed to get along with their members and share information and knowledge. Nevertheless, these instruments are underused and rejected by most group members. Forums are inexistent and only 2 per cent of groups have a blog. These figures illustrate that most of the users prefer to employ CiteULike for private purposes (i.e. managing their own library) rather than to participate in collaborative tasks with other members. In this sense, this networking space is not achieving the creation of a dynamic and participative community, but rather a platform for isolated users focused on their own interests.
However, CiteULike has been experiencing a generalized decline since 2009. From that moment the number of new users began to plummet, as did the rate of last posts in both groups and individuals. In terms of any parameter, CiteULike is losing performance and is in danger of stopping or disappearing. The reasons for this absence of vigour are varied. The most important could be its limitations as a reference management tool. As a bookmarking tool CiteULike is a good instrument but it fails when it comes to the management of this library such as its integration into written documents and the generation of bibliographies (Gilmour & Cobus-Kuo, 2011). This situation was highlighted by the Mendeley agreement in 2009, which may have provoked a migration to new software with more bibliographic solutions. In general, the appearance of the networking functionalities in reference management and document sharing sites would relegate CiteULike to a marginal and secondary position, as well as evidencing the obsolescence of its model and the need to adapt to the new networking trends in scholarly social sites.
3.2 BibSonomy
Another important bookmarking tool is BibSonomy, a service developed by a mixed group of German scholars from the Institute of Knowledge and Data Engineering at the University of Kassel, the DMIR group at the University of Würzburg and the L3S Learning Lab Lower Saxony in Hannover (Wikipedia, 2015). This service started as a student project in spring 2005 and quickly grew out of the prototype status into definitive release in 2006. In 2007, BibSonomy signed an agreement with the Digital Bibliography and Library Project (DBLP) to automatically import references from this database (BibSonomy blog, 2007).
As with other services dedicated to the online bookmarking of information resources, BibSonomy is a platform where users can upload any type of document to be shared with the scholarly community brought together in this service. These materials can be freely tagged by any member using labels taken from natural language without any type of limitation. In fact, in order to improve the findability, the system developed a recommendation mechanism to suggest tags. In this way, the more an item is tagged the easier it is to find it.
An interesting feature of BibSonomy is that it distinguishes between posting bibliographic references (publications) and other material accessible via the Web (bookmarks). In this sense, BibSonomy is somewhere between a classical bookmarking tool such as Delicious or Digg and an online citation service such as CiteULike and Connotea. There are different ways to include a document in the platform. The first is to directly post the item by filling out a form, which can be automatically completed inserting only the ISBN, ISSN or DOI of the document. The other way is through a plug-in in the web browser that directly captures the metadata of the object. These references can be processed through JabRef, an open reference management system that enables the building of bibliographies and insertion of citations in research papers. BibSonomy stores the bibliographic references in BibTeX format so users can export records to any other reference management tool such as EndNote and ReferenceManager and in any output such as HTML, RIS, CSL or MS Office XML. In addition, it is possible to add a full-text paper linked to a publication, although this file is only visible for users themselves and their friends or groups. This allows the creation of personal repositories of articles.
3.2.1 Coverage, a user Called DBLP
Figure 3.6 shows the distribution of items posted by year. BibSonomy has an API at the user’s disposal to find data on the service and to automatically post high volumes of items to the network. Thanks to this API 3.45 million references were identified, from which 3.02 (87.7 per cent) were publications and 0.42 (12.3 per cent) web resources. This confirms that there is a great difference regarding to the type of material posted to BibSonomy, demonstrating that most of the items uploaded are bibliographic references (Borrego & Fry, 2012). However, the platform signed an agreement with the DBLP in 2007 according to which the latter database supplies bibliographic references to be directly posted in BibSonomy. These publications are included by the user @dblp and tagged with dblp, so these materials can be retrieved with a query selecting those parameters. Figure 3.6 also shows that the majority of the bibliographic references, 2.33 million (76.9 per cent), posted to BibSonomy come from the DBLP. Subtracting the posts from that bibliographic database, the number of citations uploaded by the users would be then 0.69 (23.1 per cent) millions. Although the proportion of publications is still higher than with bookmarks, the difference is now not so high. Figure 3.6 describes a general increase in publications and bookmarks from 2005 to 2011. From that point, the number of new posts drops abruptly with an annual growth of 27 per cent that has fallen to 12.9 per cent in the last five years. When it comes to posting resources this could be symptomatic of loss of performance on the site. The graph also shows an activity peak in 2009. This could be due to the ECML PKDD Discovery Challenge, an event held in 2009 where several members posted and tagged items to test the reliability of the system (BibSonomy Blog, 2009). This punctual event demonstrates that the activity in adding references to the system is low because this performance caused a marked footprint in the evolution of the posting activity in the service.

3.2.2 The German Club
Any user has to be registered for posting and tagging papers and web resources in BibSonomy. This allows each member to be identified and makes interaction with other users and collaboration in groups possible. Through the API, it is possible to determine the total number of users that participate in the service. Thus 918,705 users were identified in this way, but only 8,947 (0.97 per cent) of them posted any document to the network. The high percentage of inactive users could be to unsubscribed users deciding to leave the site or simply users that do not take part in the platform. In any case, it could indicate a sign of dissatisfaction with the system.
Among the active members, there are more users posting publications 6,252 (68.9 per cent) than bookmarks 4,803 (53.6 per cent). In addition, 545,595 bibliographic records were uploaded to the system, a proportion of 87.3 papers by user, while only 335,172 bookmarks, 69.8 per member, were posted. These figures are lower than the previously observed total number of publications and bookmarks in the system. It could be that the site only shows the number of posts up to a certain point. Hence, for example, there is no count of the number of publications posted by the user @dblp, the largest contributor to the platform.
With regard to the origin of these users, BibSonomy allows the building of personal CVs where members may put basic identification data and list their own publications. However, this is anecdotal because only 347 users include any data on their curricula, a derisory percentage of 3.8 per cent. Analysis of these curricula provides only an approximate view of the total users that participate in the site. According to the location and affiliation of these curricula, it is worth highlighting that 41 per cent come from Germany, 7.2 per cent from the United States and 4.6 per cent from France. These unusual percentages reveal that BibSonomy is a local tool strongly established in Germany but with little international impact. This is confirmed by the Country Spreading indicator that shows that close to 74 per cent of users are concentrated in the first ten countries.
Figure 3.7 presents the distribution of users by the year in which they posted their last item. This allows us to observe the evolution of the activity according to the posting performance of the users. The trend shows that the posting performance increases until 2008 in the case of bookmarks and until 2009 regarding publications. The columns then fall until 2013, when there is slight upturn that is more visible in publications. This distribution indicates that there is a standstill during the period 2009–12, brought about perhaps by users leaving, while the peak in 2014 would correspond to active members. Even so, 21 per cent of active users have posted material after 2014, which shows that the network is maintaining a certain amount of activity and still displays updated resources. This would seem to contradict the fall in items posted seen earlier in Figure 3.6, where the number of documents posted has fallen since 2011. This is explained by the fact that the site has lost a large number of users, so the number of items posted has gone down. However, while there are much fewer users than before, the small fraction of those remaining are more active and maintain the site with an acceptable updating service.

3.2.3 Social Dimension
One of the objectives of any social bookmarking tool is to create a collaborative environment in which members can interact among themselves, sharing their posted documents and organizing their libraries with tags in common. This implies that in spite of posting and tagging being personal actions to address a private benefit, they are also public and can be reutilized by other members. Although no direct collaborative actions are supported, BibSonomy does facilitate several tools to reinforce interaction between members. Users can add other users as friends, sharing the bookmarks and following the activities of others. However, these actions are not public and it is not possible to know who is a friend of whom, which could indicate the degree of involvement in the network.
Another possibility for interaction is to discuss and comment on the literature uploaded by other members. Users can include comments on any post as well as rate it according its value. These comments and ratings are visible to the entire community, encouraging the discussion on the content of new items and ranking documents by the punctuations received.
3.2.3.1 The BibSonomy’s Meeting Point
The main collaborative tool in BibSonomy is Groups, where it is possible to create a private environment and where group of members can post each other websites or bibliographies for a particular purpose. For example, a group may be created to post information that is only visible to a specific public. In order to avoid spammers, BibSonomy only permits the setting up of groups after the permission of the administrator has been requested. With regard to authorization, the rest of the members have to ask the creator of the group to be included. These draconian measures would explain the scarce proliferation of groups in this service. In a search by crawler performed in April 2015, 332 groups were identified, a figure that seems rather small for a community of 8,947 active users. In fact, these groups include 1,615 (18 per cent) users, a percentage somewhat higher than that observed in CiteULike but in line with the poor participation in these common spaces. On average, these groups number six users and only 219 (65 per cent) of the groups have more than two members. These groups are close to the size of a workgroup, in which a small number of people employ this function to gather shared resources. In spite of the restrictive criteria to avoid spammers, 52 groups (15 per cent) did not develop any activity, with no bookmarks or publications posted.
Table 3.6 presents the ten most relevant groups ranked by rate of member posts (activity). In BibSonomy, the number of users by group is more balanced although the average activity in the groups (189.8) is much higher than CiteULike, demonstrating that BibSonomy’s groups have very high energy. In terms of bookmarks and publications, there are on average almost the double the number of bookmarks (1,032) than publications (626) posted to these groups. This differs from the global data, where the proportion of publications is higher than bookmarks. This could be due in great part to the publications in the general database automatically coming from the DBLP, while groups only include resources manually introduced by their members. This, perhaps, suggests that users’ groups prefer to post web resources which are more ephemeral and volatile than publications and therefore it is necessary to conserve their links before being deleted or moved.
Table 3.6
The ten groups with the highest activity in BibSonomy in April 2015
| Group | Name | Bookmarks | Publications | Total posts | Members | Activity |
| taggingsurvey | Tagging Survey | 5,197 | 2,676 | 7,873 | 11 | 715.7 |
| linkinglinke | LinkingLinke-Group | 4,077 | 1,587 | 5,664 | 10 | 566.4 |
| bibsonomy_dev | bibsonomy_dev | 7,924 | 3,717 | 11,641 | 21 | 554.3 |
| 20dc13 | 15th Discovery Challenge | 5,041 | 3,176 | 8,217 | 15 | 547.8 |
| Tagora | Tagora Project | 9,685 | 5,536 | 15,221 | 28 | 543.6 |
| uw_ss15_web2.0 | uw_ss15_web2.0 | 4,501 | 1,930 | 6,431 | 13 | 494.7 |
| Kde | Knowledge and Data Engineering Group | 11,291 | 7,604 | 18,895 | 39 | 484.5 |
| Mykde | Mykde | 3,128 | 2,517 | 5,645 | 12 | 470.4 |
| Sensinthecity | Sensinthecity Project | 4,847 | 2,546 | 7,393 | 17 | 434.9 |
| Dmir | Data Mining and Information Retrieval Group (University Würzburg) | 4,501 | 1,941 | 6,442 | 15 | 429.5 |
| Total | 206,416 | 170,373 | 376,789 | 1,675 | 380.4 | |
| Average | 1,032.08 | 626.37 | 1,308.29 | 5.98 | 189.8 |

The names of the most active groups suggest that many specialize in Computer and Information Sciences. For instead, the Knowledge and Data Engineering Group and bibsonomy_dev are two examples of groups specializing in computing research. These names also illustrate the different reasons for the creation of a group in a bookmarking service. For example, there are many sites that belong to the research groups, the Knowledge and Data Engineering Group and the Data Mining and Information Retrieval Group (University Würzburg), which employ this functionality to organize and create an updated library of bibliographic resources important for their studies. Other groups are related to the research project, the Tagora Project, which utilise this service to gather web and bibliographic resources to document their tasks. Other utilities support conferences (15th Discovery Challenge) or teaching classes (uw_ss15_web2.0). This wide typology of groups is clear evidence of the heterogeneous uses to which this functionality can be put.
It is interesting to note that many of the most active groups have been set up by the same users who participate in several groups at same time, for example: @hotho is part of 23 groups, included the ten most active; @dbenz posts resources to the Tagora Project, the Tagging Survey, the LinkingLinke-Group and the Knowledge and Data Engineering Group; and @stumme collaborates in the Tagora Project, the Knowledge and Data Engineering Group, the Sensinthecity Project and Mykde as well. This would be surprising were it not that they are the creators of the project. This suggests that most of the activities of these groups is performed by members of the research groups that developed the project. So, it is possible that the actual performance of this service, excluding the users that manage the site, is lower than that observed.
However, if we observe the group activity from a temporal perspective, we can see that most of the BibSonomy groups are very active (see Figure 3.8). Of these groups 46 per cent have posted some resource since 2014, being 2015 the year in which the most groups posted documents (35 per cent). In addition, more of the half of the documents had been posted to these groups before 2012 (55 per cent). This behaviour is similar to that observed in the general posting activity, which also shows high levels of recent posting. Therefore BibSonomy shows that, in spite of there being few users on the platform, those users are very active both in profiles and in groups.

3.2.3.2 Tabs, Linking Documents
As on any social bookmarking site, Bibsonomy uses a tagging system to organise, store and retrieve documents posted. These tags are created by the users themselves, although the system has the ability to extract keywords from the text and suggest those terms as tags. Bibsonomy uses a recommendation system adapted from the PageRank algorithm, FolkRank (Benz et al., 2010). In this case, a tag is more important according to the times that it is used and who uses it. For example, tags used very frequently in the system and inserted by very active users are more relevant than tags infrequently from sporadic members. The aim of this rank is to avoid spam and select the hottest terms by common users in the network.
BibSonomy only lists the hundred tags most used by the community, which are assigned to 443,722 documents. Table 3.7 selects the ten most frequent tags in April 2015, reporting that many of the posted documents belong to Computer and Information Sciences, a similar fact already observed in groups. It is thus possible to observe software, web2.0 and programming as specific terms linked to computing disciplines. Another interesting fact is the presence of German language keywords (i.e. Deutschland, Theorie), which would confirm that this service is principally used by scholars from Germany.
Table 3.7
The ten most used tags in Bibsonomy
| Tags | Frequency | % |
| software | 15,590 | 3.51 |
| Deutschland | 12,871 | 2.90 |
| myown | 12,533 | 2.82 |
| web2.0 | 10,739 | 2.42 |
| programming | 10,639 | 2.40 |
| web | 10,178 | 2.29 |
| tolos | 9,872 | 2.22 |
| blog | 8,708 | 1.96 |
| Humans | 8,491 | 1.91 |
| Theorie | 8,470 | 1.91 |
| Total | 443,722 | 100 |
However, the use of tags as a knowledge organization system is problematic because these labels are not restricted to any classification scheme and therefore it is not possible to establish hierarchical relationships between them, ranging from very specific words to keywords with a broad meaning. BibSonomy introduces concepts as a way to solve this limitation. Concepts are terms that group a wide range of tags that belong to the same semantic field. In this way, each concept acts as a generic term that brings together other narrow terms, thus creating hierarchical dependences among tags.
BibSonomy does not make available the full list of concepts, only the fifty most used by the community. Table 3.8 shows the five concepts that most tags group. Two things are evident in this list. The first is that the most used concepts belong to the computing research field such as software, computer or programming, which verifies again that this social network is mainly used by users coming from that scientific area. The other interesting observation is that some of these concepts are rather broad and imprecise, without a clear meaning. For example, people, web or research are very generic concepts that do not allow us to know what tags are under those words. Concepts could be a solution to introduce a certain structure to the tagging process but the results prove that they only reproduce the same problems observed in the folksonomy system and suggest that a more structured classification system is needed.
3.2.4 A Local Project
BibSonomy was born with a clear commitment to Science 2.0 and with the solid belief that folksonomy and social tagging are efficient and original ways of managing knowledge. Thus the entire site is organized by tags, which are the principal instruments for navigating through the service in search of relevant information resources as well as the fundamental feature of the building of a stable community of scholars. This mix between knowledge organization and social collaboration lays the foundation for the emergence of new ways of finding information such as serendipity or browsing. But in addition, BibSonomy explores in depth the chances that offer the different relationships between tags, in order to create new practical notions such as Concepts, which will lead to improvements in the search and management of information. The most original contribution of BibSonomy is the clear distinction between posting web resources and bibliographic references, establishing itself between a classical bookmarking service and an online reference management tool. In this way, it broadens the information sources that feed the system and enriches the possibilities of use.
On the other hand, BibSonomy arose from an academic environment set up by a small number of scholars devoted to web programming and knowledge management in Germany. However, the site has not progressed beyond this foundational space and become a global instrument for the entire scientific community. Thus the most used tags and concepts, as well as the affiliations of profiles, demonstrate that BibSonomy continues to be a local tool used mainly by German-speaking and other European users. One other consequence may be seen in the thematic distribution of tags and concepts, which provide evidence of an almost exclusive presence of content related to the Computer and Information Sciences. In general, BibSonomy demonstrates little growth, a fact not only evidenced by the environment in which it situated, but by the actual size of the site. BibSonomy has only 8,900 active users – very low for an academic social site. However, this becomes even more meaningful when it is highlighted that more than 900,000 users are registered on the website. It is evident that this loss of users indicates a high degree of disaffection with the platform.
However, BibSonomy survives. The activity observed among users and groups shows that there is a high proportion of users (21 per cent) and groups (46 per cent) that keep on posting resources. In this way, although the site has lost a considerable number of users and the rate of documents being posting has fallen, the performance of the site is still good thanks to the current users. As we have seen, many of these active users are the founding members and creators of the site who maintaining a high level of activity both in groups and individually. This could distort the perception of the site a little and it is possible that the figures observed would be worse without the stimulated participation of these founder members.
Finally, an important critique of BibSonomy is the employment of data from the DBLP database. There is no problem in taking data from secondary sources to feed the system as this is usual in other information web resources. However, this could distort the view of the site as these records are not in actual fact posted by an individual but are automatically added by the system. This inflates the perception that the content network is growing thanks to the particular activity of its users when the reality is that 76.9 per cent of publications are not posted by the members at all. In fact the activities of the current diminished number of users alone is not enough to keep the site active with recent and varied posts. In addition, this reveals an important limitation of the social bookmarking model, that these spaces only properly work if there is a large and varied critical mass that energises the platform (de Borchgrave, Sanderson, & Harned, 2007). This finding casts serious doubts about the folksonomy and the possibilities of creating suitable information resources.
3.3 The Social Benefit of Egoism
Social bookmarking sites come as an alternative to the existing scientific information services. From a social perspective, these systems aimed to build bibliographic information systems based on the unselfish attitude of individual scholars towards uploading and tagging records. Following a Smithsonian principle,1 the egotistical interest of each user in creating and managing his or her own library produces an organized bibliographic system useful for the entire community. This egotistical attitude has been observed in the poor use of collaborative tools. Thus, the percentage of active members participating in groups is 18 per cent in BibSonomy and 13.9 per cent in CiteULike. When other tools are analysed, the situation is even worst. The blogs and forums on CiteULike are not being used at all, and the rating and discussion of posts in BibSonomy is anecdotal (5.8 per cent). These percentages demonstrate that the users of social bookmarking sites are not truly interested in social networking but rather in taking advantage of the resulting system. Du, Chu, Gorman, and Siu (2014), surveying Connotea’s users, concluded that most of the members used Connotea for personal information management instead of group purposes. However, although not many users wish to participate in groups, those that do keep the rate of activity higher than the average. Thus, CiteULike’s groups post 106 papers on average while for the entire site it is 25.7; in BibSonomy 189.8 items on average are uploaded to groups while 101.3 documents on average are posted by each user. In the case of BibSonomy, the group’s activity is not only higher but it is also more up to date. While 46 per cent of groups have posted something since 2014, only 9 per cent of CiteULike’s groups added any posts in the same time period. This suggests that BibSonomy is in better health than CiteULike, which has suffered a generalized falling off since 2009.
Thus the successful element in a social bookmarking site is the amount of content that its users contribute to the system, so that the more bibliographic records are tagged and shared, the more valuable is the website as scientific information source. According to this idea, CiteULike jumps ahead of BibSonomy. It is the largest service in number of posted publications (8 million records) and registered users (208,000 users approx.), in contrast to the 3.45 million items and 8,947 active users in BibSonomy. In addition, CiteULike has spread across the web sphere in a uniform way, reaching all disciplines and users from all over the world. Hence, the disciplines with the most users are the Biological Sciences (14 per cent) and Medicine (11 per cent), the research areas that produce most results, while the countries with most users are United States (27 per cent) and United Kingdom (11 per cent), the first two scientific powers. However, BibSonomy seems not to have managed going beyond the local surrounding, remaining a site specializing in Computing and Information Sciences – the most frequent tags and concepts come from that research area – and limited to a German-speaking population (41 per cent).
Both sites, born in 2006, are the most relevant examples of social bookmarking for scientists today. They represent the archetype of the folksonomy and social tagging ideas, creating self-organized information systems where the individual action of each user may produce a complex system of scientific information. The folksonomy dream has resulted in a stagnated space (CiteULike), a local and reduced service (BibSonomy) and other sites that have disappeared altogether (Connotea, Collab2), demonstrating that social bookmarking presents more problems than advantages for information management. However, in spite of not having entirely succeeded as social sites and with low levels of collaboration and interaction among their users, they indeed were pioneers in the building of a collaborative environment for sharing references and tags. While their decline could not have been avoided, new collaborative tools such as reference management occupy their space in the social sharing of scientific resources.