
Reference Management Tools
Abstract
This chapter analyses the bibliographic coverage, networking functions and population distribution of reference management tools. These networking spaces generally emerged from desktop applications for organizing bibliographic references to social networking environments setup to share and tag citations for scholars. Two of the most important reference management tools, Mendeley and Zotero, are described in detail. Mendeley has the largest bibliographic database where users can read and tag the publications that other members share in the public catalogue. However, its networking functionalities are hardly exploited at all, which casts serious doubts on its future as a social networking platform. Zotero, on the other hand, is a local, reduced platform occupied above all by American users from the Humanities and Social Sciences. Nevertheless, the great limitation of this platform is that it does not have a public catalogue of the references added to the service, which impedes the sharing of references between members. As a result of this users employ groups as the means to achieve collaboration.
Keywords
Mendeley; readers; reference management tools; Zotero
Software for reference management was born in the early 1980s to support the academic activities of the users, allowing the organization of large bibliographic databases and the use of these references for the elaboration of scholarly documents. ProCite and Reference Manager were the first solutions of this type and they consisted of a system for managing a bibliographic database and several outputs such as bibliographies, citation styles and a gateway to include citations in word processors. However, these products could only be fed manually or through the Z39.50 protocol (Miller, 1993). The Web posed, in this sense, a great opportunity because it made it possible to access a wide range of bibliographic sources and collect many types of items. This change promoted a new generation of reference managers and Mendeley, Zotero, EndNote and RefWorks, for example, emerged as systems that capture bibliographic metadata included in web pages (Norman, 2010). So, it was not surprising that Zotero was born as a Mozilla plug-in that captured references while surfing the Web or that Mendeley relies on data extraction from multiple web sources. In this way, reference management tools moved from the desktop to the Web to increase their bibliographic services as well as enhance their attractiveness with networking functionalities.
However, these applications did not develop in response to a collaborative need, as happened with social bookmarking sites. Reference management tools are products oriented to individual users that aim to have a large bibliographic database that supports their personal scientific activities (writing papers, being informed in their research fields, etc.). Therefore, the functionalities of these systems do not depend on the social involvement of their users, but on individual purposes oriented to make the most of their libraries. Why then have these products developed social networking platforms? The response may be found precisely in the influence of the bookmarking sites and the way in which these sites feed their systems. As it has been seen, social bookmarking platforms were forerunners of these bibliographic services that succeeded thanks to the participative activity of their users putting and tagging information into the system. It is possible that reference management tools observed this model and they find in users the possibility of increasing their sources with non published materials, data sets and web pages, as well as taking advantage of the document usage for producing statistics on information consumption (i.e. Readers in Mendeley).
Reference management sites could therefore be considered one step more advanced than social bookmarking sites because they take from the latter their main social tools such as tags, groups, followers, etc. and join them to a powerful bibliographic service. In this way, reference management tools transcend personal functions and create a global information system enriched by the social interaction of their users. In other words, reference management systems jump from the individual desktop to the social web and incorporate all the networking instruments already introduced by bookmarking sites. It can be said then that reference management sites are one step further in the evolution of academic social sites because they combine the power of a scientific information system and the flexibility of an open social sharing platform.
This chapter focuses on the two most representative bibliographic management tools that incorporate social networking utilities. Mendeley and Zotero are the only platforms that achieve those requirements as well as being open and freely accessible to any scholar. (This is the reason that EndNote is not analysed in this study, because its social network is only accessible for private customers of Thomson Reuters.)
4.1 Mendeley
Mendeley is a reference management platform that is set up with two basic elements: desktop software and a social website. The first is a local database management system of bibliographic references and the second is a web platform to share these references. The product was started in 2008 by Jan Reichelt, Victor Henning and Paul Föckler, a group of German scholars specializing in information studies who met in London. The objective of this initiative was to create an application that would enable the management of bibliographic references as well as make it possible to share and discuss these documents with others. For this they were inspired by the music platform Last.fm, from which they took the principal elements (Henning & Reichelt, 2008) of an open database, usage-based metrics and collaborative filtering. Since its release, the site has been honoured with prizes and awards. However, in 2013 it was purchase by Elsevier, one of the giants of academic publishing. This produced an angry outburst as many users considered Mendeley to be an example of the Open Access movement, and this integration with Elsevier would break its commitment (Anderson, 2013).
4.1.1 Desktop App
The desktop application is software that allows the creation of a database of bibliographic references to be used to generate bibliographies and to manage the citations included in a academic paper. Using a plug-in, this software is connected to any text processor (MS Word, Mac Word, LibreOffice, BibTex), enabling the use of the database to insert citations in the text and generate reference lists. It accepts a large amount of citation styles and also incorporates a CSL editor to enable the design of a personal style (Zaugg, West, Tateishi, & Randall, 2011).
In addition, it incorporates a PDF reader, which when linked to the bibliographic database, makes it possible to manage a full text bibliographic database. In this form, the reader permits the extraction of metadata from each PDF file to be included in the database. In addition, this collection of PDFs is organized as a library, where the full texts of the documents are indexed and therefore can be retrieved using any relevant word. This reader acts as a text editor, which allows the inclusion of notes and the highlighting of relevant sections of the text as well.
Mendeley also acts as a bookmarking service in the same way as CiteULike, BibSonomy or Connotea. Through a plug-in installed in the web browser, bibliographic references can be incorporated from the most important publisher sites and scientific information services. Mendeley accepts multiple importing formats such as BibTeX, RIS and EndNote XML, which means that it directly accepts records from Zotero, Papers and EndNote, their principal competitors. In addition, Mendeley is compatible with any operating system and offers access from the Web, smartphones and any other device.
4.1.2 The Crowdsourced Catalogue
Mendeley maintains a public bibliographic database from the records inserted by each user in his/her private personal library. Hence, whenever users upload references to My Publications, these appear in the global web collection of Mendeley, the rest remaining hidden on the desktops of the users. In May 2015 Mendeley made the extravagant claim of more than 500 million papers (CrunchBase, 2015), but this unlikely amount is no doubt the result of the aggregation of every personal library without distinguishing duplicate records. Thus the most up-to-date approximation of the total number of unique papers is 114 million (Pimasoli, 2014). However, it is very hard to work out the real coverage of Mendeley because there are several difficulties in its API in order to retrieve bibliographic data (Gunn, 2013). Moreover, from 2014 the API has not offered any statistical information on the document catalogue, profiles or disciplines. Another limit is the ineffective management of duplicates which could overestimate the real size of the catalogue (Hull, 2010).
In order to remedy this problem, a sample of documents was extracted from Mendeley to analyse the properties of their documents and their origin. In this way, several neutral and broad queries (i.e. a, the, and) were launched. English terms were used because this is the principal communication language in Science and these terms would retrieve the largest sample possible. In total, 902,659 documents were extracted from Mendeley’s public catalogue.
In addition to the items uploaded by the users, Mendeley extracts bibliographic data from other important sources. Table 4.1 presents the ten most relevant sources that feed into this database. Only 1.7 per cent of documents have no sources, which it could correspond to materials supplied by individual users or sources without publisher. The principal sources for the catalogue are PubMed (18 per cent), Scopus (1.2 per cent) and ScienceDirect (0.6 per cent). The first is a bibliographic database specializing in biomedical documents and the last a citation index and web publishing platform, products owned by Elsevier. This could be due to the agreement between Mendeley and Elsevier, according to which the publishing giant contributes references to the Mendeley catalogue. The rest are repositories (ArXiv.org, JSTOR) and specialized databases (ProQuest). This proportion of external sources coincides with the results reported by Hammerton, Granitzer, Harvey, Hristakeva, and Jack (2012).
Table 4.1
The ten most important sources in Mendeley
| Source | Documents | Documents % |
| PubMed (www.ncbi.nlm.nih.gov) | 162,399 | 17.99 |
| Scopus (www.scopus.com) | 10,699 | 1.18 |
| ScienceDirect (www.sciencedirect.com) | 5,146 | 0.57 |
| ProQuest (search.proquest.com) | 4,795 | 0.53 |
| Physical Review Letters | 3,666 | 0.41 |
| arXiv.org (arxiv.org) | 3,607 | 0.4 |
| Applied optics | 3,554 | 0.4 |
| JSTOR (www.jstor.org) | 3,439 | 0.38 |
| Tetrahedron Letters | 2,310 | 0.25 |
| Optics Letters | 2,152 | 0.24 |
| Total | 902,659 | 100 |
With regard to the type of document, Mendeley defines several document types according to the fields that each record contains. For example, the number and type of fields for a thesis are different to those of a journal article. Thus Table 4.2 shows the principal document types. The first three – journal, generic and journal article – correspond to the common journal article, summing up 85 per cent of the type of documents in Mendeley’s catalogue. The rest of the materials have a low presence though it is just worth commenting on Conference Proceedings (6.1 per cent). These results show the hegemony of the journal articles and the marginal existence of the other formats in the current scientific publishing world.
Table 4.2
Catalogue items distributed according to type of document in Mendeley
| Type | Documents | % documents |
| Journal | 582,494 | 64.77 |
| Generic | 121,526 | 13.51 |
| Journal Article | 62,602 | 6.96 |
| Conference Proceedings | 55,185 | 6.14 |
| Case | 42,265 | 4.70 |
| book_section | 12,551 | 1.40 |
| Book | 5,152 | 0.57 |
| Report | 4,176 | 0.46 |
| Thesis | 3,622 | 0.40 |
| Newspaper Article | 2,907 | 0.32 |
| Patent | 2,786 | 0.31 |
| Magazine Article | 1,880 | 0.21 |
| WebPage | 1,414 | 0.16 |
| working_paper | 463 | 0.05 |
| Bill | 173 | 0.02 |
| EncyclopediaArticle | 133 | 0.01 |
| Total | 899,329 | 100 |
Mendeley’s crowdsourced catalogue is organized around 25 research disciplines and 473 subdisciplines. This classification scheme represents a conceptual structure that not only serves to organize the bibliographic references, but is present in the arrangement of groups and profiles as well. These subject classes come from the Online Computer Library Center (OCLC), a consortium of libraries assembled to reduce costs and improve access to information.
Mendeley uses a peculiar criterion to assign papers to these subject classes. This process is made according to the readers of the documents. Thus a paper is not assigned to a discipline by its content, but by who its readers are. In this way a paper is classified as Mathematics if the highest percentage of its readers come from a Mathematics background. This would be correct if the paper had a large number of readers as it is logical that users would be interested in papers from their own research area. But for the majority of papers which barely reach ten readers (85 per cent), this criterion would produce a certain randomness and generate a serious problem of misclassification. This could mean, for example, that a paper published in a mathematics journal and tagged with mathematics keywords is assigned to Physics because a physicist user decided to include that reference in his or her library. Thus classification is influenced by the readers’ field of study, so as many users from a discipline read a paper more likely that paper is assigned to that disciplinary group. It is not surprising therefore that the thematic distribution of papers coincides with the distribution of users, as will be seen later. To avoid this limitation and increase the findability, Mendeley also links each document with the other two most frequent disciplines of their readers. For example, a paper assigned to Mathematics could be retrieved by Physics and Computer and Information Science as well due to the second and third group of readers belong to those disciplines.
Figure 4.1 and Table 4.3 show the percentage of retrieved, assigned and open papers by discipline, that is records that can be searched in the Papers section. Retrieving documents by discipline, the aggregated total is 66.2 million. As we saw above, this number is arrived at because the same paper can be linked to up to three disciplines. Taking only the principal discipline, the total number of uploaded papers by the users to the public catalogue is 14.7 million documents, a percentage rather low according to the global estimate of 114 million in the system (Pimasoli, 2014). This could indicate that approximately nine out ten documents are privately managed in each user’s library, a figure that is not very optimistic for the sharing of documents in Mendeley.

Table 4.3
Distribution of papers and open papers by discipline in Mendeley
| Discipline | Retrieved papers | % retrieved papers | Assigned papers | % assigned papers | Open papers | % open papers | Open ratio % |
| Arts and Literature | 740,576 | 1.12 | 148,902 | 1.01 | 34,558 | 1.11 | 4.67 |
| Astronomy/Astrophysics/Space Science | 464,153 | 0.70 | 74,511 | 0.50 | 17,413 | 0.56 | 3.75 |
| Biological Sciences | 11,220,236 | 16.95 | 3522,515 | 23.84 | 663,696 | 21.38 | 5.92 |
| Business Administration | 1,430,541 | 2.16 | 431,770 | 2.92 | 53,615 | 1.73 | 3.75 |
| Chemistry | 3,795,153 | 5.73 | 807,677 | 5.47 | 148,844 | 4.79 | 3.92 |
| Computer and Information Science | 3,895,713 | 5.88 | 1180,377 | 7.99 | 176,015 | 5.67 | 4.52 |
| Design | 464,982 | 0.70 | 110,229 | 0.75 | 17,349 | 0.56 | 3.73 |
| Earth Sciences | 1,867,589 | 2.82 | 512,748 | 3.47 | 80,798 | 2.60 | 4.33 |
| Economics | 1,146,552 | 1.73 | 280,521 | 1.90 | 48,207 | 1.55 | 4.20 |
| Education | 1,670,102 | 2.52 | 398,967 | 2.70 | 89,898 | 2.90 | 5.38 |
| Electrical and Electronic Engineering | 2,212,595 | 3.34 | 459,164 | 3.11 | 63,513 | 2.05 | 2.87 |
| Engineering | 5,019,852 | 7.58 | 1,070,536 | 7.24 | 171,058 | 5.51 | 3.41 |
| Environmental Sciences | 2,734,764 | 4.13 | 79,649 | 0.54 | 151,809 | 4.89 | 5.55 |
| Humanities | 888,296 | 1.34 | 154,245 | 1.04 | 50,129 | 1.61 | 5.64 |
| Law | 246,379 | 0.37 | 44,579 | 0.30 | 11,575 | 0.37 | 4.70 |
| Linguistics | 379,322 | 0.57 | 99,724 | 0.67 | 15,977 | 0.51 | 4.21 |
| Management Science / Operations Research | 1,087,499 | 1.64 | 263,046 | 1.78 | 50,509 | 1.63 | 4.64 |
| Materials Science | 1,865,872 | 2.82 | 328,969 | 2.23 | 53,416 | 1.72 | 2.86 |
| Mathematics | 971,295 | 1.47 | 206,470 | 1.40 | 45,183 | 1.46 | 4.65 |
| Medicine | 14,095,009 | 21.29 | 2,141,119 | 14.49 | 698,024 | 22.48 | 4.95 |
| Philosophy | 444,741 | 0.67 | 90,125 | 0.61 | 19,352 | 0.62 | 4.35 |
| Physics | 2,980,905 | 4.50 | 649,394 | 4.39 | 110,038 | 3.54 | 3.69 |
| Psychology | 2,921,248 | 4.41 | 889,509 | 6.02 | 135,438 | 4.36 | 4.64 |
| Social Sciences | 3,164,958 | 4.78 | 703,412 | 4.76 | 167,333 | 5.39 | 5.29 |
| Sports and Recreation | 491,665 | 0.74 | 128,317 | 0.87 | 31,182 | 1.00 | 6.34 |
| Total | 66,199,997 | 100 | 14,776,475 | 100 | 3,104,929 | 100 | 4.69 |

According to assigned papers, the research areas with highest representation are Biological Sciences (23.8 per cent), Medicine (14.5 per cent) and Engineering (7.2 per cent). These proportions are a little different according to open papers. Thus Medicine contains 22.5 per cent of open documents, Biological Sciences 21.4 per cent and Computer and Information Science 5.7 per cent. In total, only 3.1 million articles (4.7 per cent) are open access. However, this definition only includes articles published in open journals. Mendeley allows authors to deposit a full-text copy of any paper in their personal profile, which is accessible to registered users only. Therefore, if these copies were considered ‘open’, the proportion of open articles would be higher. In any case, regarding to the rate of open/not open articles per discipline, Sports and Recreation (6.3 per cent) show the highest proportion, followed by Biological Sciences (5.9 per cent) and Humanities (5.6 per cent), whereas Electrical and Electronic Engineering (2.9 per cent) and Materials Science (2.9 per cent) are the disciplines with less open papers.
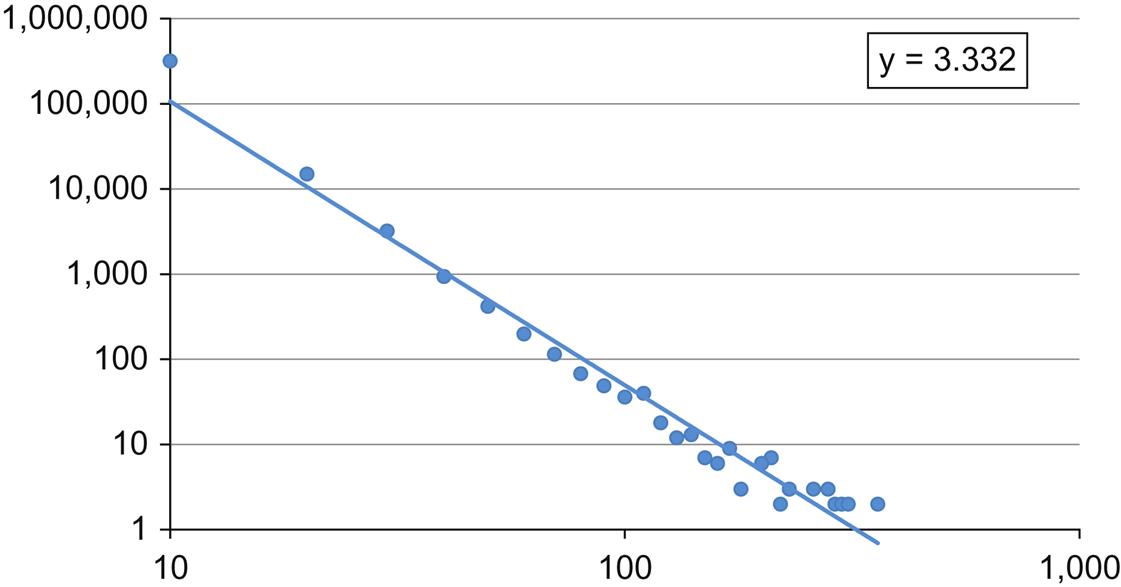
Mendeley introduces an original indicator to measure the quality of a paper in its catalogue. ‘Readers’ is the number of times that a document has been included in a personal library (Gunn, 2013). In this way, Mendeley assumes that if a paper is referenced in a personal library then it could mean that the paper is valuable for that user. Thus, as more papers are used in a personal library, the higher the quality and the more appreciated they are by the scholarly community. However, this assumption cannot be related to citation impact, firstly because a paper included in a library does not directly mean that it has been read, and secondly, the inclusion of a paper in a library is not always motivated by impact or quality reasons (Mohammadi, Thelwall, & Kousha, 2015a). Another problem is that the population distribution affects the readership of papers. Thus a paper is more likely to be read by a numerous type of user (e.g. students, Americans, etc.) than by other groups. Even so, this statistic is a good indicator of the use of these documents by the members’ network, supplying information on the status, discipline and location of their readers.
Apart from the meaning of this index, Figure 4.2 plots the power law distribution of the number of readers by research paper. From the sample 190,559 (21 per cent) papers do not have any reader or their readers ‘are being calculated’. This figure shows a markedly skewed distribution (γ=3.49) where a very large proportion of papers is read by just one or two users. In fact, half of the papers have less than two readers and 85 per cent have less than ten, with an average of 5.4 readers per document. These results show that most of the papers pass unnoticed by the scholarly community and only a small fraction of papers causes any impact in the population in terms of readership.

However, this fact raises some doubts about the disciplinary classification of documents. As has been seen, half of papers are read by less than two users, which means that half of the papers are classified only by the subjective opinion of one or two users. This can produce a very random assignation procedure and is an important weakness in the classification system.
4.1.3 The Social Network
The structural participation framework of Mendeley is set up by three key elements: individual users through profiles, collective users through groups, and the tags as instrument of information organization.
4.1.3.1 Tags or Keywords?
It could be said that tags are reminiscent of the social bookmarking sites, where they were key elements in the thematic structuring of content. From a certain viewpoint, they represent traces of the several loans that Mendeley makes from previous academic social sites to configure its web service. However, the role of tags in Mendeley is not so important as in CiteUlike and BibSonomy. In Mendeley, documents are classified beforehand following a structural scheme, and the tags are used simply as navigational tools that broaden the retrieval possibilities of the system. In addition, many of these tags are automatically added from the author’s keywords, so analysis of these labels would result in confusion as it is not easy to distinguish between users’ tags and authors’ keywords. A recent analysis found 6.13 tags per document with a median of 3 in computer science articles (Pimasoli, 2014). These results describe an elevated ratio of tags, despite the majority of them being supplied by the author him or herself.
4.1.3.2 Profiles, the Students’ Network
Besides being a reference management tool, Mendeley also acts as a document sharing site. This means that each user can upload their own publications to be read and downloaded by the rest of members. However, this functionality causes some confusion because many users consider that section to be a personal library as well, and they post no authored papers. It is not possible to know how often this is the case, but it could influence further comparisons with other document sharing sites. Each profile contains identification data such as affiliation, location and discipline. This last is mandatory when a profile is created, as well as the academic position. In addition, the profile shows several statistics that describe the performance of the profile in the network. Thus the number of publications is the number of documents uploaded to the profile, while ‘Readers’ refers the number of users that have included some paper from that profile in their libraries. Other indicators (followers/followings) describe social interactions with other users following the updates of their profiles with new papers and other activities. Each profile is informed of this activity through a Dashboard, where he or she is alerted to the recent activity of their followers and groups.
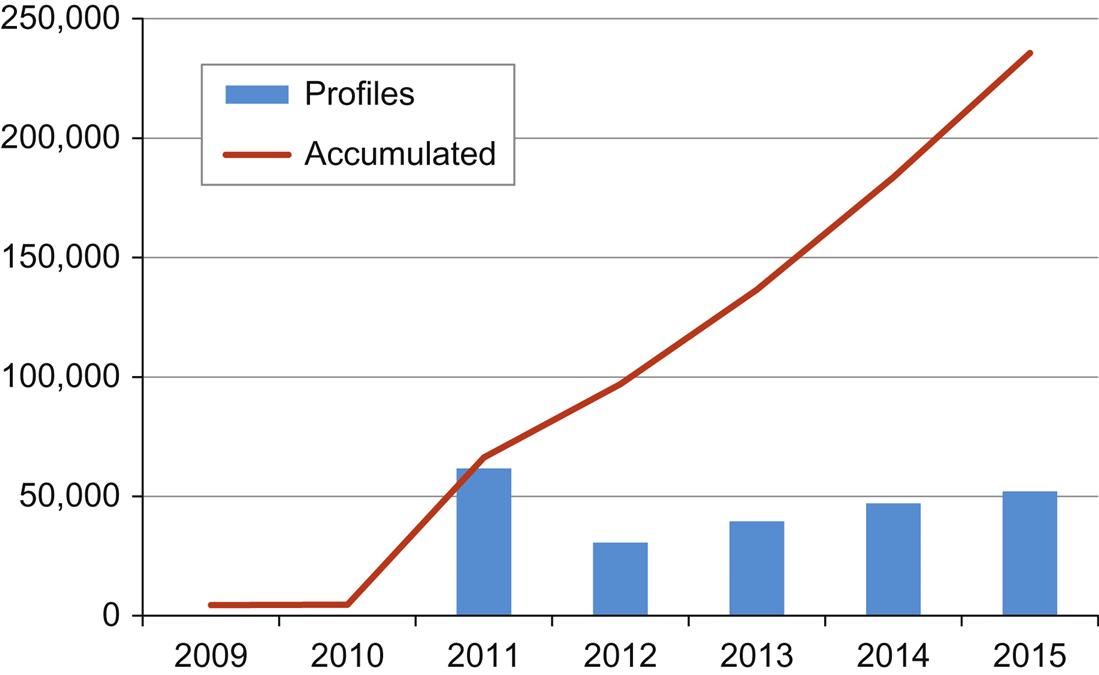
Figure 4.3 shows the evolution of the number of users in Mendeley since 2009. The WayBack Machine of Archive.org and the Mendeley blog were used to extract the more approximate figures. The addition of users to Mendeley follows a linear trend with an average annual growth (CAGR = 63 per cent) since 2009. The incorporation of new profiles is similar each year, while the addition of new users following a pause in the rate may be noted, and the 2011–13 period shows a mild deceleration. In this sense, although Mendeley increases its members each year, the rate is rather slow and this could be due to signs of exhaustion.

A more detailed analysis of Mendeley’s profiles was carried out to study the disciplinary, geographic, institutional and academic post distribution of its users. Mendeley has a search interface to find other colleagues and follow them. However, this mechanism is rather rudimentary and only retrieves profiles with an exact match and is lacking in wildcards or other types of operators. In addition, it only indexes the names of the profiles, so it is not possible to obtain profiles by affiliation, location, discipline, etc. Thus, to extract a representative and random sample of profiles, more than 3,000 of the most frequent names in the world were selected to query the system. In total, 1,029,998 profiles were retrieved from Mendeley in May 2015, a very large sample that could well be a quarter of the total number of profiles created in the system (four million approximately) (Mendeley blog, 2015).
From a disciplinary view, the distribution of profiles and their publication in Mendeley is quite similar to the distribution of papers and groups. This brings together the document coverage and the users’ population and suggests that the taking up of these sites is affected by the contents that are generated in them. Figure 4.4 shows that the network is mainly populated by users from Biological Sciences (16 per cent), Medicine (12 per cent) and Computer and Information Science (10 per cent), a distribution very similar to the distribution of papers in the catalogue. According to the publications of these profiles, Biological Sciences (20 per cent) is still the research area that posts most papers, followed by Medicine (13 per cent) and Computer and Information Science (13 per cent). This is influenced by the number of profiles, which determines the number of publications. However, the rate of publications per profile presents a different figure. Now, it is Physics (2.69) that is the discipline posting the most publications host, along with Material Science (2.05) and Earth Sciences (1.8). This proportion is closer to the usual average of papers by disciplines observed in other academic social sites (Ortega, 2015) and scientific databases (Ioannidis, Boyack, & Klavans, 2014; Ruiz-Castillo and Costas, 2014).

From the sample, only 141,895 (13.7 per cent) users include publications in their profiles, which demonstrates that the possibility to share documents in Mendeley is not entirely utilized by all users. As was said above, Mendeley is somewhat confusing according to the publications that are listed in the profiles, because some users include not authored papers by themselves, thinking that it is an extension of their personal library. Figure 4.5 plots the number of users against the number of papers. The distribution shows a skewed trend (γ=2.61) in which a large proportion of users publish a small number of papers, while only a small group of members post a large number of publications. Thus, only 20 per cent of users upload more than ten papers and just 152 profiles post 500 papers, the limit for uploading papers in each profile. The average number of papers is 24.9 per user.

Similar behaviour describes the distribution of followers by profiles, although the exponent (γ=3.33) in this case is more pronounced (see Figure 4.6). This means that the imbalance in the number of followers is even more so among the users of Mendeley. Thus 692,275 (67 per cent) profiles do not have any followers and from those remaining, 94 per cent have less than ten followers. However, only two profiles have more than 1,000 followers. The average of followers in Mendeley is around 1. This indicator of social networking informs us that the Mendeley network is still sparse and only a small number of users are following the careers of other members. This could be due to several facts. The first is that this tool was only recently introduced (Mendeley blog, 2014), and it is possible that many users are not yet using this method of detecting profile updates. Another reason could be related to the availability of this site as a document sharing service and, as has been seen before, this function is not widely used. Therefore, if there are many profiles with no papers or with just a couple, it is logical to conclude that most of the users do not use it to follow other profiles in the network.
Mendeley also makes it compulsory to enter the academic status of its users. Although this information is not present in the profiles, it is indeed visible in the page results when profiles are searched. Following the procedure above, 1.6 million academic statuses were collected from the retrieved profiles. Figure 4.7 shows the distribution of profiles by academic status. The most frequent categories are Student (Bachelor) (21.1 per cent), Student (Master) (20.7 per cent) and Ph.D. Student (15.7 per cent). It is evident that Mendeley is mainly taken up by students (57.5 per cent) that are starting their academic careers. Many of them are involved in doctoral dissertations which demand bibliographic tools such as Mendeley to obtain in-depth knowledge of the current literature in their respective research areas. This distribution, biased towards young and starting scholars, could affect the ‘Readers’ indicator, as noted above. In this way, the likelihood that a paper is read by a student is more than 50 per cent, so it is not surprising that this type of scholar is reading the most documents in Mendeley (Mohammadi, Thelwall, Haustein, & Larivière, 2015b) and that this platform is preferred by students (Jordan, 2014).

From the sample, only 85,713 (8 per cent) users included their affiliation in their profiles, so the institutional representation could be biased and not representative of the entire population in Mendeley. Even so, the organizations with the most profiles are the Universidade de São Paulo (0.56 per cent), the Universidad Nacional Autónoma de México (0.45 per cent) and the University of Cambridge (0.41 per cent), that is large universities in terms of the number of academic staff (see Table 4.4). It is also interesting to note that among the first ten institutions there are four British universities so it is possible that this service, which is headquartered in London, is preferred by British academics. According to the number of publications, the French CNRS (0.44 per cent) and the British University of Oxford (0.21 per cent) and University of Cambridge (0.2 per cent) are the institutions with the most papers posted in Mendeley.
Table 4.4
The ten organizations with the most users in Mendeley
| Affiliation | Profiles | Profiles % | Publications | Publications % |
| Universidade de São Paulo | 477 | 0.56 | 1,782 | 0.17 |
| Universidad Nacional Autónoma de México | 384 | 0.45 | 1,746 | 0.17 |
| University of Cambridge | 350 | 0.41 | 2,097 | 0.20 |
| Imperial College London | 318 | 0.37 | 1,485 | 0.14 |
| Stanford University | 297 | 0.35 | 1,110 | 0.11 |
| University of Oxford | 291 | 0.34 | 2,256 | 0.21 |
| Harvard University | 290 | 0.34 | 1,509 | 0.14 |
| University of Edinburgh | 239 | 0.28 | 872 | 0.08 |
| CNRS | 236 | 0.28 | 4,639 | 0.44 |
| Pennsylvania State University | 220 | 0.26 | 646 | 0.06 |
| Total | 85,713 | 1,055,752 | 100 |

Exploring the distribution by country, 144,721 (14 per cent) users included location in their profiles, a proportion rather high in comparison with sites analysed previously (see Table 4.5). Nevertheless, this proportion casts serious doubt on the readers’ statistics at country level as they may not be representative enough (Haunschild, Bornmann, & Leydesdorff, 2015). The countries with the most profiles in the network are the United States (22.5 per cent), followed far behind by the United Kingdom (9.7 per cent) and Brazil (6.7 per cent). With regard to publications, the United States (9.4 per cent) and the United Kingdom (5.1 per cent) are still the countries with highest number of contributions, followed by Spain (3.8 per cent) and Germany (3.4 per cent). According to the degree of penetration, Mexico (3.3) and the two principal Portuguese speaking countries, Portugal (3.3) and Brazil (3.3), are the countries where Mendeley is most successful, followed by the United Kingdom (2.6), the country where this platform is located. The Country Spreading, the percentage of users among the first ten countries, is 63 per cent, the lowest percentage of the sites analysed and shows that this service has reached global diffusion.
Table 4.5
The ten countries with the most users and publications in Mendeley
| Country | Profiles | % profiles | Publications | % publications | Penetration |
| United States | 32,502 | 22.46 | 98,886 | 9.37 | 1.21 |
| United Kingdom | 14,099 | 9.74 | 53,322 | 5.05 | 2.62 |
| Brazil* | 9,725 | 6.72 | 24,715 | 2.34 | 3.27 |
| Germany | 8,987 | 6.21 | 35,944 | 3.40 | 1.24 |
| Spain | 6,931 | 4.79 | 39,604 | 3.75 | 2.48 |
| Canada | 5,331 | 3.68 | 17,079 | 1.62 | 1.58 |
| France | 3,840 | 2.65 | 26,950 | 2.55 | 0.72 |
| Portugal | 3,526 | 2.44 | 9,490 | 0.90 | 3.29 |
| India* | 3,421 | 2.36 | 8,246 | 0.78 | 0.83 |
| Mexico | 3,276 | 2.26 | 6,425 | 0.61 | 3.31 |
| Total | 144,721 | 100 | 1,055,752 | 100 |

*2010.
4.1.3.3 Groups, the Readers’ Club
The third instrument of social participation in Mendeley is groups. These aim to gather together different users to compile specific bibliographies on determined issues or to gather working materials for projects or research groups. In addition to adding references, members’ groups can also discuss, rate and comment on these references or another issue.
Table 4.6 and Figure 4.8 show the distribution of groups and the number of papers included in these groups by research discipline. In April 2015, Mendeley counted 97,857 (138,387 by discipline) public groups that might be assigned to several disciplines. The private groups are only visible to their members, so the number of private groups is unknown. Since 2011, the growth of groups has been exponential, with an annual increase of CAGR =74 per cent (Jeng, He, Jiang, & Zhang, 2012). The thematic distribution of public groups is similar to the number of documents in the public catalogue. Thus the disciplines with the most groups are Biological Sciences (17.3 per cent), Medicine (12.9 per cent) and Computer and Information Science (12.7 per cent). According to the number of papers, 4.6 (5.7 by discipline) million documents were posted to these groups. This means that 31.3 per cent of the papers in the catalogue were shared in groups, which is an appreciable amount. No disciplinary differences exist when it comes to posting papers to the groups, so Biological Sciences (23.6 per cent) is the discipline with most posted papers, followed by Medicine (12.8 per cent) and Computer and Information Science (9.7 per cent). However, there are indeed differences in papers by group rate. The most active disciplines uploading papers are Environmental Sciences (60.1 papers by group), Linguistics (59.5 papers by group) and Biological Sciences (56.5 papers by group). Finally, the number of members that joined up to a group is 275,266, approximately 6.8 per cent of the global community of users (Mendeley blog, 2015), a proportion a little above the 5.7 per cent found by Oh and Jeng (2011). This proportion of users interested in groups is the lowest percentage observed and shows that this functionality is not attractive for most of the users.
Table 4.6
Distribution of groups, members joined and papers posted to groups by research discipline in Mendeley
| Disciplines | Groups | Groups % | Papers | Papers % | Papers/group | Members | Activity |
| Arts and Literature | 1,848 | 1.34 | 67,855 | 1.18 | 36.7 | 6,718 | 10.10 |
| Astronomy/Astrophysics/Space Science | 776 | 0.56 | 23,128 | 0.40 | 29.8 | 2,005 | 11.54 |
| Biological Sciences | 23,955 | 17.31 | 1,352,650 | 23.59 | 56.5 | 57,814 | 23.40 |
| Business Administration | 5,060 | 3.66 | 98,970 | 1.73 | 19.6 | 16,334 | 6.06 |
| Chemistry | 5,740 | 4.15 | 222,369 | 3.88 | 38.7 | 13,698 | 16.23 |
| Computer and Information Science | 17,574 | 12.70 | 556,270 | 9.70 | 31.7 | 58,100 | 9.57 |
| Design | 1,734 | 1.25 | 46,001 | 0.80 | 26.5 | 6,769 | 6.80 |
| Earth Sciences | 3,143 | 2.27 | 174,742 | 3.05 | 55.6 | 9,908 | 17.64 |
| Economics | 3,122 | 2.26 | 37,565 | 0.66 | 12.0 | 6,485 | 5.79 |
| Education | 7,015 | 5.07 | 204,946 | 3.57 | 29.2 | 27,145 | 7.55 |
| Electrical and Electronic Engineering | 3,746 | 2.71 | 132,691 | 2.31 | 35.4 | 8,568 | 15.49 |
| Engineering | 11,849 | 8.56 | 368,304 | 6.42 | 31.1 | 24,273 | 15.17 |
| Environmental Sciences | 5,126 | 3.70 | 308,137 | 5.37 | 60.1 | 19,448 | 15.84 |
| Humanities | 2,430 | 1.76 | 118,346 | 2.06 | 48.7 | 10,337 | 11.45 |
| Law | 764 | 0.55 | 20,634 | 0.36 | 27.0 | 2,848 | 7.25 |
| Linguistics | 927 | 0.67 | 55,150 | 0.96 | 59.5 | 4,591 | 12.01 |
| Management Science/Operations Research | 2,255 | 1.63 | 104,594 | 1.82 | 46.4 | 11,194 | 9.34 |
| Materials Science | 2,542 | 1.84 | 114,878 | 2.00 | 45.2 | 6,769 | 16.97 |
| Mathematics | 1,294 | 0.94 | 47,455 | 0.83 | 36.7 | 7,440 | 6.38 |
| Medicine | 17,842 | 12.89 | 735,583 | 12.83 | 41.2 | 34,423 | 21.37 |
| Philosophy | 728 | 0.53 | 28,791 | 0.50 | 39.5 | 4,969 | 5.79 |
| Physics | 4,348 | 3.14 | 164,702 | 2.87 | 37.9 | 11,974 | 13.75 |
| Psychology | 7,358 | 5.32 | 269,886 | 4.71 | 36.7 | 21,119 | 12.78 |
| Social Sciences | 9,134 | 6.60 | 443,652 | 7.74 | 48.6 | 42,128 | 10.53 |
| Sports and Recreation | 1,147 | 0.83 | 37,491 | 0.65 | 32.7 | 2,865 | 13.09 |
| Total | 138,387 | 100 | 5,734,790 | 100 | 40.5 | 417,922 | 13.72 |


If we look at the characteristics of the groups themselves, Table 4.7 shows the ten most active groups. An average of 73 papers is included in each set, a rate lower than that observed in CiteUlike (106.3) and BibSonomy (87.3). In addition, the number of members by group (3.1) is rather low, being more than half of the groups (52 per cent) formed by only one member. These values are lower than the figures found by Oh and Jeng (2011), which suggests that participation in groups could increase with time. All these indicators lead us to think that the use of public groups in order to share references is not very frequent and would not attract the attention of many users. As with the case of social bookmarking tools, the typology of groups in Mendeley is quite varied and among the most active groups can be found journal sites (i.e. Zootaxa, the European Journal of Entomology) that upload their publications to be discussed and read by their members, projects that attempt to create a comprehensive database of references on a specific theme (i.e. Ocean Acidification (OA-ICC), Amphibian Species of the World) or simply places where the most recent updates and news on a research line may be found (i.e. Translation Studies, POLYMER_BASED NANOCOMPOSITES).
Table 4.7
The ten most active groups in Mendeley
| Group | Papers | Members | Activity |
| Zootaxa | 10,902 | 86 | 126.77 |
| Public Health England Obesity Knowledge and Intelligence – Knowledge Update | 6,326 | 50 | 126.52 |
| Amphibian Species of the World | 9,556 | 79 | 120.96 |
| Traductores e interpretes | 5,714 | 71 | 80.48 |
| Ecological Anthropology | 7,019 | 128 | 54.84 |
| Ocean Acidification (OA-ICC) | 2,471 | 51 | 48.45 |
| New Interfaces for Musical Expression | 2,281 | 59 | 38.66 |
| POLYMER_BASED NANOCOMPOSITES | 2,630 | 74 | 35.54 |
| European Journal of Entomology | 1,447 | 50 | 28.94 |
| Translation Studies | 6,336 | 250 | 25.34 |
| Total | 4,597,979 | 190,935 | 8.20 |
| Average | 73.02 | 3.09 | 26.27 |

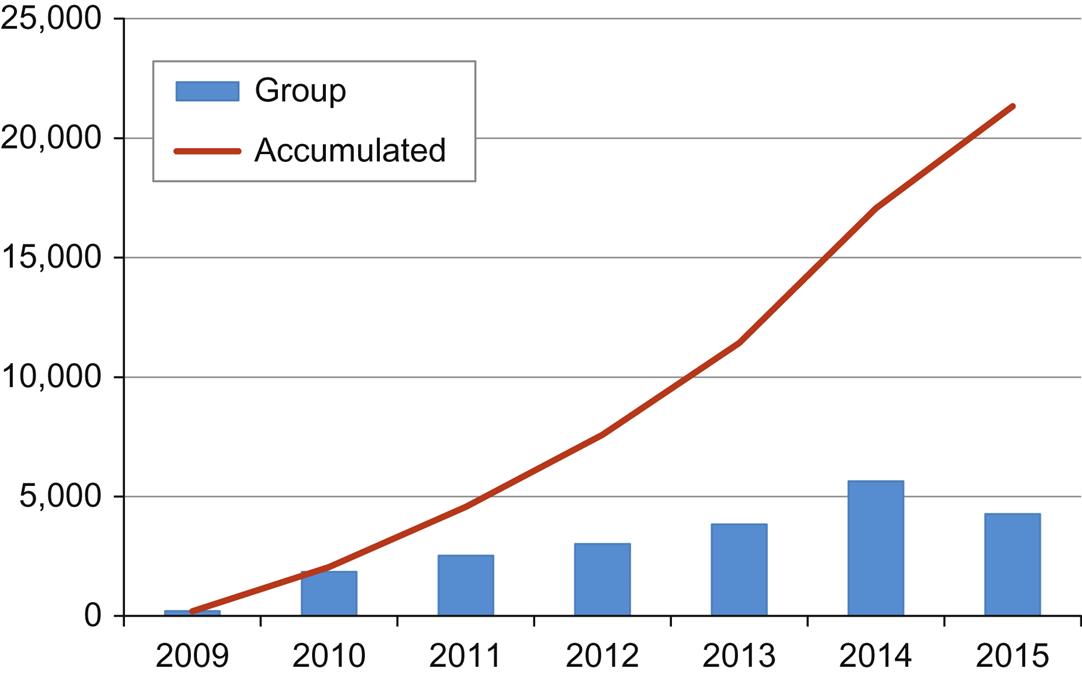
Figure 4.9 allows us to observe the evolution of the activity of these groups over the years. The accumulated line describes an ascending linear trend while the bars reveal a pause in growth. Only 38 per cent of the groups have developed some activity (i.e. posting a paper, inserting a comment) since 2014. This growing pattern provides evidences that although the number of groups is small and the activity is not much higher, a considerable proportion of groups do have a current activity. However, this does not hide the fact that 62 per cent of the groups are losing activity and freshness.

4.1.4 Discovering Recommended Papers
Mendeley is the most well known of the current reference management services due to its success in terms of the number of users – more than four million in 2015 – and, above all, the way in which it has been able to combine a management service of scientific literature with a social network. One of the key strengths of this service is the large and complete database of public bibliographic references, with more than 14 million items available for any user. This fact is not only important in meeting the demands of Mendeley’s users, but it also turns it into an important information service comparable to any academic search engine or document sharing system. One might say that Mendeley could become a complete academic site because it is offering several services on the same platform. In this sense, Mendeley has developed from reference management software to become a social bookmarking site with document sharing possibilities and a searchable bibliographic database.
However, this strategy is not giving the expected results in many respects. Mendeley’s social network is sparse and weak in comparison with other sites that have been analysed. The average of followers (1.1) points out that the connectivity between users at the individual level is very small and the linear annual growth rate (CAGR=63 per cent) of new users also evidences a slowing down of Mendeley’s community. On the other hand, the percentages involved in filling out profile information (>14 per cent) and the interest in uploading papers (13.7 per cent) give evidence that many users are not registered in Mendeley to share articles or establish personal contacts. Similar underperforming values were observed with regard to groups. Only 6.8 per cent of users are enrolled in groups with a ratio of 3.1 members per group, and just 38 per cent of these groups have posted any document since 2014. In addition, 31 per cent of the documents in the system are included in groups. This low participation in groups interacting directly with other users suggests that Mendeley is used more as an information source than as a networking site. The recent survey by Nature has already suggested this may be the case, uncovering the fact that the main use of the site is to ‘discover recommended papers’ (Van Noorden, 2014). Other surveys have also confirmed that contacting other users is the last reason to use Mendeley (Deakin, 2014; Jeng, He, & Jiang, 2015). These results validate the hard engagement of reference management tools with social networking environments, as we have already commented on at the beginning of this chapter. Thus, the purpose of the users in these platforms is firstly to organize their own libraries and then to take advantage of the information resources available in the platform. However, as a recommended source of information this utility could be questioned as well, because whether not there is a dense and active network of users posting and reading papers, it is hard to see that these recommendations have value. The fact that 60 per cent of papers have none or less than two readers is a serious problem of trust in Mendeley as an article recommendation service.
Finally, in the demographic distribution of this user network, it could be concluded that Mendeley is mainly taken up by research students (57.5 per cent) from the United States (22.5 per cent) and the United Kingdom (9.7 per cent), and where biologists (16 per cent) and biomedicine (12 per cent) researchers predominate. This distribution confirms that the potential users of a reference management tool are young scholars starting their scientific careers who need a powerful instrument to organize their working bibliographies at the same time as they need to be updated on current literature (Jeng et al., 2015). This broad geographical and thematic expansion of the service demonstrates that the platform has been consolidated into the scholarly community as an example of Science 2.0 bibliographic tools.
4.2 Zotero
Zotero is a reference management tool whose particular attraction is that its code is open. It was started by Dan Cohen, Josh Greenberg and Dan Stillman of the Center for History and New Media of George Mason University in October 2006. In 2008, Zotero was sued by Thomson Reuters based on the claim that Zotero can convert EndNote’s proprietary styles into open citation ones. However, in 2011, Thomson Reuters withdrew the lawsuit. This fact was considered an example of the attempt of the publishing industry to limit open software initiatives and the free sharing of bibliographic information (Nature, 2008).
The platform started as an add-on for Mozilla Firefox, an open-source web browser (Cohen, 2008). With the correct mechanism into that navigator, Zotero could identify and extract any citation (bibliographic references, websites, books, etc.) that were present in a web page and then store it in a personal library (Puckett, 2011). Unlike other reference management tools or bookmarking sites, Zotero allows the capture of any material: images, videos, snapshots, etc. On top of this, it was possible to include and associate other files to those references (i.e. pdfs, images, links), becoming that library in a personal organized repository. Zotero permits notes, comments and tags to be added to references, which increases their findability and improves the content of each record.
In 2006, it also incorporated different export formats, enabling the collection and export of items in BibTex, CSL JSON, RIS, RefWork and other important formats (Ritterbush, 2007). In addition, Zotero accepts records from Thomson ISI, PubMed, Medline and CrossRef. In 2007, Zotero could be integrated with word processors such as Microsoft Word, OpenOffice and WordPress. This made the insertion of citations and the generation of bibliographies easier. In addition, through the Citation Style Language (CSL), it was possible to build and design any citation style. At the last version, in January 2011, Zotero became Zotero Standalone, a desktop suite independent from the web browser, allowing the collection of references on one’s own computer.
4.2.1 References in the Cloud
Zotero incorporated Zotero Server in 2009, a mechanism that makes it possible to create a copy of the user’s library in the central server of the organization. This allowed access to this library to be synced from several devices and this content to be shared with other users. In this form, Zotero created its social networking functionalities, specifically groups and profiles, with dissimilar developments.
4.2.1.1 Profiles, Just a Calling Card
Profiles in Zotero only contain basic information to identify each user, with data on affiliation, location, followers/followings and disciplines. It also includes links to access users’ libraries and make contact possible between them through internal messages. However, the access to these personal libraries is optional and only a small number of users keep their libraries open source (4 per cent). This makes it impossible to know how many documents are posted in the system. In total, it is estimated that Zotero has no more than 130,000 registered users in May 2015, a figure quite low in relation to other academic sites. This estimation was obtained by extracting the list of profiles from the main page in an iterative process until only duplicated profiles may be extracted.
Zotero is one of the sites that is the most harmful to spam profiles. Some social sites are utilised to insert advertisements or links to increase the visibility of certain websites, improving the ranking of those websites fraudulently when they are searched, for example, in Google. In the case of Zotero, 2,787 (2.1 per cent) profiles were identified as fake users, whose sole purpose was to include links to, for example, online pharmacy stores, real-estate advertisings and escort offers. These users do not carry out any action in the system, but simply make use of the high PageRank of the site to promote their businesses. This is a serious problem because it distorts the normal functioning of the network and affects the statistical analysis of this site.
Not all the profiles are assigned to a discipline and then only 88,455 (68 per cent) profiles were classified using Zotero’s own scheme. This system is based on the classification of academic disciplines published in Wikipedia (2015) to thematically organize a user’s profile. The scheme covers all the academic disciplines and is arranged in five main classes. However, this system has several weaknesses. The first is that there are complaints of constant and arbitrary modifications with the removing and renaming of disciplines and the allocation of new categories which produce serious instability. Another specific problem is that it divides academic disciplines and professions, splitting related categories into separate parts. In addition, some disciplines are misclassified such as Archeology and Anthropology which are included in Social Sciences. Perhaps due to this, Zotero only takes the main categories without any hierarchical relationship. In any event, this scheme contains five principal classes that make possible the grouping of Zotero’s categories. These classes have been re-adapted to make possible further comparison with other social sites.
Figure 4.10 shows the percentage of users by the six principal research areas. As we have been seen before, only 68 per cent of users fill in this information in their profiles. The figure shows that Zotero is unbalanced towards social scientists (33.8 per cent) and humanists (27.6 per cent), whereas physicians (6.1 per cent) and natural scientists (i.e. chemists, biologists) (11.4 per cent) present percentages that are way below their usual representation in other social sites and databases. Therefore, it can be assumed that this population is not thematically homogeneous, being biased towards Human and Social Sciences content.

According to the distribution of profiles by organization, Zotero describes a similar pattern to that observed with BibSonomy (see Table 4.8). The university with most profiles is the George Mason University (0.9 per cent), the place where this software was created. Walden University (0.7 per cent), a small university in Minnesota, comes second in terms of the number of profiles a surprising fact that could be explained by the strong support that this university’s library offers to Zotero, publishing an online user guide (Walden University, 2015). As a result of this the students and professors massively use this platform. The remaining universities are common organizations in these distributions, such as the Universidad Nacional Autónoma de México (0.58 per cent) and the University of Washington (0.5 per cent).
Table 4.8
The ten organizations with the most profiles in Mendeley
| Affiliation | Profiles | % profiles |
| George Mason University | 519 | 0.91 |
| Walden University | 407 | 0.71 |
| Universidad Nacional Autónoma de México | 331 | 0.58 |
| University of Washington | 287 | 0.50 |
| University of California, Los Angeles | 236 | 0.41 |
| Harvard University | 236 | 0.41 |
| University of California, Berkeley | 235 | 0.41 |
| University of Toronto | 222 | 0.39 |
| CNRS | 212 | 0.37 |
| University of Michigan | 201 | 0.35 |
| Total | 56,949 | 100 |
Grouping profiles in terms of countries, Table 4.9 confirms the massive presence of American users – to half of the users come from the United States (43.5 per cent), followed far behind by the United Kingdom (6.2 per cent) and Canada (3.8 per cent). In addition, the United States is the country with the highest penetration index (2.35 per cent), which confirms the local nature of this service. Australia (2.32 per cent) is the second country according the penetration index, suggesting that this utility has a mean spread across Anglo-Saxon countries. However, it is necessary to take into account that these countries are the most infected by spam users, so these results could be distorted by that malicious practice. With regard to the Country Spreading index, Zotero is the second web space with the highest concentration of population in the first ten countries (69.3 per cent). This confirms the local nature of the site and its weak diffusion into other parts of the world.
Table 4.9
The ten countries with the most profiles in Zotero
| Country | Profiles | % profiles | % penetration |
| United States | 44,067 | 43.56 | 2.35 |
| United Kingdom | 6,257 | 6.19 | 1.66 |
| Canada | 3,803 | 3.76 | 1.61 |
| France | 3,500 | 3.46 | 0.94 |
| Australia** | 3,224 | 3.19 | 2.32 |
| Germany | 2,689 | 2.66 | 0.53 |
| India* | 2,151 | 2.13 | 0.74 |
| Spain | 1,939 | 1.92 | 0.99 |
| Brazil* | 1,313 | 1.30 | 0.63 |
| Mexico | 1,114 | 1.10 | 1.61 |
| Total | 101,164 | 100 | 100 |

*2010.
**2008.
Zotero allows users to follow the posting activity of other profiles, promoting the interaction and sharing of references between them. In this way, it is possible to know the number of followers that a profile has and the amount of profiles that are followed. In addition, this number could be considered an indicator of the network’s degree of connection and could be a measure of the strength with which the users interact among them. Figure 4.11 shows the distribution of followings and followers by profile. Because the sample is reduced, data were not binned. Both describe a very similar trend, with a slight higher slope for followings (γ=2.13) than for followers (γ=2.16). However, the proportion of profiles that do not follow anybody is 93 per cent and 89 per cent who do not have any followers. The average of followers is 2.2 while the average of followings is 3.5. These figures show that the Zotero network is quite sparse and only a small fraction of profiles have connections between them. This unrelated network could be explained because users’ libraries are not open in all cases and it is hard to follow a profile that just contains identification data. Another cause, no less important, is the high presence of spammer profiles which show no interest in connecting with other users.

Figure 4.12 shows the evolution of the number of profiles in Zotero since 2009, the moment in which this reference management tool incorporated the creation of profiles by part of their users. These data from 2009 onwards have been obtained from Zotero’s main page using the WayBack Machine of Archive.org. Since that date, the number of profiles has been steadily increasing up to the present (CAGR=76 per cent). The accumulated trend describes a linear growth, with a pause in the increase. Despite the peak in 2011, the incorporation of new users has grown at a very slow rate.
4.2.1.2 Groups, the Only Way of Sharing
In the manner of Mendeley, Zotero allows any user to create groups that share his or her own library with other members. Groups can be private or public. The former are confidential and only visible to members, while the latter are open to any users and allow the exploration of their content. Zotero lists 31,784 public groups in May 2015, of which 64 per cent are open to new members while 35.6 per cent are closed to new admissions.
Table 4.10 presents the ten most important groups in Zotero according to activity. There are 106,597 (82 per cent) users enrolled in these groups, making this the social site in the study with the highest proportion of users registered in groups. However, this figure may not be as high because users can participate in several groups. Despite this, this high proportion would suggest that most of the users only feel attracted to Zotero for its networking possibilities and not so much for its individual functions. However, the users by group rate (3.3) is not that high, which could mean that many of these groups are small. In fact, 41 per cent of these groups have only one member, which could confirm that many individual users are creating groups to share their collections more easily. Observing the number of items posted, these groups in total share around 2.5 million documents, a considerable number in view of the number of users in the system. In line with this result, the average of uploaded references per group (105) also shows that the usage of these groups is high and they contain a substantial amount of documents. This perception is confirmed by the activity ratio (40.8), the second highest value of the sites analysed.
Table 4.10
The ten most active groups in Zotero
| Name | Members | Items | Activity |
| First World War Studies Bibliography | 60 | 5,476 | 91.27 |
| New Orleans Studies UNO | 57 | 4,563 | 80.05 |
| EEA | 60 | 4,621 | 77.02 |
| LCENVS | 79 | 5,091 | 64.44 |
| H-Buddhism Bibliography Project | 135 | 8,298 | 61.47 |
| GEOgraphie urbaine, régionale et sociale-IGD | 63 | 3,141 | 49.86 |
| Schulfach Musik Literaturlisten | 58 | 2,885 | 49.74 |
| DigiPlay | 103 | 3,117 | 30.26 |
| Géographie-nouveautés BCU Lausanne | 109 | 2,516 | 23.08 |
| Lidilem | 96 | 2,178 | 22.69 |
| Total | 106,597 | 2,528,162 | 23.72 |
| Average | 3.35 | 105.43 | 40.82 |

If we look at Table 4.10 in more detail, different groups for distinct purposes may be found. There are groups created for gathering references related to defined research issues such as the First World War (First World War Studies Bibliography) or Buddhism (H-Buddhism Bibliography Project). These groups arise with the objective of building exhaustive bibliographies that support the research in those fields. Other groups are created as bibliographic instruments for specific institutions in their scholarly activity (i.e. GEOgraphie urbaine, régionale et sociale-IGD, LCENVS). It is interesting to notice that half of the most active groups are devoted to Humanities, which confirms the strong presence of researchers from this field of study.
Figure 4.13 shows the increase in the number of new groups since the creation of this tool in 2009. The line shows a constant growth from that moment, but in a paused form. Thus, from 2009 to 2014, groups have grown 60 per cent each year in average. This increase is in relation to the previous results, confirming that this collaborative tool enjoys good health and suggesting that Zotero’s users are employing this instrument to interact with other users and the system in general.

Figure 4.14 illustrates another way to look at the positive working of this tool. It shows the number of groups by the year in which users posted their last item. As with the previous figure, the trend maintains a pattern of growth and many of the groups describe recent activity. Thus, 34.6 per cent of the groups posted their last items in the period 2014–15, a similar percentage to Mendeley.
4.2.2 Open Source, Close Content
Zotero emerged into the panoply of reference management systems as a small plug-in designed for an open-source navigator, Mozilla Firefox, and was created to capture bibliographic references across the Web. Since those modest beginnings, this open-source tool has continued to grow and has now become Zotero Standalone, a complete platform that makes possible the storage of bibliographic references and the generation of different outputs (e.g. bibliographies, inserting citations, export/import items, etc.) which can be shared with other members through groups. The main attraction of Zotero is its open nature, and the code can be reutilised to implement upgrades and add new functionalities by a developer community. Another strong point is the acceptance of any type of materials, including video, images, audio, etc., which it converts into a multimedia solution to post talks and pictures (Watkins, 2013).
Nevertheless, Zotero lacks of one of the most important elements, not only for a reference management software but for any academic social site. It does not have a public and accessible bibliographic database that permits the browsing of the literature posted into the system. This critical failure means that the sharing of information resources between partners at the individual level is not possible. Unlike Mendeley, CiteULike or other bookmarking sites, Zotero does not publish a common repository from the libraries of their users, which prevents knowledge of what content is being posted to the platform. It is true that each private library may be open to be reused, but the percentage of users that open their collections is anecdotal (4 per cent). This affects the social engagement of the site because many profiles do not have anything to share or offer to the community. Thus the insignificant percentage of followers (11 per cent) and followings (7 per cent) could reflect a situation where paradoxically its greatest problem is the sharing of individual content.
This deeply limits the social networking possibilities of Zotero and leaves groups as the only collaborative tool. It is not surprising then that this platform describes the largest proportion of users registered in a group (82 per cent). It is possible that, faced with an absence of networking tools, users decide to set up groups to be able to share references and other materials. The activity level seems to confirm this assumption as the average of posted papers is one of the highest among academic social sites (105); the activity index (40.8) also presents elevated values and the percentage of update groups (34.6 per cent) is also very high. These indicators suggest that Zotero could be used not as a personal site to manage references, but as an exclusive environment to share references with other members previously defined. For example, partners in a project, colleagues from the same institution or students on the same course could resort to Zotero only for participating in groups.
However, one of the most dangerous scourges that a social website has to contend with today is perhaps the spammer profiles. These users act as a virus, utilizing the platform just to insert advertisements and links that promote their businesses in search engines and avoiding any participative action. Every social site has mechanisms to protect its members from malicious users, but it seems that Zotero does have the proper weapons to mitigate this harm. Although the proportion is not excessive (2.1 per cent), it is indeed significant and it could get worse.
As has already been seen with BibSonomy, Zotero also shows symptoms that its social platform has not taken off from the initial environment where it was born. Hence, Zotero remains a specialized service for social scientists (33.8 per cent) and humanists (27.6 per cent), and is limited to a small local environment in which the highest percentage of users come from its alma mater George Mason University (0.9 per cent) and where Americans form the greatest proportion of users (43.5 per cent) of all the academic social sites analysed. These data show that in the six years this social platform has been running, it has not been able to reach a wider audience both geographically and thematically, which demonstrates that the site has reached a standstill and raises some doubts about its future development.
4.3 Could a Reference Manager be a Social Site?
Reference management tools mark a further step in the evolution of scholarly social sites because they join the ability of organizing a collection of bibliographic references with the possibility of sharing them with other users. Unlike the social bookmarking sites, these new services are based on a hybrid system set up by a personal desktop application that organizes, edits and exports/imports the items included in each library itself, and a web platform that makes possible the sharing of these materials. This converts reference management software into a more advanced product because they are not only a site where references may be stored but software to utilize these items in bibliographies, citations, etc. As with social bookmarking sites, these spaces also aspire to become an important academic source of scientific information. For example, Mendeley contains more than 14 million records in its public catalogue, more than CiteSeerX, which turns it into a bibliographic example for the research community. This brings a great opportunity to compete in the market for academic search engines because these sites have the advantage of supplying usage metrics as well as social tagging, a complementary means for tracking the readership of the articles.
These products have evolved from the local environment of the personal computer to the social space of the web platform. This fact brings a critical challenge, because they have to fit these separate worlds together. Reference management tools, as bookmarking sites, look for the enrichment of their databases in the community through the posting of non-published and multimedia items, as well as making the most of the users’ activity when they tag (information management) and explore (usage indicators) their content. This would explain why these products jumped from the desktop to the Web. But it is not clear that this leap was demanded by their users. In other words, there are serious doubts whether their members take advantage of these social environments when they just want to manage their own libraries. Surveys on Mendeley – there are hardly any analyses on Zotero – have let slip that users are not interested in the social networking possibilities of this site (Deakin, 2014; Jeng et al., 2015; Van Noorden, 2014). The quantitative results of this study confirm and expand these findings. Mendeley has proved that there are few individual interactions (median followers =4), that their users barely share information and documents in their profiles (13.7 per cent) and that very few members set up groups (median =3.3). In the case of Zotero, the situation is even worse because only 4 per cent of users make their libraries accessible and the interaction rate is insignificant (11 per cent of users with followers). Groups in these platforms describe better health because they act as specialist forums where a reduced number of users (3 in average) compile bibliographies for a class, institution or society. In the case of Zotero, they are the only way to collaborate with other users.
This overview allows us to conclude that, from a social networking point of view, these platforms have not achieved the establishment of a compact and dynamic social community. It is true that the posting of references and the reading of these enriches the system, giving it a significant added value. But these possibilities do not mean that their users increase their collaboration, nor do they take advantage of participating in groups or following other colleagues. The attempt by Mendeley to create a document-sharing service could be a good initiative to energize these communities, and it could become a full academic site by integrating tagging, reference management, information retrieval and document sharing in the same location. Zotero, however, must reorganize its entire approach, creating a real open library of documents posted and giving more prominence to the interaction between users.