
Document Sharing Services
Abstract
This chapter is focused on the social networking places mainly oriented to the sharing of full-text scientific documents. The purpose of these platforms is to provide an incentive for open access to the scientific literature and to track the use of documents and profiles by the online community as a way to obtain metrics on the social impact of the academic output. ResearchGate and Academia.edu were chosen to detail how these services work, what type of documents are contained, where their users come from and which are the metrics that they develop. The results describe ResearchGate as a balanced network in disciplinary and country terms, with the largest full-text database and the most varied number of indicators. Academia.edu, on the contrary, is a service biased towards the Humanities and Social Sciences, with an important presence in developing countries and a reduced number of producers that feed the majority network of followers employing the service to be up to date on certain issues and disciplines.
Keywords
Academia.edu; Downloads; Followers; Impact Points; ResearchGate
The last step in the evolution of academic social sites, at least until today, are platforms focused on users’ own research production, being places where members are able to freely put at the disposal of the network’s members the results of their studies. This supposes, in many cases, an alternative method of publishing that makes easier the diffusion of scientific results such as technical reports, presentations, software scripts, etc., that earlier had remained hidden but which now can be discussed and appreciated by the research community. These platforms help many scholars to publish material such as doctoral dissertations, patent applications and data sets that in other times had no place in the academic publishing system. In short, these new sites are proposing a new and alternative way of spreading academic results.
Document sharing services are one step beyond academic social networking because their intention is not just to build scientific information systems through the sharing of references (reference management tools) and the tagging of documents (social bookmarking sites), which leads only to the creation of secondary sources. Furthermore, they are attempting to build an information service centre out of primary sources, the full-text documents uploaded by their members. In this way, social interactions are established, where the viewing, discussion and rating of these materials are the main form of contacting other users and following the updating of profiles and groups.
Technically, these systems permit statistics to be computed on the usage of the platform itself and all the elements that take part in the system. This makes it possible to monitor the performance of authors, documents and institutions and, perhaps most importantly, the definition of indicators that measure the impact of these entities in the scholarly community. One of the biggest attractions for the research community – and therefore one of the reasons for its success – is that users can assess and value the footprint of their research production on the network. Thus users can observe an alternative dimension of academic influence and discover a public environment in which their own performance may be compared with the entire community. These new metrics are causing a deep change when it comes to interpreting the meaning of research impact.
In this way, document sharing services bring together two key aspects of scholarly communication: on the one hand, motivated by a commitment to the open access movement, a space is provided where the free exchange of scientific results (Science 2.0) can be made transparent, direct and immediate; and on the other hand, there is a reward system based on metrics that measure the online impact of these contributions in the network. Unlike other types of platform, participation in this kind of network is limited to the ability to produce scholarly content. In previous services, users had unlimited capacity to post, bookmark or read any document that they desired to share with their community. However, in a document sharing service users are limited to just uploaded documents created by themselves.
This chapter focuses on two of the most popular and important document sharing sites for scholars. ResearchGate and Academia.edu are the two platforms that are the most attractive and where the most content is made available. The emerging growth of these sites, the novelty of depositing full-text documents and the building of an environment in which the research impact may be tracked are sufficient reasons to analyse in depth the way in which these platforms work and are being used.
5.1 ResearchGate
ResearchGate was launched by Ijad Madisch, Sören Hofmayer and Horst Fickenscher, a group of physicians interested in the scientific collaboration in Science 2.0 environments. They met at Harvard University and then they moved to Berlin where they founded the platform in 2008. As they claim, their principal mission is to put researchers in touch all over the world, making it easy to share documents and information between them as a way to promote scientific collaboration. In order to accomplish this objective, ResearchGate allows users to create a personal profile where they can elaborate a complete curriculum listing their academic outputs. These curricula could be enriched by uploading the full text of their publications in accordance with publishers’ permissions. In this way, ResearchGate acts as a personal repository where each user can promote and share their scientific results with the other members.
These profiles are connected with other colleagues in an endless number of ways that make easy the discovery and location of new partners and potential collaborators. Through organizations, topics and co-authors’ lists, users can built a network of contacts that allows them to follow the updating of their partners’ profiles as well as sharing opinions and criticisms on their research projects. All this is enriched with a battery of metrics at document, author and organization level that enables the interest that these entities provoke in the online community to be followed as well as the assessment of the performance of these objects in the network context. In addition, this platform introduces Questions & Answers, a participative tool where users can resolve the questions and doubts of other members and rate them, providing a good vehicle to increase interaction and promote collaboration among their members.
But perhaps the most interesting instrument is Open Review, a tool introduced in 2014 for the online review of uploaded documents. As a traditional peer review panel, ResearchGate selects from their users a couple of reviewers who argue the drawbacks and advantages of certain papers as well as determine the reproducibility of the study. In ResearchGate, on the other hand, reviewers are not anonymous and each paper can have unlimited reviews and comments. In a way, it is an attempt to create a discussion forum for each paper, where authoritative profiles hold discussion on controversial and revolutionary results.
ResearchGate has also recently introduced its own format for reading the documents uploaded to the platform (ResearchGate, 2015a). This format allows any document to be structured in sections and the lines edited, highlighting parts of the text. Of most interest is that each user can mark and comment on any text as a way to discuss, praise or criticize certain sections and paragraphs.
5.1.1 Metrics, Tracking the User Actions
ResearchGate introduces several statistics that describe the impact of organizations, profiles or publications on the network. These indicators could be divided into three categories: bibliometric indicators, usage and connectivity measurements. The first (RG Score, Impact Points, Citations and Publications) are addressed to measure the scientific impact and production of each profile. Although Citations are measured at the paper level, the rest are only calculated at the profile level. The usage statistics (Views and Dowloads) are also observed at the paper level and measure the utilization that the ResearchGate community makes of the uploaded references and documents in the system. Finally, connectivity indices (Followers and Followings) describe the contact activity between the members. To analyse in depth the characteristics of these indicators and describe their distributions, a sample of 1.1 million profiles were harvested in June 2015 and their RG Scores, Impact Points, Publications, Followings and Followers were extracted. Citations, Views and Downloads were analysed at the document level so another crawl of 1.2 million papers was carried out at the same date.
5.1.1.1 RG Score
Created in 2012, the RG Score is the star indicator of the site because it is fed by the other measures that ResearchGate calculates (ResearchGate, 2012). It takes into account both the contributions that each user makes to the system (publications, requests, etc.) and the perception in the community of his or her contributions (profile views, document downloads, citations, etc.). The RG Score is a weighted index based on Google’s PageRank, in which the score of each user can be transferred to other colleagues through these interactions. This means that not all the contacts between users have the same value. For instance, a citation from a researcher with a very high RG Score is more important than the same from several users with a low score. In this way, the RG Score is a measurement that inspires the uploading of contents as well as valuing the use that the ResearchGate community makes of those materials.
ResearchGate only computes the RG Score in profiles that have made any contribution (posting a paper, answering a question or being followed by others). However, recent studies have shown that the research impact of the author’s publications is the element that contributes most in the calculation of this indicator (Jordan, 2015; Ortega, 2015a). In fact, it has been observed that, in most of the cases (96 per cent), this metric is calculated only if the authors have Impact Points. For the rest, the RG Score comes from important networking activity (i.e. Followers, Questions & Answers, etc.).
Figure 5.1 shows the distribution of the RG Score of 660,283 (64.6 per cent) profiles in a binned log-log graph to clearly observe its complex trend. The RG Score is measured in a logarithmic scale so the initial phase of the distribution follows a linear fit, then from the RG Score >60 this trend acquires an irregular pattern close to a power law slope. This means that values below 60 (98 per cent) are stable scores influenced by a limited number of factors and suggests that the greater part of the RG Score values comes almost exclusively from the research impact (Impact Points and Citations). The rest could be unpredictable scores subject to multiple factors, where the number of followers/followings, views, downloads and questions acquire most relevancy.

5.1.1.2 Impact Points
This is another in-house indicator that measures the research impact of the profiles according the journals that publish their works. This index is the result of the aggregation of the Impact Factors (IF) of the multiple journals in which each article was published. For example, a user with a paper published in journal A (IF =4.5) and other in journal B (IF =1.5) obtains an aggregate Impact Point of 6. The Impact Factor is a proprietary indicator designed by Garfield (1999) for the Science Citation Index and is now integrated into the Web of Science of Thomson Reuters. This bibliometric index calculates the ratio of citations per articles published during the preceding two years and is used to value the quality of the journals indexed in Web of Science.
However, ResearchGate reveals a technical problem when it calculates this indicator. The IF is a volatile index that is updated each year and published in the Journal Citation Report. When a reference is added to the system, ResearchGate assigns the current IF of the journal independently when the paper was published. Thus a paper published, for example, in 2010 but not registered until now in the platform acquires the current IF when it should have the IF of 2010. Although this failure is not very serious, it has to be taken into account when this indicator is used for research evaluation. Nevertheless, this metric does present some conceptual problems. The first limitation is that IF is an indicator that measures the impact of journals but not of individual articles, because the impact of an article could be very different to the quality of a journal (Hicks, Wouters, Waltman, de Rijcke, & Rafols, 2015). This problem is even more important when only a fraction of journals have an IF and it excludes non-journal contributions such as books, patents and technical reports. This metric could overemphasize the real impact of an author’s publications and attribute an unreal appreciation of his or her career.
5.1.1.3 Citations
ResearchGate has the ability to extract citations from papers uploaded to the service. This platform is the first and only academic social network that has introduced this indicator to assess both papers and profiles. However, only 24 per cent of the references have a full-text copy attached, so the number of citations is lower than other citation indexes (Ortega, 2015b), which suggests that this service only gathers a small proportion of the overall impact of these papers. Nevertheless, the high increase in full-text papers is predictive of the growing importance of ResearchGate as a site for the evaluation of bibliometric research.
Figure 5.2 plots the distribution of citations per document in a binned logarithmic scale. This distribution follows a power law with a pronounced trend (γ=2.65). This means that the distribution of citations is highly skewed, with 63 per cent of the articles found to receive less than 10 citations and 35 per cent not receiving any. This proportion of uncited documents is higher than in other studies (~20–30 per cent) (Garfield, 1998; Glänzel & Moed, 2002; Van Raan, 2005). However, it could mainly be due to the fact that ResearchGate takes the citations from full-text papers and these make up only 24 per cent of the total database.

5.1.1.4 Publications
This measurement counts the number of items that each user has in his or her profile. This is an indicator of productivity and is related to the ability of a researcher to create scientific content. As a result of this, the number of profiles with some documents (68.6 per cent) is rather low which could point, on the one hand, to the existence of non-productive profiles (i.e. professionals, pre-graduate students) or, on the other hand, to inactive profiles without any contribution to the network.
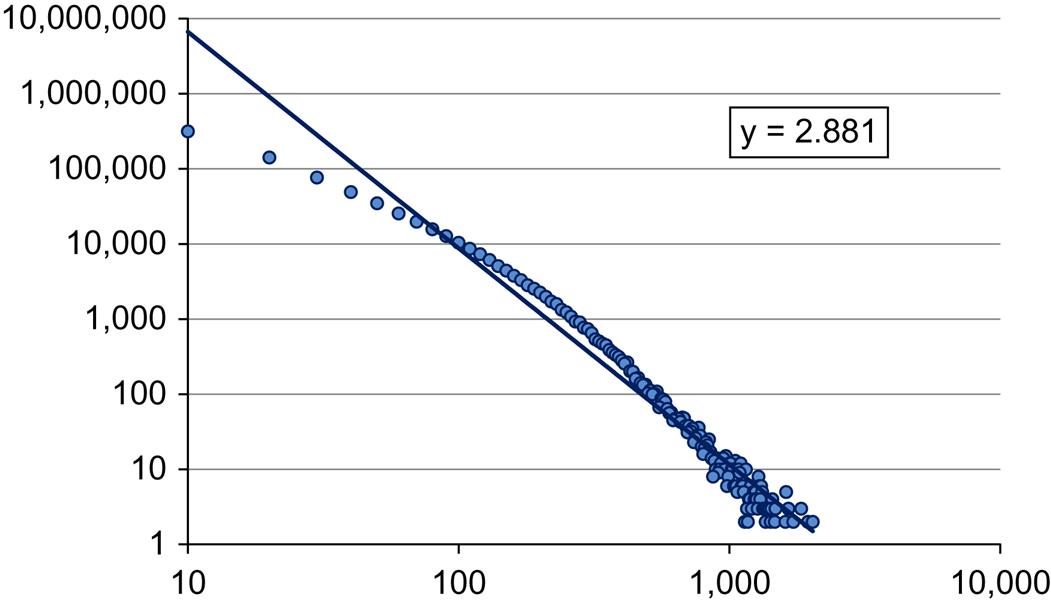
Figure 5.3 presents the distribution of documents per user. As with citations, it follows a power law trend (γ=2.88) in which a reduced number of members produce a large amount of papers, while the majority of the users just deliver a few. In fact, 41 per cent of the profiles publish less than ten articles, while 5 per cent of users put more than 150 documents into the platform. On average, 35.5 document references are added by members.
5.1.1.5 Views
ResearchGate also counts the number of times access is made to a document by other members. This is a usage indicator that attempts to measure the early interest that a document provokes in the system, independent of whether there is a full-text copy of it. From the sample, only 17,952 (1.6 per cent) papers have not received any visit, with an average of 85.1 views per document.
Figure 5.4 graphs the distribution of views in a log-log plot. The observed trend follows two different patterns. The initial stage describes a very paused power law distribution (γ=0.0004), or a Zipf’s distribution. This means that the less visited papers (<90 views) are randomly distributed, showing that a page visited 90 times is as frequent as a page visited only once. This type of distribution emerges when we are studying usage phenomena (visits to web pages, use of words in a text, etc.) (Nielsen, 1997), in which the principle of least effort determines a small number of elections (Zipf, 1949). The second part of the distribution acquires a classical power law with a very pronounced slope (γ=3.7), where a small fraction of pages receive an enormous amount of visits. Thus only 3.8 per cent of documents accumulate more than 10,000 views. From a research evaluation point of view and according to the peculiarity of this distribution, we could state that an article needs more than the threshold of 90 views for it to be considered a paper that has achieved some impact in the ResearchGate’s community.

5.1.1.6 Downloads
A similar usage indicator is the number of downloads of full-text copies are both deposited in ResearchGate and accessible from an external source such as repositories, open journals, etc. This measure could be more precise than views, because the downloading of an article could implicate a higher appreciation of its content and a later precise utilization. From documents with a full-text copy (48.8 per cent), only 11,126 (2 per cent) have not been downloaded to date.
The distribution of downloads follows a pattern similar to views as it describes a similar phenomenon: the use by part of the members of the uploaded texts (Figure 5.5). In the case of downloads the initial trend is less paused (γ=0.98) than in views, which could mean that the download of a document is less the result of chance and more an intentional act than in the case of visits. In this starting section (<60) there is now more differences in the proportion of downloads, but with fewer orders of magnitude. However, it is in the second phase when the distribution is strongly skewed again (γ=2.29) and where the papers with more downloads are concentrated. In specific terms, only 1.6 per cent receive more than 10,000 downloads.

5.1.1.7 Followers/followings
The last metric that ResearchGate counts is the number of followers/followings that a profile has in the system. A follower is a user that stays abreast of the updates of other profiles, tracking new papers and looking out for recent questions and actions. In this context, the number of followers in a profile could be considered an indicator of academic prestige – if users are watching out for the activities of other members it is because they are considered interesting and worth following. On the contrary, the number of followings in a profile points to the networking ability of that user and his or her commitment to taking advantage of documents that other members provide.
Although the before measurements can be aggregated at the profile level, followings and followers are the only measurements of the direct performance of a user in the network. While it is true that articles also have followers who track their research impact across time, the use of this functionality is anecdotal and only 7,907 (0.6 per cent) documents from the sample have some followers.
Figure 5.6 plots the log-log distribution of followers and followings by member. From the sample, 79 per cent users follow some profiles with an average of 25 followings per user, while 87 per cent of users have some followers with 28.5 followers on average. This slightly higher presence of followers by users had already been observed in other academic social sites (Ortega, 2015b), and suggests that while following a profile is a random process motivated by access to information and knowledge, being followed could produce a preferential attachment process, less accidental and more skewed. This would explain why the trend of followers (γ=3.16) is more pronounced than the trend of followings (γ=3.04), because the distribution of followings is more equitable and limited, while the proportion of followers arises from a few members.

5.1.2 Organizations, Beyond the Personal Profiles
ResearchGate allows users to select their research place from a normalised and closed list, although it is also possible to manually add a new institution. This platform aims, in this way, to organize and group members by their corresponding institution, with the aim of presenting the academic activity at the organization level. This allows it to provide and compare the social networking performance of universities and research organizations.
These institutions are ranked by RG Score and Impact Points. In this ranking, a total list of 44,183 universities as well as research centres, companies, foundations and scientific associations were presented in June 2015. This list only includes institutions with an RG Score, which means this list may not be entirely complete. Each institution has a home page that summarizes their principal statistics, such as number of papers, members, RG Score and Impact Points (Thelwall & Kousha, 2015). However, not all the institutions in the ranking have their own page. From the initial list, only 20,762 (47 per cent) have an own page, and according to the remaining institutions, ResearchGate claims that it is ‘crunching’ the data of those organizations. This means that there is a post-process of normalization and cleaning of research institutions to avoid duplicates and group organizations under principal entities. Even so, by exploring this list it is possible to observe that there are research institutes disassociated from their headquarters (i.e. Max-Planck-Institut für die Physik des Lichts).
In spite of this effort, ResearchGate suffers the same problems as academic information systems that try to group their content by normalised organizations (i.e. Microsoft Academic Search) (Ortega, 2014). In the case of ResearchGate, each member can only belong to one organization, which produces problems with authors with several affiliations or members that have been moved across different organizations. In that case, ResearchGate groups the production of those authors under the current organization, independently of whether the user’s documents were published under another affiliation. This, from a research evaluation view, generates the wrong perception of the societal performance of an organization, assigning it a distorted production and impact.
Another limitation is that not all the members are linked to an organization. Taking a random sample of 1,000 profiles, only 16 per cent were ascribed to an institution. These could be independent researchers or members that do not want to link their profiles to an organization. In any case, this percentage suggests that a significant percentage of members do not contribute to their organizations, meaning that the perception on these organizations is not completely exact.
Table 5.1 shows the ten most relevant organizations by RG Score. A total of 4.2 million (61 per cent) users are linked to the first 20,762 organizations. The rest could be members linked to small institutions without a homepage or authors that have decided not to connect with an academic institution. Both RG Score and Impact Points are calculated by aggregation of profiles, so it is natural that large organizations in terms of the number of workers have high positions in the ranking. Among the highest of these are the Chinese Academy of Sciences (226,567), the University of São Paulo (153,947) and the University of Michigan (118,584). However, in terms of the number of publications the rankings change considerably, with the University of California, Los Angeles (112,015) as the organization with most papers, followed by the University of Tokyo (107,277) and the University of Washington, Seattle (106,316).
Table 5.1
The ten most important organizations by RG Score in ResearchGate
| Organization | RG Score | Users | Impact points | Publications |
| Chinese Academy of Sciences | 226,567 | 22,077 | 266,176 | 94,529 |
| University of São Paulo | 153,947 | 20,072 | 122,645 | 54,809 |
| University of Michigan | 118,584 | 9,895 | 347,274 | 91,277 |
| Russian Academy of Sciences | 115,893 | 8,369 | 127,502 | 73,670 |
| French National Centre for Scientific Research | 110,287 | 5,417 | 342,700 | 95,225 |
| Italian National Research Council | 108,470 | 5,620 | 56,486 | 17,919 |
| University of Washington Seattle | 104,149 | 8,502 | 481,766 | 106,316 |
| Stanford University | 101,449 | 7,735 | 406,949 | 88,125 |
| University of Toronto | 101,396 | 10,498 | 371,332 | 96,946 |
| University College London | 96,211 | 9,864 | 226,205 | 51,311 |
| Total | 34,141,168 | 4,273,172 | 66,971,882 | 21,220,277 |

Grouping these institutions by country, Table 5.2 presents the ten most important countries by RG Score. The United States (8.8 million) stands out in first place with an RG Score four times that of the second, the United Kingdom (2.2 million). This proportion remains the same according to members, with 22.8 per cent for the United States, 7.6 for the United Kingdom and 5.9 per cent for India. In terms of publications, these differences are even larger with 34 per cent for the United States, 6.8 per cent for Japan and 6.6 per cent for the United Kingdom. With regard to the penetration index, it is interesting to note that it is western countries which show most penetration, such as the United Kingdom (2.04), Australia (2.02) and Italy (1.9). One particular point to note is that Germany, a country in which the service is located, presents a penetration below one, which indicates that the service is not as popular as might be expected. The Country Spreading percentage shows that these ten countries contain only 56 per cent of the total population of ResearchGate, which tells us that the service has expanded across the world and its users come from a more varied number of countries.
Table 5.2
The ten most important countries by RG Score in ResearchGate
| Country | RG Score | Impact points | Members | Members % | Publications | Publications % | Penetration |
| United States | 8,865,227 | 28,448,927 | 973,699 | 22.8 | 7,224,165 | 34.0 | 1.23 |
| United Kingdom | 2,237,480 | 5,215,306 | 325,231 | 7.6 | 1,402,364 | 6.6 | 2.04 |
| Germany | 1,944,623 | 3,868,543 | 195,870 | 4.6 | 1,204,637 | 5.7 | 0.91 |
| Italy | 1,749,779 | 2,359,904 | 127,314 | 3.0 | 776,387 | 3.7 | 1.90 |
| France | 1,594,640 | 2,393,883 | 129,310 | 3.0 | 710,767 | 3.3 | 0.82 |
| China | 1,526,726 | 1,991,507 | 189,722 | 4.4 | 956,349 | 4.5 | 0.23 |
| Spain | 1,268,380 | 1,580,814 | 116,152 | 2.7 | 539,951 | 2.5 | 1.41 |
| Japan | 1,239,454 | 3,934,946 | 80,862 | 1.9 | 1,438,779 | 6.8 | 0.19 |
| Canada | 1,151,952 | 2,710,732 | 130,766 | 3.1 | 833,301 | 3.9 | 1.31 |
| Australia* | 1,008,106 | 1,584,452 | 118,292 | 2.8 | 500,787 | 2.4 | 2.02 |
| Total | 34,141,169 | 66,971,883 | 4,273,172 | 100 | 21,220,277 | 100 | 100 |

*2010.
5.1.3 Publications, Self-archiving Driving Force
ResearchGate is fed from the bibliographic references included in institutional and thematic repositories around the world. Through the Open Archive Initiative (OAI), a range of standards and protocols that assure the interoperability of digital libraries and the sharing of bibliographic data, ResearchGate extracts and harvests the bibliographic metadata of the documents deposited in such archives. Specifically, the OAI Protocol for Metadata Harvesting (OAI-PMH) functionality is used to gather this information. These documents are then suggested to existing profiles, perhaps because one of the authors has a similar name to that in the profile. Alternatively, these references may simply be deposited in the ResearchGate database waiting to be required by a future profile (Murray, 2014).
In addition to collecting bibliographic metadata, since 2009 ResearchGate has incorporated a self-archiving service that permits researchers to share the full-text of their publications directly on the platform. To avoid copyright infringements, the platform links each journal with the Sherpa/RoMEO database of publishers’ policies on copyright and self-archiving.
Overall, ResearchGate has gathered approximately 80 million documents, of which 19 million (24 per cent) are full-texts (ResearchGate, 2015b). A sample of 1.2 million documents was retrieved from the directory of publications (http://www.researchgate.net/directory/publications). This directory contained around 13 million documents as of June 2015 and provides a selection of the most recent documents to be added to the system. Only papers that start with the letter ‘a’ were selected for the sample. This list of papers was taken from the directory because it is the easiest way to collect a large amount of papers indexed in ResearchGate, although the procedure could introduce some bias as this list only references the most recent papers in the database.
Thus, for example, Figure 5.7 describes the evolution of the posting of full-text documents in ResearchGate. Although ResearchGate has acted as a self-archiving service since 2009, the sample only includes documents uploaded from 2012. Therefore, according to this sample, 48.8 per cent of documents have a full-text version, just double the proportion reported in the official fact sheet (ResearchGate, 2015b). This means that the more recent a document is, the higher is the probability of finding a full-text copy of it. Hence, during this period (2012–15), more than half the full-text papers (56 per cent) were only posted during the first six months of 2015, the growth rate in this period being CAGR =320 per cent. These results demonstrate that the archiving of full-text documents is increasing exponentially and it is possible that this trend will continue to broaden its percentages.

Considering in detail the relationship between bibliographic references and full-text documents, Table 5.3 shows this comparison according to the type of document. Overall, Article is the most important category and constitutes 84 per cent of the entries in ResearchGate, followed by Conference Paper (12.9 per cent). The rest of the categories are testimonials with very small percentages. However, when the proportion of references with/without full-text copy is considered, Article (43.8 per cent) and Conference Paper (46.3 per cent) are the document types that are less freely accessible, while the majority of Technical Report (93 per cent) and Patent (91.1 per cent) are full-text copies. This could be the result of copyright restrictions imposed by the scientific publishers that would limit the uploading of papers on the part of users. In spite of this, Article (81.6 per cent) and Conference Paper (13.3 per cent) are the document types with the most full-text documents. Among the document types, it is interesting to comment on the Research category. This corresponds to unpublished papers to which ResearchGate gives a DOI generated by its own site. In this respect, ResearchGate is acting as a publisher as well, so that draft and unpublished materials can be read by the scientific community as well as their impact tracked through the ResearchGate indicators.
Table 5.3
Distribution of publications and full-text documents by document type in ResearchGate
| Total | Articles | % | Full-text | Articles | % | Full-text % |
| Article | 1,022,040 | 84.0 | Article | 448,115 | 81.6 | 43.8 |
| Conference Paper | 157,329 | 12.9 | Conference Paper | 72,850 | 13.3 | 46.3 |
| Chapter | 14,346 | 1.2 | Chapter | 9,834 | 1.8 | 68.5 |
| Dataset | 14,173 | 1.2 | Dataset | 11,093 | 2.0 | 78.3 |
| Book | 2,987 | 0.2 | Book | 2,341 | 0.4 | 78.4 |
| Thesis | 2,440 | 0.2 | Thesis | 2,036 | 0.4 | 83.4 |
| Technical Report | 1,866 | 0.2 | Technical Report | 1,735 | 0.3 | 93.0 |
| Research | 982 | 0.1 | Research | 735 | 0.1 | 74.8 |
| Patent | 548 | 0.0 | Patent | 499 | 0.1 | 91.1 |
| Total | 1,216,711 | 100 | 549,238 | 100 | 45.1 |

ResearchGate does not classify its publications by any subject-matter classification system. Therefore the journal titles in the sample were matched with the classified list of journals held by Scopus, one of the largest and most important citation indexes, obtaining 604,502 (58.7 per cent) articles classified according the Scopus subject areas.
The thematic distribution of ResearchGate’s publications database will be explored in this way. Figure 5.8 shows the distribution of publications and full-text documents by the five main subject areas, along with the percentage of full text files in each area. In general, 43 per cent of references have a full-text copy attached. Physical Sciences (38.6 per cent) and Life Sciences (26.1 per cent) are the areas to which most publications contribute, while Social Sciences and Humanities (9.2 per cent) and General (0.7 per cent) are the disciplines that have the fewest documents in this academic site. According to full text papers, the proportion is similar to previous results, with 35.8 per cent of documents for Physical Sciences and 29.8 per cent for Life Sciences. However, the full-text rate in each discipline shows that Life Sciences (49.6 per cent) and Health Sciences (43.4 per cent) researchers upload more full-text papers than authors from Social Sciences and Humanities (38.3 per cent) and Physical Sciences (40.2 per cent). These results inform us that the content of ResearchGate has a clear natural and experimental sciences orientation, while the humanities and social scientists contribute with a smaller output.

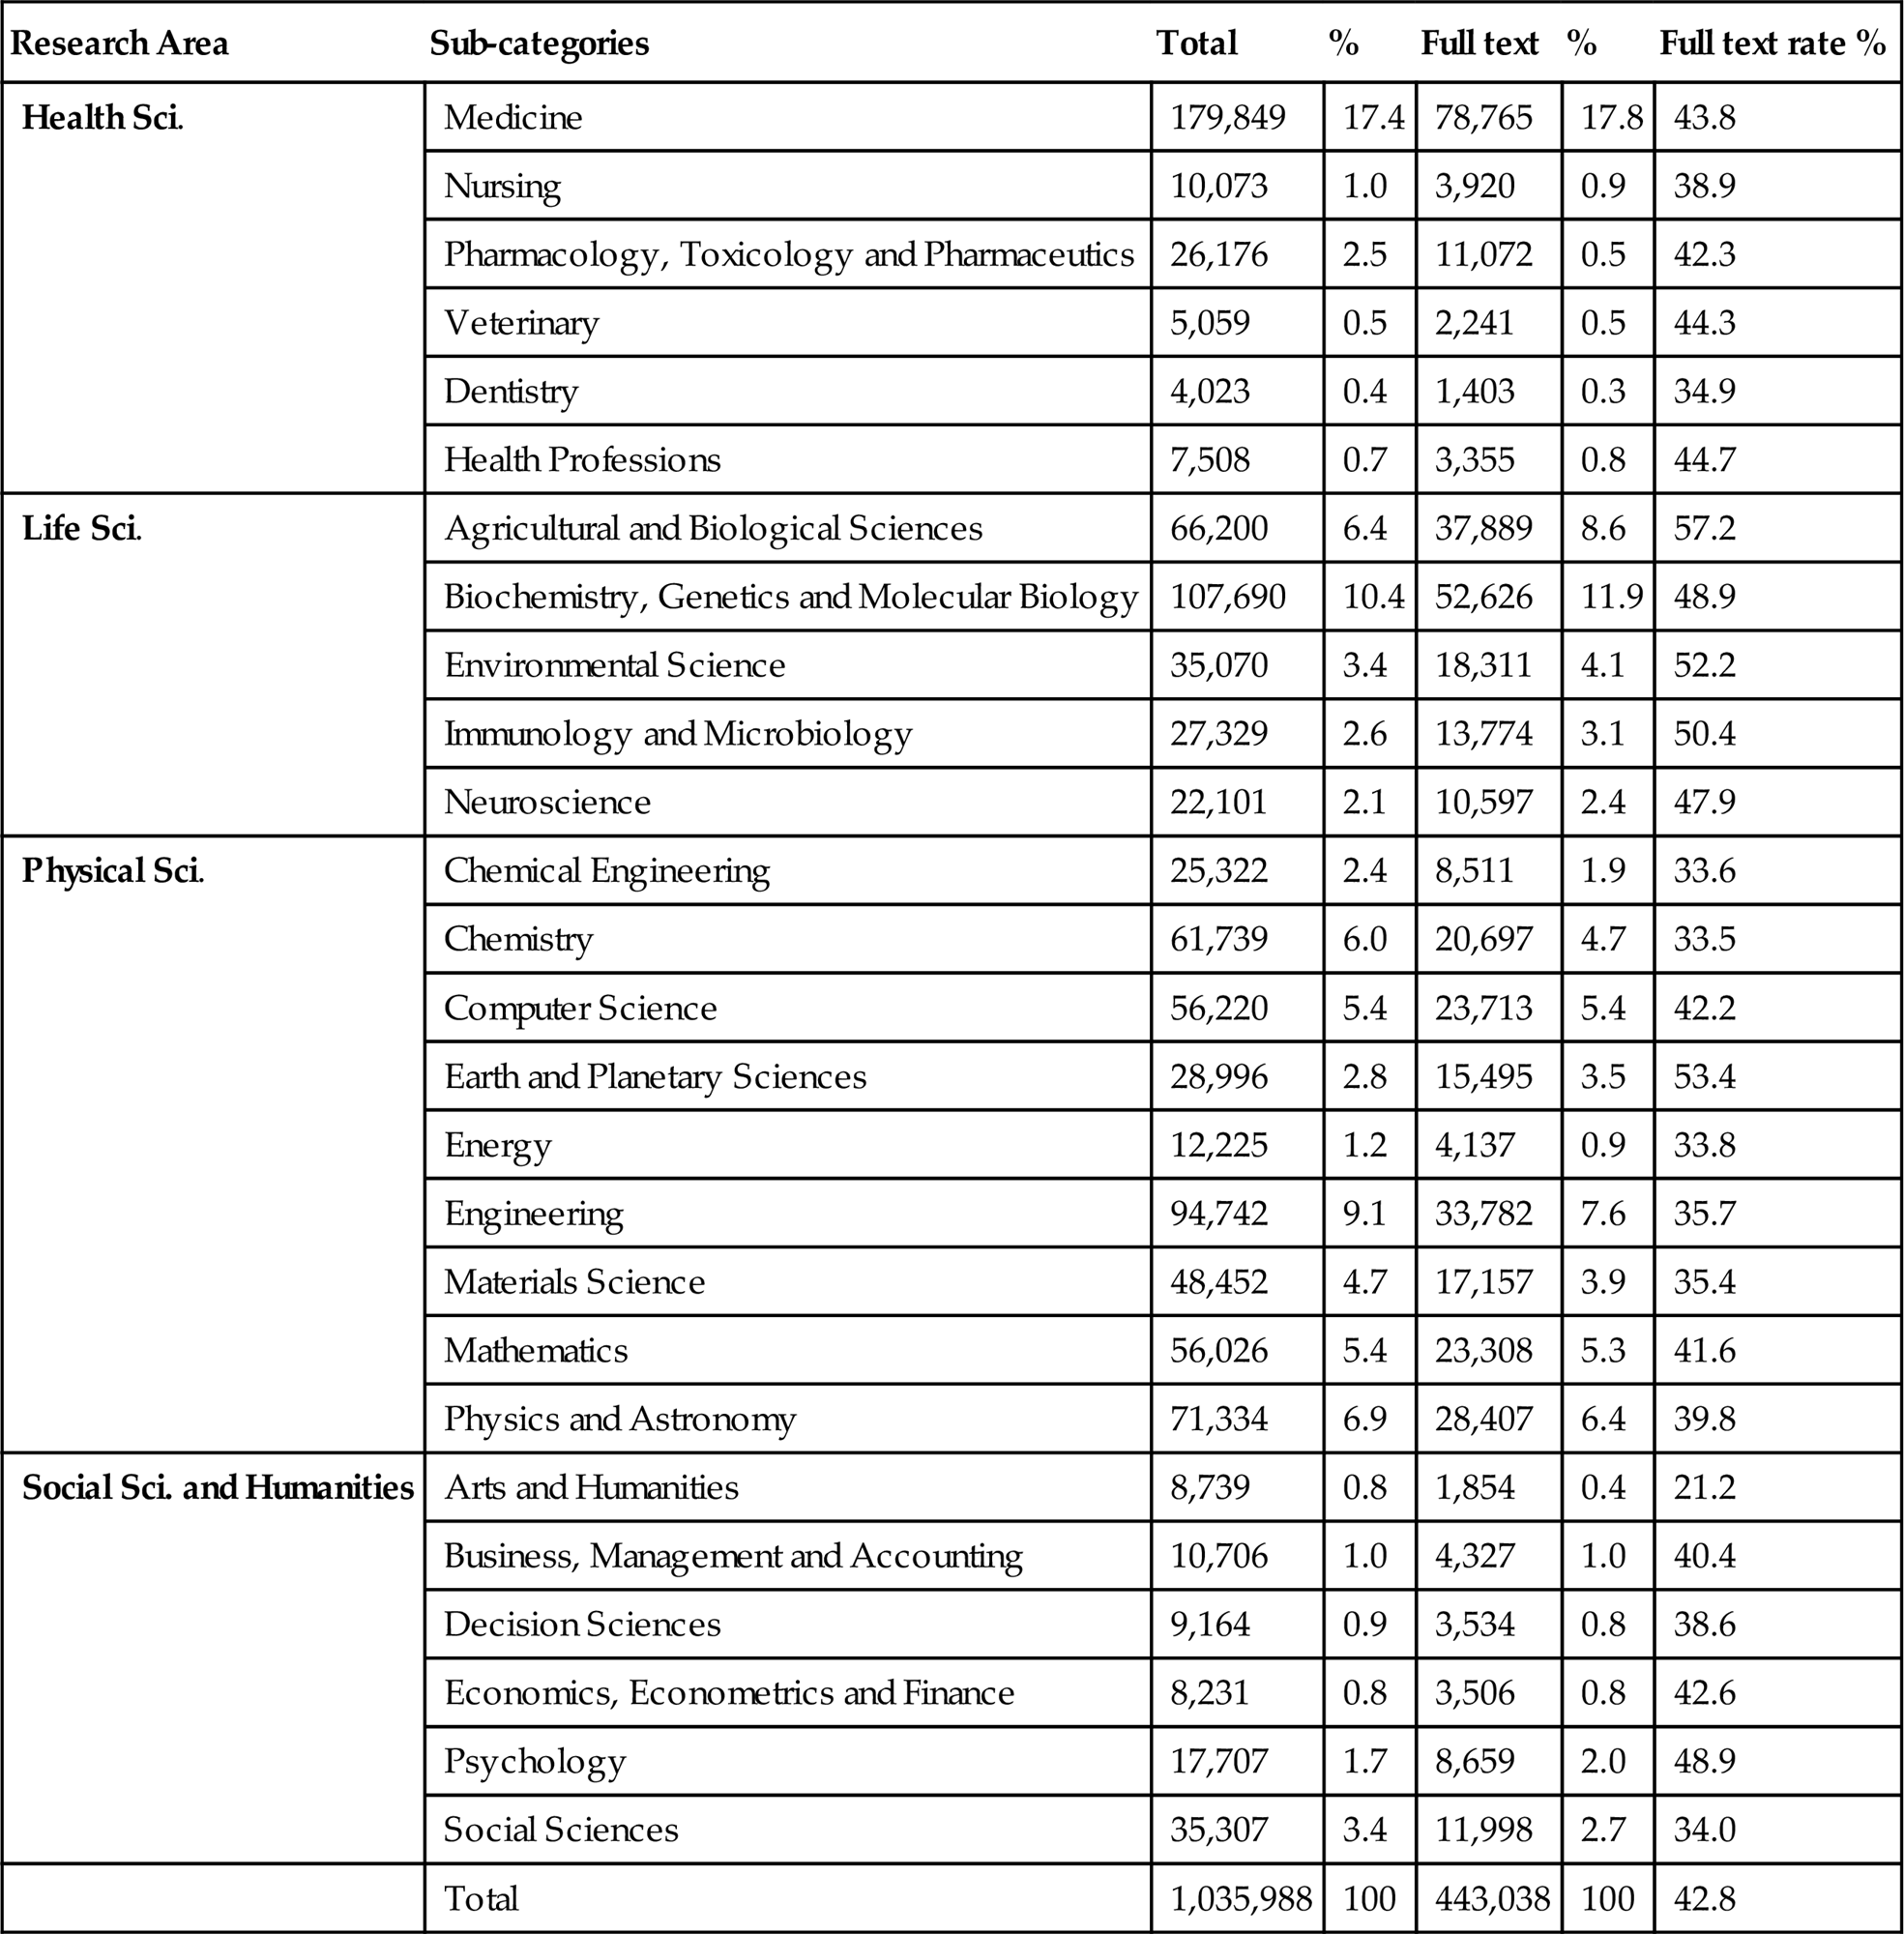
Looking at the thematic classification in further detail, Table 5.4 shows the number of documents by subject classes. Medicine (17.4 per cent; 17.8 per cent) and Biochemistry, Genetics and Molecular Biology (10.4 per cent; 11.9 per cent) are the classes that contain most papers and full texts respectively, while Arts and Humanities (0.8 per cent; 0.4 per cent) is the class with fewest documents and full texts. According to the proportion of full-text items, Agricultural and Biological Sciences (57.2 per cent) and Earth and Planetary Sciences (53.4 per cent) are the subject classes with the most full-text documents; on the other hand, Arts and Humanities has only 21.2 per cent of full-text documents. These figures confirm the previous results and highlight the fact that ResearchGate contains more biomedical content than other disciplines, mainly subject classes related to the Social Sciences and Humanities.
Table 5.4
Distribution of publications and full-text documents by subject class in ResearchGate
| Research Area | Sub-categories | Total | % | Full text | % | Full text rate % |
| Health Sci. | Medicine | 179,849 | 17.4 | 78,765 | 17.8 | 43.8 |
| Nursing | 10,073 | 1.0 | 3,920 | 0.9 | 38.9 | |
| Pharmacology, Toxicology and Pharmaceutics | 26,176 | 2.5 | 11,072 | 0.5 | 42.3 | |
| Veterinary | 5,059 | 0.5 | 2,241 | 0.5 | 44.3 | |
| Dentistry | 4,023 | 0.4 | 1,403 | 0.3 | 34.9 | |
| Health Professions | 7,508 | 0.7 | 3,355 | 0.8 | 44.7 | |
| Life Sci. | Agricultural and Biological Sciences | 66,200 | 6.4 | 37,889 | 8.6 | 57.2 |
| Biochemistry, Genetics and Molecular Biology | 107,690 | 10.4 | 52,626 | 11.9 | 48.9 | |
| Environmental Science | 35,070 | 3.4 | 18,311 | 4.1 | 52.2 | |
| Immunology and Microbiology | 27,329 | 2.6 | 13,774 | 3.1 | 50.4 | |
| Neuroscience | 22,101 | 2.1 | 10,597 | 2.4 | 47.9 | |
| Physical Sci. | Chemical Engineering | 25,322 | 2.4 | 8,511 | 1.9 | 33.6 |
| Chemistry | 61,739 | 6.0 | 20,697 | 4.7 | 33.5 | |
| Computer Science | 56,220 | 5.4 | 23,713 | 5.4 | 42.2 | |
| Earth and Planetary Sciences | 28,996 | 2.8 | 15,495 | 3.5 | 53.4 | |
| Energy | 12,225 | 1.2 | 4,137 | 0.9 | 33.8 | |
| Engineering | 94,742 | 9.1 | 33,782 | 7.6 | 35.7 | |
| Materials Science | 48,452 | 4.7 | 17,157 | 3.9 | 35.4 | |
| Mathematics | 56,026 | 5.4 | 23,308 | 5.3 | 41.6 | |
| Physics and Astronomy | 71,334 | 6.9 | 28,407 | 6.4 | 39.8 | |
| Social Sci. and Humanities | Arts and Humanities | 8,739 | 0.8 | 1,854 | 0.4 | 21.2 |
| Business, Management and Accounting | 10,706 | 1.0 | 4,327 | 1.0 | 40.4 | |
| Decision Sciences | 9,164 | 0.9 | 3,534 | 0.8 | 38.6 | |
| Economics, Econometrics and Finance | 8,231 | 0.8 | 3,506 | 0.8 | 42.6 | |
| Psychology | 17,707 | 1.7 | 8,659 | 2.0 | 48.9 | |
| Social Sciences | 35,307 | 3.4 | 11,998 | 2.7 | 34.0 | |
| Total | 1,035,988 | 100 | 443,038 | 100 | 42.8 |
5.1.4 Profiles, a Balanced Scientific Community
One of the most important elements in this platform is the profiles of the scientists through which members can interact and share resources with other members. ResearchGate only admits institutional email accounts to create a profile; in this way it restricts access only to academic staff or users linked in some way with a scholarly or scientific institution. Despite each profile having to be created by a user, ResearchGate generates automatic profiles (researchers) from the authors of the papers indexed in its database. However, these profiles must be validated to be accepted as a real profile. In this study only approved profiles were analysed. Based on the list of organizations, a crawler was performed in April 2015 to gather a wide and random sample of profiles. In total, 1.1 million profiles were identified and their description data and indicators were extracted.
Since the launch of the service in 2008, the platform has experienced tremendous growth, obtaining in just six years more than 7 million profiles (ResearchGate, 2015c). Figure 5.9 describes the annual incorporation of users and the accumulated trend up to June 2015. These data were obtained from the WayBack Machine of Archive.org and the ResearchGate blog. The graph presents an exponential increase of users, with an important jump of new incorporations in 2015. Thus the site growth has an annual rate of CAGR =126 per cent which predicts good health and massive interest during the coming years.

Figure 5.10 shows the distribution of profiles according to the scholarly position of their users. From the sample, only 376,266 (33 per cent) profiles contain any information in this field and from this percentage, 187,483 (25 per cent) profiles showed a clear academic status. Thus only one-quarter of the profiles includes information on their positions. Taking into account only the most frequent categories, PhD Student (22.8 per cent) followed by Professor (18.6 per cent) and Postdoc Researcher (13.4 per cent) are the most common types of academic status in the network. As in other academic sites, young researchers are the group with the most profiles and if PhD Student, Assistant Professor/Researcher and Student are summed, the proportion of starting researchers rises to 41 per cent. A medium age group includes Postdoc Researcher, Associate Professor/Researcher and Lecturer at 31.6 per cent. And finally a veteran group with Professor, Researcher and Medical Doctor constitutes 27 per cent. These percentages are similar to the common distribution of academic statuses, so it is possible to conclude that ResearchGate presents a balanced distribution of profiles according to the age of their users.

ResearchGate permits each member to be grouped by different research disciplines and subdisciplines. In this way, the system is able to orient users towards specific questions and recommend to them new publications in specific areas. Specifically, the system allows the selection of three research disciplines and nine subdisciplines. This also favours the thematic arrangement of the site as well as generating different access points and improving the discovering of profiles. Some disciplinary category is included in 81 per cent of the profiles.
Figure 5.11 shows the distribution of users according to the four main scientific areas. The most populated areas are Physical Sciences (34.7 per cent) followed by Health Sciences (22.9 per cent) and Life Sciences (21.6 per cent). This confirms the high presence of biologists and physicians in ResearchGate, and the less weight held by social scientists and those in the humanities (Elsayed, 2015; Ortega, 2015b).

Looking in more depth, Table 5.5 details the thematic distribution of profiles by discipline. The table shows the elevated presence of researchers from Medicine (22.9 per cent), Biology (18.6 per cent) and Engineering (10.1 per cent), whereas Religious Studies (0.1 per cent) and Entertainment and Arts (0.3 per cent) present the lowest percentages. This confirms the unbalanced distribution of profiles mentioned above and the preference of this platform for biomedical researchers.
Table 5.5
Number of profiles by research discipline in ResearchGate
| Discipline | Frequency | Frequency % |
| Medicine | 190,032 | 22.91 |
| Biology | 154,469 | 18.62 |
| Engineering | 84,258 | 10.16 |
| Chemistry | 63,240 | 7.62 |
| Computer Sciences | 44,245 | 5.33 |
| Psychology | 43,303 | 5.22 |
| Physics | 39,323 | 4.74 |
| Economics | 34,325 | 4.14 |
| Geosciences | 26,945 | 3.25 |
| Agricultural Science | 24,912 | 3.00 |
| Education | 24,761 | 2.98 |
| Mathematics | 24,516 | 2.96 |
| Social Sciences | 24,052 | 2.90 |
| Political Science | 8,727 | 1.05 |
| Anthropology | 8,658 | 1.04 |
| History | 5,746 | 0.69 |
| Linguistics | 5,619 | 0.68 |
| Law | 5,591 | 0.67 |
| Philosophy | 3,757 | 0.45 |
| Design | 3,379 | 0.41 |
| Literature | 3,224 | 0.39 |
| Space Science | 2,622 | 0.32 |
| Entertainment and Arts | 2,418 | 0.29 |
| Religious Studies | 1,045 | 0.13 |
| Other | 383 | 0.05 |
| Total | 829,550 | 100 |
5.1.5 Questions & Answers, a Forum Concealed by Questions
One of the most interesting elements of social interaction is the section Question & Answers (Q&A). This instrument has been through several adaptations since its initial conception in 2009. In the beginning, users were able to join specialist groups where they had a discussion forum to debate their ideas. In 2011, these forums were grouped into Topics and finally in 2012 they were transformed into a questions and answers format (Goodwin, Jeng, & He, 2014), restarting the model introduced by Nature Network in 2007.
This tool permits a technical, methodological or conceptual query to be passed to ResearchGate’s scientific community to be solved by their experts. Each query is associated with several research topics and the skills and expertise of members, by which means these queries can be answered by members related to those issues. Queries are treated as threads of a forum, where it is possible to find different answers to a query and in which various members follow how a query is solved by the community. In this way, questions become in turn discussion issues, in which any user can participate by posting his or her response (Li, He, Jeng, Goodwin, & Zhang, 2015).
A sample of 143,349 queries was obtained from a crawler to analyse the behaviour of this collaborative tool and explore the use that the academic community makes of it. Of these questions 94.1 per cent were answered, which is a high response ratio and suggests that the ResearchGate community is very handy for solving this kind of problem. Taking into account this percentage, we can estimate that the total number of queries in the system is no more than approximately 220,000 because, according to ResearchGate itself, 200,000 queries were responded to up to June 2015. In spite of this efficacy in solving questions, the number of users that launch a query is 77,265 (1.1 per cent), that is only one in one hundred members asks a question in Q&A. In addition, 95.7 per cent of these members do not formulate more than five questions. These data show a similar behaviour to previous academic sites, in which only a small fraction of users participate in networking activities.
If we look at the number of answers to these questions, this sample contains 887,868 replies, a figure very close to the 1 million provided by ResearchGate. This means that approximately one in twelve users responds to a query and, on average, there are 6.2 replies per question with a median of 4 (Alheyasat, 2015). This shows that although it seems that the users are a little resistant to put questions, there is indeed a higher propensity to solve the problems of colleagues. Moreover, the high number of followers (1.1 million) and views (56 million) provide evidence that this tool arouses a great deal of interest among the ResearchGate community since many users can find pertinent responses to questions that concern the entire community.
Analysing the relationship between views, followers and answers, we find that there is a good correlation between answers and followers (r =0.69), but views show poor correlation with answers (r =0.45) and followers (r =0.49). This suggests that the questions most viewed are not necessarily the questions that receive most answers or followers, and therefore it is possible that there are different types of question that attract more answers or more views. For example, Table 5.6 lists the five most viewed and answered questions in the sample. Analysing the content of the queries, it is possible to observe differences between both types of queries. Those most viewed are queries that aim to solve an uncertainty or demand a simple and direct answer. These queries create sufficient interest but only require a couple of answers. On the contrary, the most answered questions are actually discussion issues that attract many answers but for a specific audience. In fact, many of these queries are related to theoretical and philosophical issues. This demonstrates that the Q&A section works both as a discussion forum and as a reference system.
Table 5.6
The five most answered and viewed questions in ResearchGate
| Question | Views | Question | Answers |
| How can a patient lower uric acid level in his blood without taking any drugs? | 366,686 | Is Chalmers’ so-called ‘hard problem’ in consciousness real? | 5,353 |
| What is the best TeX editor for LaTeX? | 165,350 | Can ethics be measured objectively? | 1,448 |
| What is the relationship between the COD and BOD values in waste water? | 124,545 | Does certainty or absolute truth exist? | 1,104 |
| What is the difference between SEM and TEM techniques? | 124,045 | Is there a solid counter-argument against Dingle’s old objection to Relativity Theory? | 970 |
| I would greatly appreciate it if you kindly give me some feedback on this research data management guide | 115,352 | Are patterns in human designs a mirror of patterns found in nature or are patterns in human designs somehow different from patterns found in nature? | 930 |
| Total | 56,085,129 | 881,411 | |
| Average | 391.2 | 6.1 |

Figure 5.12 presents the evolution in the number of questions by date of execution. It can be seen that, despite of the service being active since 2008, the number of questions remained constant until 2012, when the number of queries began to grow exponentially up to today. This sudden increase coincides with the transformation of the group forums into the questions and answers model, and demonstrates that this change has been fruitful because it has successfully attracted the participation of the community, multiplying their posts and the number of responses (Goodwin et al., 2014).

5.1.6 More than a Social Network
ResearchGate is one of the most interesting platforms in the current panoply of academic social sites, not only facilitating the building of personal profiles and the uploading of full-text documents, but also providing a varied range of metrics that allow members to follow the impact and usage of their academic outputs on the network. Thus ResearchGate connects directly with the altmetric philosophy, puts the relationships between bibliometric, networking and usage measurements in the same context, and enables how they are influenced to be observed. This fact is fundamental for exploring the scholarly meaning of these indicators and what implications they have for research evaluation.
As an information resource, ResearchGate’s bibliographic database is fed from a complete list of academic repositories which, thanks to the OAI-PMH functionality, makes it easy to gather an extensive literature. This complements the references that users manually include in their profiles, allowing the collection of more than 80 million references, a significant figure that surpasses the principal citation indexes. However, only 24 per cent of these references have a full-text copy of the document attached, which shows that self-archiving has some limitations. This holding back when it comes to posting full-text copies is sometimes prompted by the disinclination of users themselves and even more so by the restrictions made by publishing houses. In spite of this, the fact that this percentage is getting smaller as more recent items are observed (i.e. 48.8 per cent for papers published after 2012) and that the growth rate of full-text papers increases more and more each year (CAGR =320 per cent) foretells a successful consolidation of ResearchGate as a document depositing service.
ResearchGate could therefore be considered one of the environments analysed that shows better health as the site also presents a generalized growth in profiles. Thus the number of users has grown at a constant rate (CAGR =126 per cent), reaching a global spread across continents, disciplines and generations. In this sense, ResearchGate has permeated most countries, from the principal academic powers to new emerging and growing countries. Similarly, this platform has brought together scholars from different academic stages with a balanced distribution of profiles by academic position. From a disciplinary point of view, ResearchGate incorporates an important presence of life and health scientists (44 per cent) which fits with the usual predominance of biomedical researchers within the academic community. ResearchGate therefore represents a growing and unbiased space where a representative set of scholars converges to share their output and prompt interactions between them.
Another outstanding aspect of ResearchGate is the elevated activity of its social network. The analysis of the usage metrics confirms that one of the preferred actions in the network is to explore the research outputs of other profiles (Al-Shara, 2015). Thus, for instance, 98.4 per cent of the documents have been viewed at least once and 98 per cent of full-text items have been downloaded. According to networking percentages, the number of users followed (87 per cent) and following (79 per cent) also verify that following other members is the best way to explore the site’s content as well as to keep up to date with new contributions (Chakraborty, 2012). Other interactive functionalities such as Q&A present a high participation with an important response rate (94 per cent), although only a small number of users formulate any questions (1 per cent). All these figures demonstrate the great health of the platform, which counts with a vitalized community that max out all their capacities to obtain the most recent news on their research interests, using all the networking instruments that ResearchGate offer.
One could say that ResearchGate gathers together all the key elements that make the Science 2.0 concept a reality. As a social network, it builds an environment in which the collaboration and sharing of information allows users’ outputs to be boosted while keeping up to date in the recent literature, creating a network of ties that stimulate online collaboration and the development of new projects. On the other hand, self-archiving, albeit with difficulty, is becoming a reality that will convert the Open Access movement into an authentic alternative for scientific communication. However, perhaps it is the battery of indicators that is the definitive successful element of this site, incorporating a reward system that brings value to both the bibliometric impact of members’ contributions and at the same time enables the online usage of these contents outside of the traditional channels. Along with the RG format, which facilitates the introduction of peer review processes, ResearchGate brings together every element in the design of a different publishing system, an open, transparent and collaborative system in accordance with Science 2.0.
5.2 Academia.edu
Another popular document sharing system is Academia.edu, a platform started in September 2008 in San Francisco by Richard Price from the University of Oxford along with Andrew Watkins (Stanford University), Jarques Pretorius (Art Institute of California – San Francisco) and Ben Lund (University of Cambridge). This heterogeneous group of young computer scientists and humanities scholars created this service out of frustration with the slowness of the journal publication process and the lack of access to relevant publications in their research areas (Price, 2012). In this sense, Academia.edu emerges not only as a platform for sharing materials among scholars, but as a real revolutionary Science 2.0 service that wants to implement a new academic publication system based on immediacy, openness and partnership (Price, 2013). This activist support to open access actions could be behind its dispute with Elsevier (Clarke, 2013), which demanded the withdrawal of more than 2,000 papers infringing the Digital Millennium Copyright Act (DMCA). In spite of this, Academia.edu keeps its commitment to the free diffusion of scholarly content and the belief in online networking as the driving force for a new scholarly communication.
Academia.edu is structured into four main elements: profiles, documents, research interests and organizations. These elements are interconnected and allows the grouping of users (profiles) and their outputs (documents) by organizational (organizations) and thematic (research interests) criteria.
5.2.1 Profiles, the Humanists Network
Profiles is a crucial part of the system because through their profiles scholars may build their homepages and upload their publications. This area contains biographic information on users and a list of uploaded publications along with some statistics that describe the performance of these profiles. In addition, each member has access to a personal Analytics Dashboard which details the activity of his or her profile and their publications (Academia.edu, 2012). To analyse the population of researchers linked to this platform, a crawler was designed and performed to extract a representative sample of profiles. One million profiles were harvested along with their organizations, positions, interests and metrics.
Academia.edu is the academic social site that has most users, with 23 million profiles in July 2015. Archive.org’s WayBack Machine is used to obtain the number of users at the end of each year but unfortunately this information is only available from 2010. Figure 5.13 shows the evolution of new memberships in each year and the cumulative trend. Since 2010, there has been a constant increase in the number of profiles, the biggest increases being experienced from 2013. In fact, the amount of profiles has grown fourfold (CAGR =118 per cent) since that point in time. These results show that Academia.edu enjoys good health and its growth phase is still active. However, this disproportionate amount of profiles – three times more than ResearchGate and double the UNESCO statistics (UNESCO, 2015) – suggests that this site is not only populated by scholars, but that it is possible that other types of professionals are using the network to take advantage of the bibliographic resources included in it.

Every profile is able to select his or her work institution from a predefined closed list and the department linked to that organization; alternatively he or she may call themselves independent researchers if they do not wish to fill in the affiliation information or have simply overlooked doing so. Academia.edu assigns to each URL’s profile a sub-domain belonging to his or her institution (i.e. oxford.Academia.edu for members from the University of Oxford). However, these domains are not always correct and Academia.edu can confuse institutions and domains. For example, the web domain of the University Complutense of Madrid is ucm.es, but Academia.edu assigns it emui.eu, the address of the Euro-Mediterranean University Institute (EMUI). In spite of these mistakes, sub-domains describe the institutional presence of profiles in the platform. Out of the 1,010,300 users, only 430,494 (42.6 per cent) are affiliated to an institution; the rest have declared themselves independent researchers (57.4 per cent). This high proportion of non-affiliated members could correspond to users with little commitment to the site – they only contribute 31 per cent of documents – or are authors who simply prefer not to provide that information. It is also possible that these users do not belong to the scholarly community, but are professionals and other types of user not linked to the academic world. This fact would explain to some extent the elevated number of profiles.
Table 5.7, according to the institutional distribution of profiles, details the ten institutions with most users and publications. The University of Oxford is the organization with most members in the platform (0.6%), followed by the Universidad Nacional Autónoma de México (0.55 per cent) and the Universität Wien (0.51 per cent). It is interesting to note that there is only one American university (Harvard University) in the list, while three British universities take the top positions in the ranking (University of Oxford, University of Cambridge and University College London). It is also of note that among the ten universities with the most users there are two Indonesian universities (Universitas Gadjah Mada and Universitas Indonesia), which provides important evidence of the penetration of Academia.edu into this South Asian country. Another relevant fact is that there are no research centres or companies in the top organizations, which suggests that this product is of more interest to the scholarly community than to the scientific and professional or that non academic users are grouped under independent users. According to the items that organizations contribute to Academia.edu, British universities are those which post most documents, namely the University of Oxford (27,113), University College London (18,789) and the University of Cambridge (17,350). On the other hand, the Universitas Gadjah Mada (3,011) of Malaysia and the University of Indonesia (2,664) are the organizations with fewest papers. Overall, the geographical distribution of organizations across the five continents provides evidence that this service has achieved international status and attracts users from all parts of the globe.
Table 5.7
The ten organizations with the most profiles and publications in Academia.edu
| Organization | Profiles | Profiles % | Publications | Publications % |
| University of Oxford | 2,610 | 0.6 | 27,113 | 0.7 |
| Universidad Nacional Autónoma de México | 2,353 | 0.5 | 11,044 | 0.3 |
| University of Vienna | 2,212 | 0.5 | 11,787 | 0.3 |
| University of Cambridge | 1,781 | 0.4 | 17,350 | 0.5 |
| University College London | 1,564 | 0.4 | 18,789 | 0.5 |
| Universitas Gadjah Mada | 1,423 | 0.3 | 3,011 | 0.1 |
| Harvard University | 1,407 | 0.3 | 10,876 | 0.3 |
| Universidade de Sao Paulo | 1,403 | 0.3 | 12,401 | 0.3 |
| University of Toronto | 1,401 | 0.3 | 13,529 | 0.4 |
| University of Indonesia | 1,105 | 0.3 | 2,664 | 0.1 |
| Total | 430,494 | 100 | 3,734,011 | 100 |

Grouping each institution by its respective country, Table 5.8 shows the number of profiles and publications by country and the degree of penetration in each. In percentage terms, the United States (17.1 per cent) is the country with most profiles, almost twice the number the United Kingdom (8.9 per cent) and Indonesia (7.2 per cent). As seen with regard to organizations, the elevated presence of the Indonesian members is surprising. This fact is confirmed by Alexa (2015) and Easy Counter (2015) who put this South Asian country in top position with regard to web traffic into Academia.edu. However, the contribution of content is still led by western countries, primarily the United States (19.9 per cent) and the United Kingdom (10.4 per cent). On the other hand, countries with a strong presence in profiles show low contribution rates such as Indonesia (1.8 per cent) and Malaysia (1.2 per cent). If the penetration index is considered, there have been no data on Indonesia since 2005 (UNESCO Institute for Statistics, 2015), but nevertheless it may be imagined that this is the country which attracts most users. Mexico (3.74) and Malaysia (3.67) are the next countries by degree of penetration, followed by the United Kingdom (2.39), the country whence comes the creator of the site, Richard Price. These results confirm the wide spread of the service all over the world, mainly into South Asia and Latin America, while European countries describe a low presence, with the exception of Italy and the United Kingdom. This perception is confirmed with the Country Spreading indicator, which shows that Academia.edu (53.7 per cent) is the site with a smaller proportion of users from the ten first countries. It is possible that this massive presence of South Asian countries has only recently occurred, because previous studies make no mention of it (Menendez, de Angeli, & Menestrina, 2012). However, this important presence of developing countries is not accompanied by a similarly high contribution rate as western countries are still the most relevant contributors while developing countries supply only a small fraction of documents.
Table 5.8
Distribution of profiles and publications by country and penetration index in Academia.edu
| Country | Profiles | Profiles % | Publications | Publications % | Penetration |
| United States | 73,540 | 17.1 | 744,928 | 19.9 | 0.92 |
| United Kingdom | 38,293 | 8.9 | 389,160 | 10.4 | 2.39 |
| Indonesia | 31,079 | 7.2 | 65,439 | 1.8 | |
| Brazil* | 17,043 | 4.0 | 116,399 | 3.1 | 1.93 |
| India* | 15,544 | 3.6 | 95,316 | 2.6 | 1.26 |
| Italy | 12,543 | 2.9 | 217,505 | 5.8 | 1.85 |
| Malaysia | 11,052 | 2.6 | 44,220 | 1.2 | 3.67 |
| Mexico | 10,988 | 2.6 | 50,126 | 1.3 | 3.74 |
| Australia** | 10,884 | 2.5 | 129,180 | 3.5 | 1.84 |
| Canada | 10,419 | 2.4 | 117,858 | 3.2 | 1.04 |
| Total | 430,494 | 100 | 3,734,011 | 100 |

*2010.
**2008.
Academia.edu allows its users to select their academic positions from a predefined list or to add their statuses in an open form. This closed list presents a narrow university viewpoint with categories only applicable to university staff. This produces problems with assignation and many users opt not to put in any information (58 per cent) or insert their position in a free language rather than use Academia.edu’s classification (18 per cent).
Figure 5.14 shows the distribution of the main categories in Academia.edu’s status classification scheme. Faculty Member (32 per cent) and Graduate Student (25 per cent) are the scholarly categories most frequently found among Academia.edu users (Jordan, 2015; Nández & Borrego, 2013; Thelwall & Kousha, 2014). Department Member is the most frequent non-Academia.edu predefined category (11 per cent). In the case of Academia.edu, there is a slightly higher proportion of senior academics (43 per cent) (i.e. Faculty Member and Department Member) than students (35 per cent) (i.e. Graduate Student and Undergraduate), which suggests that there is a greater presence of established authors than young researchers. The significant proportion of Alumnus/a found (9 per cent) could point to the presence of professionals and other types of users that do not belong to the academic world.

Academia.edu counts the number of times that one profile is visited with the aim of valuing the impact that each author produces in her or his community network. Obviously, this interest is influenced by the number of documents that are included in each profile. Several studies have evidenced the correlation between documents posted and profile views (Ortega, 2015a; Thelwall & Kousha, 2014). In recognition of this, the network presents the most viewed profiles during a certain period of time, classifying them into several percentiles. Table 5.9 shows that the number of items is a strong factor in achieving high rankings, which in turn attracts more profiles and document viewings. Table 5.9 also describes the wide differences among users by percentile, thus, for example, a top 0.1 per cent user receives on average 21 times more views than a user in the bottom positions, when this top members contributes only four times more items.
Table 5.9
Distribution of average of items, document views and profile views by percentile in Academia.edu
| Percentile | Documents | Document views | Profile views |
| Top 0.1% | 39 | 51,611 | 2,690 |
| Top 0.5% | 27 | 17,055 | 1,708 |
| Top 1% | 25 | 9,309 | 1,431 |
| Top 2% | 23 | 5,746 | 1,147 |
| Top 3% | 23 | 3,627 | 975 |
| Top 4% | 22 | 2,626 | 825 |
| Top 5% | 21 | 2,005 | 702 |
| Null | 9 | 229 | 126 |

Figure 5.15 graphs the distribution of profile views by user, confirming the observations made with regard to Table 5.9. As with ResearchGate, this distribution starts with a paused power law up to 1,300 views (γ=1.28), ending with a pronounced decay from that number of views (γ=2.32). This final decay confirms the before results in Table 5.9 and explains how the addition of items greatly multiplies the number of profile views, causing the huge distance between the top users and the common. On the other hand, this also reflects an elevated activity in the site, with an average of 225 views per profile. This demonstrates that Academia.edu network maintains a highly active exploration of their profiles, being one of their most important actions on the platform. One of the possible reasons for this enthusiasm could be the large numbers of users that are here brought together, which increases hugely the interaction between them.

Analysing the date of the last activity in the network allows us to observe to what extent the actions of Academia.edu’s users are recent, thus discovering the percentage of inactive users. This would also indicate the degree of newness in the network and the energy of the users participating in the system.
To extract their recent activities and when they took place, 700,139 profiles were crawled. The results showed that 92.1 per cent of these members carried out some action during 2014–15, so it could be claimed that Academia.edu is in full activity, with a remaining insignificant percentage (7.9 per cent) of possible inactive profiles. However, this activity could be different according to the type of action performed. Figure 5.16 shows a Venn diagram where it is possible to group users with regard to their activities in the network. The results show that there are more users that follow other members (73.2 per cent) than members that post documents to the system (46.3 per cent). Figure 5.16(a) shows a high proportion of users that both follow colleagues and post items (40.1 per cent), which means that most of the people that post documents follow other users as well. However, this is not the same with followers where a significant proportion (45.2 per cent) of these does not post any document. This suggests that it is possible there are two different types of users: members that mainly follow other profiles and users that principally aim to upload documents. If the sample is restricted to users that follow most (>5 followings) and post most (>5 items), this pattern could more clearly be observed. Figure 5.16(b) describes a pattern of differentiation in which a reduced number of users (1.1 per cent) is very active posting and following. However, the great majority of the most active followers (95 per cent) do not post any documents, while the most important posters (70 per cent) barely follow anyone. This distinct attitude confirms that there is a large proportion of users that only follow the profiles of other authors, and on the other hand there are members only interested in uploading their research output.

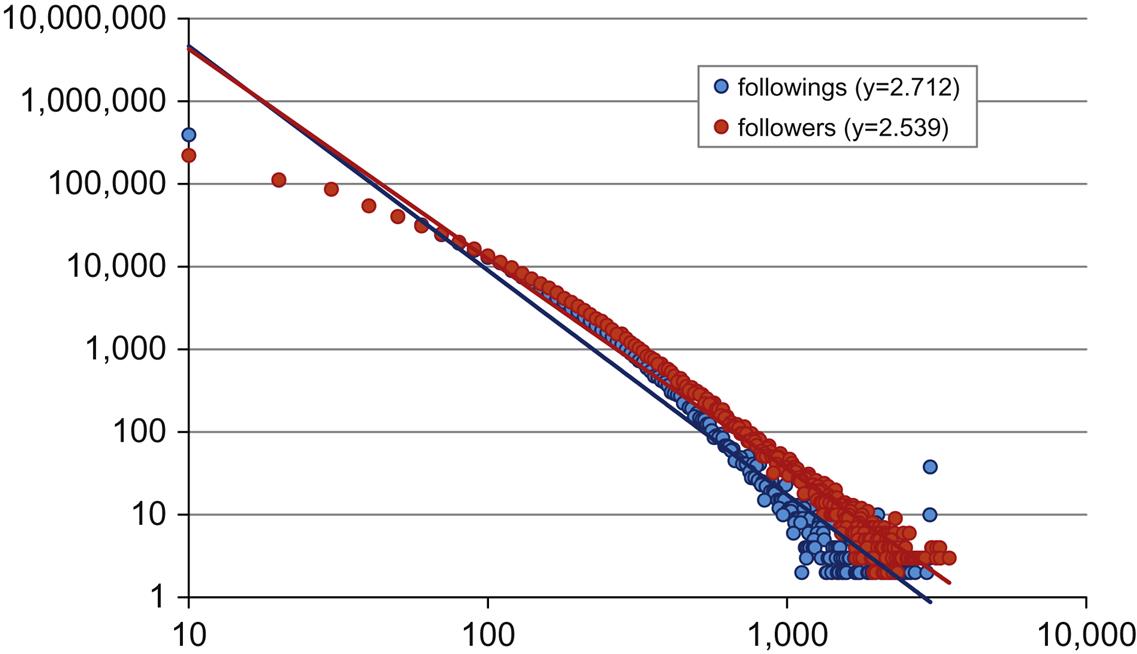
Finally, Figure 5.17 shows the distribution of followings and followers by user. As usual, these distributions follow a very pronounced power law trend, with the followings line (γ=2.7) a little more skewed than the followers line (γ=2.5). Although these differences are not significant, they verify the unbalanced distribution of contacts, in which a reduced proportion of users attracts most of the followers (6.7 per cent of users attract 45 per cent of the followers), while the largest proportion of users only achieve a few followers (65 per cent of users have less than 40 followers). It is the same with followings, which reinforces the fact that there are users focused only on following other members. In any case, the average number of followers (55.8) and followings (37.6) indicate a great deal of activity in this space with averages higher than in other networks.
5.2.2 Papers, an Unstructured Ragbag
Perhaps one of the characteristics that best describes Academia.edu is the possibility of hosting full-text documents in the profile of each user. This site does not establish any limitation on uploading materials, allowing the posting of articles, books, conferences, presentations, talks, etc. In this sense, Academia.edu maintains a full commitment to the Open Access movement and encourages the posting of any academic material on its platform. However, this practice could result in low-quality materials or even spamming practices whether there is no supervision of the content uploaded.
A sample of 688,000 items posted to Academia.edu was extracted from the site using a crawler in June 2015. Due to the assorted range of materials that can be uploaded and that the platform does not feed its system with references and metadata from other sites, Academia.edu does not contain a detailed description of their items. However, not all the documents accessible via Academia.edu are hosted in the platform. From the sample obtained, 404,000 (58.7 per cent) items corresponded to full-text documents, while 29.5 per cent of the records just showed an external link to the document, although not always to a full-text copy. This allows us to estimate that Academia.edu really contains no more than 4 million full-text documents.
Figure 5.18 describes the evolution of the number of documents uploaded to Academia.edu since 2011, the date at which Academia.edu made public the amount of items that had been added to the system. As with Profiles, the Archive.org WayBack Machine was used to obtain this information. The line shows an accumulative growth of items following almost a linear trend. In fact, the annual growth of papers (CAGR =43 per cent) is lower than that of users (CAGR =118 per cent). This unhurried pattern could be caused not only by the intrinsic required effort to write a paper, but also by the copyright limitations when a user comes to post it. The annual incorporation of documents includes a gap in 2013, where the number of papers is even lower than 2012. This anomalous data coincide with the conflict between Academia.edu and Elsevier (Clarke, 2013) the latter demanding the withdrawal of 2,000 documents because of copyright infringement. This could have distorted the counting of papers or provoked an in-depth revision of the copyright agreements of the entire database. However, in spite this one-time problem, the system shows good health with 2014 as the year in which most documents were posted than ever and with 2015 heading to improve on that figure.

However, In July 2015, the site contained only 6.1 million documents, a very low number for a population of 23 million users. This means that there is a ratio of 0.2 articles per person, which would indicate that the majority of users do not upload any documents. According to the distribution of items by user in the sample shown in Figure 5.19, only 46 per cent of members post any documents in the site, with 11.7 papers by user. Of these users, 84 per cent have less than 20 documents in their profiles, contributing only 33 per cent of all items. On the other hand, only 3 per cent of users post more than 50 items, 38 per cent of all the contents of Academia.edu. This unbalanced distribution would explain the low ratio of documents by user and confirm the strong presence of followers that scarcely post any documents at all.
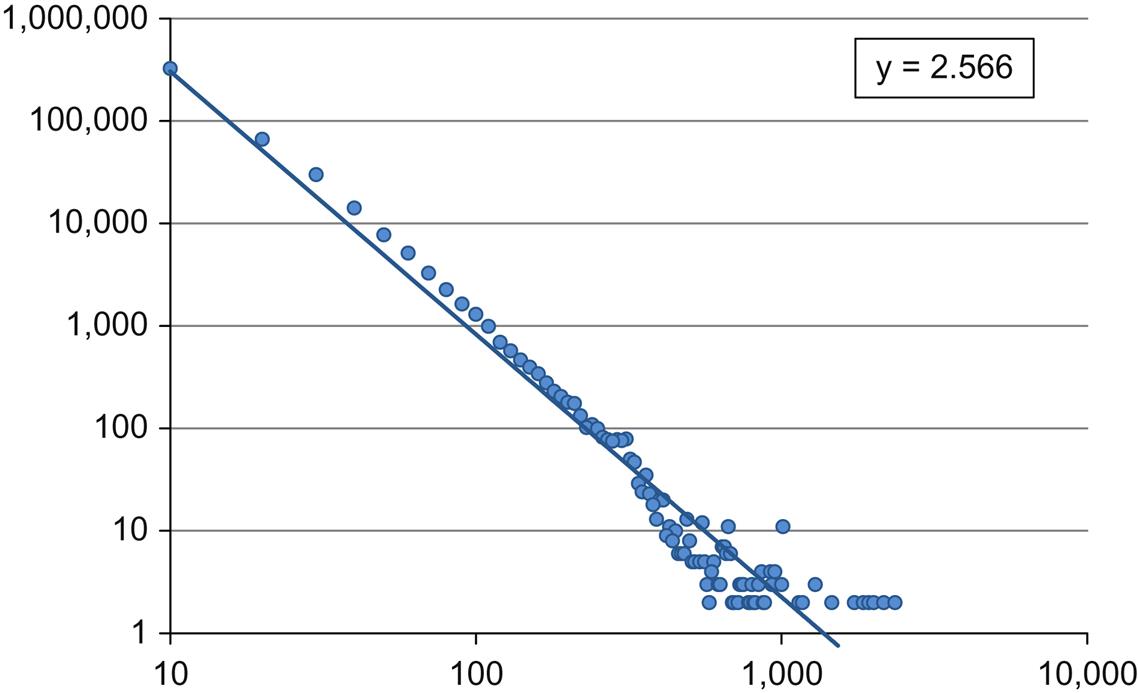
Figure 5.20 describes the distribution of views by document. In this case, the frequency graph follows a power law with a paused exponent (γ=1.68), suggesting the existence of a Zipf’s distribution. In this way, differences between a document’s views are not so extreme as that observed in citations or documents. Even so, 64 per cent of the papers are viewed less than ten times, while only a small fraction (0.07 per cent) of documents receives more than 10,000 views, 20 per cent of all the views in the sample. On average, each document is viewed 79 times.

5.2.3 Research Interests, Tagging the Content
Academia.edu goes back to a classical element from the social bookmarking sites to organize both users and documents by discipline. Research Interest is a type of tag or label that makes possible the thematic description of the content of each document. There is no limit when it comes to assigning a research interest to a document and, as tags, they are written in natural language, causing the well-known problems of duplicate concepts, multiple variations of the same issue and no hierarchical relationships between them. At the same time, these research interests are also used to group members under disciplinary communities interested in those kinds of documents. To some extent, research interest is a mechanism to put in contact users with documents, which increases the interaction among them and the viewing of documents.
As with Papers and Profiles, Academia.edu counts the number of research interests created in each point in time. Again using the WayBack Machine of Archive.org, Figure 5.21 presents the evolution of the number of research interests since 2011, the first moment in time for this data. In this case, the number of tags per year describes an irregular pattern with ups and downs but a constant incorporation of new research interests each year. In fact, the annual growth of research interests (CAGR =35 per cent) is the lowest in comparison with documents and users and the accumulated trend shows a linear behaviour. This is due to the reusing of existing research interests, which means that less and less new research interests are created, slowing down the rate of new keywords.

A sample of 510,216 research interests was extracted to quantify the distribution of subject matter of papers and users. Figure 5.22 shows the grouping of the first 500 research interests by four of the main research areas. The percentages provide evidence that Academia.edu is almost entirely occupied by users from Social Sciences and Humanities (71 per cent), with Physical Sciences researchers (22 per cent) second by far. This massive presence of humanities scholars and social scientists has been pointed out by several studies (Ortega, 2015b; Thelwall & Kousha, 2014) and indicates that Academia.edu may be developing into a specialist social network for those research areas.

Table 5.10 presents in more detail the ten most frequent research interests by both number of users and documents. Because there is no limit for users to select research interests, the total number of users assigned to these tags is 108 million, which means that one user selects on average 4.7 research interests. As with Figure 5.22, the distribution shows the predominant population of humanities scholars and social scientists, and with the exception of Computer Science (16.3 per cent), the top research interests are related to the Humanities and Social Sciences. Thus Economics (6.5 per cent), Social Sciences (5.5 per cent) and Education (4.5 per cent) are the research interests with most users. However, Almousa (2011) has warned that humanities scholars include twice the number of interests than chemists, so it is possible that this type of user could be over-represented. According to documents, the presence of Humanities and Social Sciences content is also predominant. Thus History (2.7 per cent), Social Sciences (2.4 per cent) and Economics (2.1 per cent) are the research interests most used to tag the content of the papers in Academia.edu. The proportion of research interests by item is half the size of profiles (2.3), which suggests that users utilise fewer tags to describe their publications than they do themselves. In line with this proportion, it is interesting to point out the different percentage distribution of research interests in users and documents. In the case of users the distribution is more concentrated, with the first ten categories having 35 per cent of the population. On the contrary, the labelling of documents is a little more spread out with percentages under three, suggesting that users tend to tag themselves with generic terms while their documents are described with more specific keywords.
Table 5.10
Distribution of profiles and documents by Research Interest in Academia.edu
| Research Interest | Users | Users % | Research Interest | Documents | Documents % |
| Economics | 7,053,422 | 6.53 | History | 388,193 | 2.76 |
| Social Sciences | 5,949,675 | 5.51 | Social Sciences | 336,373 | 2.39 |
| Education | 4,899,775 | 4.54 | Economics | 292,751 | 2.08 |
| Computer Sciences | 3,741,377 | 3.46 | Political Science | 229,398 | 1.63 |
| Engineering | 3,623,349 | 3.35 | Anthropology | 215,466 | 1.53 |
| History | 3,256,982 | 3.01 | Education | 199,848 | 1.42 |
| Political Science | 2,729,713 | 2.53 | Engineering | 156,903 | 1.12 |
| Philosophy | 2,376,358 | 2.20 | Philosophy | 150,019 | 1.07 |
| Anthropology | 2,177,251 | 2.02 | Entertainment and Arts | 147,596 | 1.05 |
| Psychology | 1735086 | 1.61 | Computer Sciences | 140,918 | 1.00 |
| Total users | 108,036,865 | 100 | Total | 14,062,923 | 100 |

5.2.4 Viewers or Producers Network?
Academia.edu represents a different approach to the sharing of documents, the priority of which above all is the spreading of the results. Although this policy has led to conflict with the major publishing houses, the platform understands that the open and immediate diffusion of academic content is imperative for the progress of science at all levels. This policy has favoured strong implantation in many developing countries, particularly in South East Asia, where scholars have serious problems accessing mainstream scientific literature. It is then possible that Academia.edu is attracting users from these developing countries, moved perhaps by the need to have access to free scientific results. On the other hand, the thematic distribution of profiles has confirmed that Academia.edu is likely to become a specialist network for humanities scholars and social scientists (71 per cent) because they exceed the distribution of profiles and publications. However, there is nothing to suggest that this site was designed solely for the humanities, so this preference only could be explained by the attraction that humanities scholars already registered in the site exert over the new users.
Nevertheless, as a bibliographic repository, Academia.edu presents important technical limitations when it comes to posting documents. The principal limitation is that Academia.edu does not gather the item’s metadata in a normalized form, which it makes difficult the indexing of the content in search engines and the proper description of their difficult. This fact greatly limits the visibility of the uploaded documents and could be a serious drawback for the future of the site, because the major attraction of a document sharing site for a scholar is its ability to spread research results. Another limitation is that most of the uploaded documents are not published materials, but in many cases are pre-prints, data sets, reports and drafts that are not peer reviewed and therefore could lack enough quality for scientific research. Although the proportion of these low-quality materials has not been estimated, a manual inspection of the sample suggests that this type of materials has an important presence. Nor does Academia.edu extract citations from the posted documents, making the measurement of the impact of these publications impossible and restricting its power as a research evaluation tool. From this point of view, it is recommended that Academia.edu takes good care of these issues, because these platforms are not just used as social networking sites, but are mainly considered as high-quality information resources for the scholarly community.
In particular, according to the activity of the users in the network, it can be recognized that the members tend to ‘specialize’ in two types of profiles, those that follow the publications of other users and those that prefer uploading their own outputs. Even though these actions can be done simultaneously, the results suggest that in many cases they are opposed activities which provides evidence of the existence of users with different needs. Thus it may be observed that users who provide few materials may follow many people. These scholars could be considered viewers that use the platform only as an information resource, following a great number of profiles and research interests in order to stay up to date on a variety of disciplines and authors. On the other hand, producers are those users that mainly post their research outputs without making many contacts, waiting to observe the use and impact of their materials in the academic network. This fact would explain, for instance, that a network of 23 million users only produces 6 million of papers, a very low proportion (only 46 per cent of users post any item) that suggests that only a small fraction of users are great producers (3 per cent of users contribute 38 per cent of the content), while the rest are principally registered to read and download these articles. Another relevant fact that sheds light on the disproportionate number of profiles and the duality of roles is that 57.4 per cent of users declare themselves to be independent. This could mean they are non-academic members who do not belong to any academic institution and therefore their scientific production is low or non-existent. It is possible, then, that these users are just viewers who take part by following and searching the academic results of the researchers, who acquire the role of producers (Menendez et al., 2012). At the same time, this would explain the skewed distribution of followers and following, pointing to the presence of a reduced number of highly productive researchers that attract a large number of non-academic users that follow these members as the only way to keep up to date.
In general, Academia.edu presents very positive performance indicators, with an exponential increase in new users (CAGR =118 per cent) and documents (CAGR =43 per cent) that ensures the continuity of the service and the growth of the full-text repository. This fact should oblige it, even more, to improve its information architecture (i.e. metadata) and metrics (i.e. citations) to be competitive in the long-term. On the other hand, the high activity ratio of this site, with 92 per cent of users posting and following during 2014–15, demonstrates a highly dynamic network with an energized community, although the massive presence of humanities scholars and others from developing countries could threaten to transform this site into a marginal location.
5.3 Towards the Complete Academic Networking Site
Document sharing systems have been shown to be the most successful platforms in the current panoply of scholarly networking sites. The growing rate in both users and content, along with the energized activity of their networks, have shown that this type of service enjoys good health and is catching more and more the attention of the academic community. This promising behaviour predicts a leading presence for these services and suggests that the future of social networking sites is going in the direction of the sharing of documents as a central element in these spaces. This success could be related to the Open Access movement and the search for alternative ways to publish having found in these services a promising instrument for the spreading of academic results. Moreover, as has been seen in the case of Academia.edu, these sites can present a revolutionary vehicle to diffuse content by a part of academic communities under-represented in the main scientific information sources (i.e. humanities scholars) and by researchers with difficulties in accessing the main publishing channels (i.e. scholars from developing countries). In this way, document sharing systems go beyond being a mere social networking place, but are defined as real academic media that are attempting to gather together all the essential elements of scientific communication. It is not surprising that ResearchGate acts as a publisher with its own DOI, incorporates a reward system with usage and impact indicators, and introduces peer-review through Open Review. All these elements assembled on the same site suggests that the ultimate purpose of these new platforms could be to create a new and self-sufficient communication system, independent of the traditional publishing houses, based on free and open access to the academic literature, a post hoc peer-review system and an evaluation system supported on both impact and usage.
From the viewpoint of research evaluation and considering their possibilities for an alternative academic publishing system, there are several topics to be discussed that could question their viability. The first is that the quality of the posted materials tends to be low because many are not peer-reviewed. However, in the case of ResearchGate, 81 per cent of the full-texts correspond to journal articles, of which many have been reviewed. On the other hand, Academia.edu does not distinguish journal articles, although it is estimated that there is a large proportion of unpublished material. Another problem could be the incomplete citation count. While it is true that ResearchGate only extracts citations from full-text papers (24 per cent), the exponential increase in new full-text copies (49 per cent paper published from 2012) predicts a greater and greater degree of completeness. In addition, the simultaneous measurement of usage statistics would supply this deficiency, acting as proxy for research impact. Unfortunately, Academia.edu does not extract citations from their papers, which is a serious drawback for research evaluation purposes. Finally, ResearchGate also introduces an online procedure for post hoc review of uploaded materials (Open Review), which allows criticism of irrelevant and fraudulent papers. However, Academia.edu also lacks of any type of reviewing or commenting system. Thus whereas ResearchGate is working towards being an alternative to the traditional publishing system, Academia.edu is at present just a platform for uploading papers and tracking their usage.
However, unlike on other academic social sites, users have a natural limitation when they come to contribute content. In a social bookmarking and reference management site, users can post and tag as many items as possible, but the users of document sharing sites can only be active members inasmuch as they are scientific producers. Thus the users uploading the most papers to the system are the authors that most academic documents publish as well. This would explain why the presence of young scholars is not as high as in other social sites, because the scholars who have accumulated the most output are senior researchers. On a different tack, this particular limitation could result in different roles among the users. As was observed in Academia.edu, it is possible that many users are just viewers following and watching the production of other users, while a small number of members, the producers, only utilise the platform to publish their results and track their impact and usage. Somehow, these different roles demonstrate that these online sites can be used for different purposes addressed to satisfy the personal needs of each user. On the one hand, they spread and boost the research activity of the producers, while at the same time acting as an information resource for the majority of the viewers.
As has been said, all this publishing activity is supported by a frenetic social environment, with the best activity rates and the greatest averages of followers and followings. In fact, it is surprising that both sites are preferred more for contacting other colleagues (more than 60 per cent) than for discovering or posting content (below 40 per cent) (Van Noorden, 2014), when the principal objective of these platforms is to become a channel for spreading scientific literature. It is even more astonishing when these sites lack public collaborative tools (with the exception of Questions & Answers of ResearchGate) such as groups or forums that promote partnership among users. On the other hand, following is the only action available to contact other users. However, it is possible that many users follow their partners, not in order to socialize, but as a way to locate valuable information, which would explain the results of Van Noorden (2014). It may be that users search for information following the posts of other relevant colleagues, determining in this way their relevance by authority criteria. This hypothesis is supported by the poor searching functionalities of these sites, with just a simple search window that does not distinguish authors from titles, journals, organizations or keywords, nor do they permit advanced queries to retrieve precise information. Related to this inability to search information could be the absence of groups, the main collaborative tool in other types of academic social sites. In their place, Topics (ResearchGate) and Research Interests (Academia.edu) work as keywords that group profiles and documents, through which it is possible to browse the content hosted in the platform. In this way, this elevated networking activity could really be covering up a serious problem of information searching, instead of being a reflection of collaborative behaviour.