
Phase Selection in High-Entropy Alloys
The high mixing entropy of high-entropy alloys usually leads to the formation of disordered or partially ordered solid solutions in these alloys. It has been observed that disordered solid solution formation in such alloys happens, when elements with similar chemical nature and atomic size are chosen to form the alloys. If the constituent elements in these alloys have significant differences in terms of their atomic sizes or chemical nature, there is a tendency to form partially ordered solid solutions, or even stoichiometric compounds. Under certain conditions, amorphous phases might form. The present chapter attempts to rationalize these observations in terms of various approaches that were developed starting from the Hume-Rothery rules.
Keywords
Hume-Rothery rules; parametric approach; enthalpy of mixing; mismatch entropy; Pettifor maps
3.1 Predicting Solid Solubility from Hume-Rothery Rules
HEAs are essentially multicomponent equi-atomic or near equiatomic alloys which form mostly solid solutions including random solid solutions and partially ordered ones. In a few cases they form amorphous alloys. The results from the large number of papers published in this field indicate that the formation of a single-phase solid solution in these alloys is decided to a large extent by the proper choice of elements used for making the alloy.
This takes us back to Hume-Rothery (H-R) rules that were deve-loped to identify conditions for any element to be soluble in another (Hume-Rothery, 1967). In the 1920s, Hume-Rothery identified the factors that influence compound formation and control alloying behavior, after surveying the available solubility data in detail. He identified that there is a connection between solubility and factors including atomic size, crystal structure, valence, and electronegativity of the two components of an alloy. In spite of a number of other researchers attempting to address this question of solubility, the simplicity and generality of H-R rules have become one of the important cornerstones in materials science (Massalski, 1989). The H-R rules for binary substitutional solid solutions are generally stated as follows (Smith and Hashemi, 2006):
1. The radii of the solute and solvent atoms must not differ by more than about 15%: For complete solubility, the atomic size difference should be less than 8%.
2. The crystal structures of the two elements must be the same for extended solid solubility.
3. Extended solubility occurs when the solvent and solute have the same valency.
4. The two elements should have similar electronegativity so that intermetallic compounds will not form.
These rules need revisiting in the context of multicomponent solid solutions, when interactions among the different components need to be taken into account.
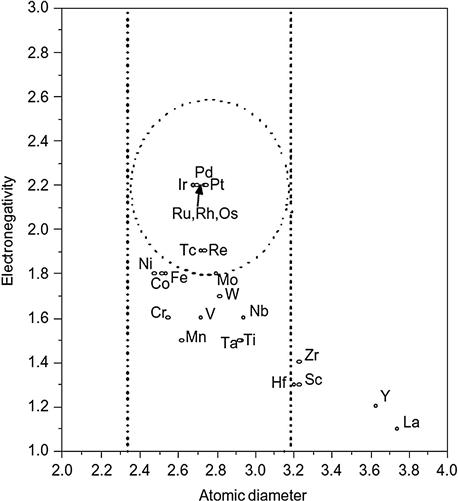
H-R rules were given with a diagrammatic representation by Darken and Gurry (1953) (DG method), wherein they plotted the electronegativity and atomic size factor in a 2D map and identified an ellipse with atomic size factor of ±15% and electronegativity difference of ±0.4 to separate soluble elements from insoluble ones. They applied this to Mg, Ag, and Al systems and found that this approach worked well for Mg alloys systems but not for the Ag systems. Figure 3.1 shows such a Darken-Gurry map for Pd as a solvent (Fang et al., 2002). Gschneidner (1980) extended the DG method by introducing crystal structure (electronic crystal structure Darken–Gurry method, ECSDG) and was able to show improvement in the prediction of extensive solubility in different solvents (Mg, Al, Fe, Ge, Pd, Ag, Cd, La, W, and Pb) in comparison to DG method.
In 1970s Miedema and his coworkers (Miedema, 1973) were able to successfully calculate heats of formation of intermetallic alloys using two parameters namely, electronegativity difference (Δϕ*) and the difference in electron density at the boundary of the Wigner–Seitz cell (Δnws) of pure metals. Chelikowsky (1979) introduced graphical representation of these two parameters to predict the solubility in case of divalent solvents and demonstrated better prediction capability. Alonso and Simozar (1980) extended this approach further by bringing in the atomic size also into the picture in addition to electronegativity and electron cell-boundary density and explained the degree of solubility of different elements in a given host element with a fair degree of success. This approach uses the combination of electronegativity and electron density into single parameter, ΔHc (the heat of formation of an equiatomic compound), as proposed by Miedema, as given below:
where P, Q, and R are constants.
Incidentally, all these early efforts were restricted to binary and to some ternary systems.
3.2 Mutual Solubility and Phase Formation Tendency in HEAs
In the very beginning of exploring HEAs in 1995, around 40 equiatomic compositions were tried. The alloy design was mainly based on the common elements (Huang and Yeh, 1996). The selection of elements avoided those such as Pb, Sn, and Bi which are chemically incompatible with some transition metals. Volatile elements, expensive rare elements and noble metals were also not considered. The equiatomic composition was used in each case as it would give maximum mixing entropy to enhance the mixing of constituent elements. Three categories of alloys, namely, Cu-containing, Al-containing, and Mo-containing were prepared using this approach. In the Cu-containing alloys, Co, Cr, and Pd were added into CuTiVFeNiZr alloy successively to generate septenary, octonary, and nonary alloys. Cu has weaker bonding with some transition metals and is even repulsive to Cr, Fe, and Co. In the Al-containing alloys, with similar additions to AlTiVFeNiZr alloy, Al could increase the bonding energy by its strong bonding with transition elements. In the Mo-containing alloys, similar additions to MoTiVFeNiZr alloy, Mo could increase Young’s modulus because of its much higher modulus. From this first study, it led to a valuable observation that there is high-entropy effect which enhances the mixing of elements since no complicated structures were found. In the early publications, the discussion on the formation of phases were also based on atomic size difference, crystal structure, formation enthalpy of unlike atomic pairs, H-R rules for binary systems, and slower kinetics (Ranganathan, 2003; Yeh et al., 2004b; Tong et al., 2005b; Yeh, 2006). By discussing the EDS compositions of phases and considering the atomic size, electronegativity, crystal structure, and chemical valence of all composing elements of AlxCoCrCuFeNi alloys (x=0–3.0), Tong et al. (2005b) concluded that the high mixing entropy effect could enhance the formation of simple solid solution phases rather than intermetallic compounds and terminal solid solutions, and relax H-R rules. However, in the early development of HEAs no quantitative criteria and approaches existed to predict the solid solution formation in these multicomponent alloys that could lead to the best choice of elements in alloy design. Recent efforts utilizing more scientific criteria and approaches are dealt with in this section.
3.3 Parametric Approaches to Predict Crystalline Solid Solution and Metallic Glass
HEAs were developed much later than metallic glasses. HEAs and metallic glasses are all multicomponent. Furthermore, HEAs are quite close to bulk metallic glasses (BMGs) in highly concentrated compositions. The main difference is that BMGs are based on a single major component (>40 at.%). There have been some attempts to correlate the tendency of solid solution formation and glass forming ability (GFA). It is instructive to compare the criteria in predicting their formation.
3.3.1 Criteria for Glass Formation
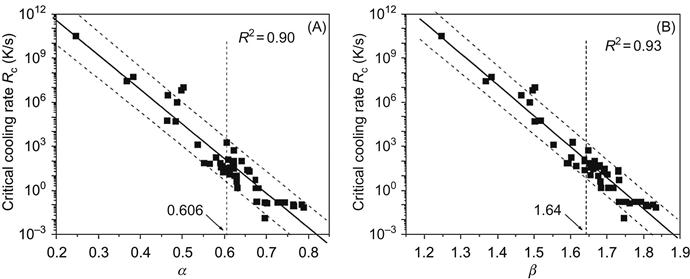
The first attempt to rationalize metallic glass formation in alloys was by Turnbull (1969), a decade after the seminal discovery of metallic glass by Pol Duwez (Klement et al., 1960) in Au![]() Si alloy. Turnbull (1969) suggested a parameter, reduced glass transition temperature Trg (=Tg/Tl), where Tg and Tl are glass transition temperature and liquidus temperature, respectively, as a measure of GFA of an alloy. Alloys with Trg greater than 0.6 are identified as good glass formers. Among a number of other, ΔTx (=Tx−Tg) (Inoue, 1995) (where Tx is crystallization temperature of glass), γ (=Tx/(Tg+Tl)) (Lu and Liu, 2002), α (=Tx/Tl), and β (=(Tx/Tg)+(Tg/Tl)) (Mondal and Murty, 2005) have become very popular. Figure 3.2 demonstrates the success of α and β parameters in identifying good glass forming compositions among about 50 different alloys. α parameter, in particular, has the advantage that it can be applied even to those glasses which do not show clear Tg as it is very close to Tx.
Si alloy. Turnbull (1969) suggested a parameter, reduced glass transition temperature Trg (=Tg/Tl), where Tg and Tl are glass transition temperature and liquidus temperature, respectively, as a measure of GFA of an alloy. Alloys with Trg greater than 0.6 are identified as good glass formers. Among a number of other, ΔTx (=Tx−Tg) (Inoue, 1995) (where Tx is crystallization temperature of glass), γ (=Tx/(Tg+Tl)) (Lu and Liu, 2002), α (=Tx/Tl), and β (=(Tx/Tg)+(Tg/Tl)) (Mondal and Murty, 2005) have become very popular. Figure 3.2 demonstrates the success of α and β parameters in identifying good glass forming compositions among about 50 different alloys. α parameter, in particular, has the advantage that it can be applied even to those glasses which do not show clear Tg as it is very close to Tx.
Until late 80s glassy structure in metallic alloys was obtained only in some binary and ternary alloys, which did not possess high GFA. Hence these alloys needed to be rapidly solidified at cooling rates of the order of 106 K/s to induce glass formation, thus restricting the thickness of these metallic glasses to a few tens of microns. Inoue’s group has pioneered research on BMGs from late 1980s that has led to the development of large sized glasses of up to 3″ diameter with extremely high GFA (Inoue et al., 1989).
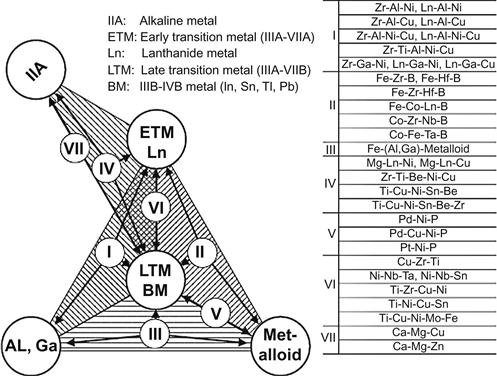
Metallic glasses with a critical thickness of larger than 1 mm are usually referred to as BMGs. In an attempt to identify the conditions required for an alloy to form a BMG, Inoue (1996) suggested three empirical rules. These are namely, (1) a multicomponent alloy with at least three components, (2) large negative enthalpy of mixing among the major constituent elements, and (3) atomic size difference larger than 12% among the main constituent elements. Among these the first criterion is related to kinetics suppression of crystal formation from liquid and it is usually referred to as “confusion principle” (Greer, 1993). The second criterion is related to the thermodynamic stabilization of the liquid, which is reflected in the form of deep eutectics in phase diagrams. The third criterion is related to topological aspect of formation of dense random packing, which is the nature of packing observed in glass. Based on these rules, Takeuchi and Inoue (2005) were able to classify the BMG alloys into seven groups consisting of five chemical types of elements (Figure 3.3). Interestingly out of these three rules, the last two are against the solid solution formation emphasized in HEAs.
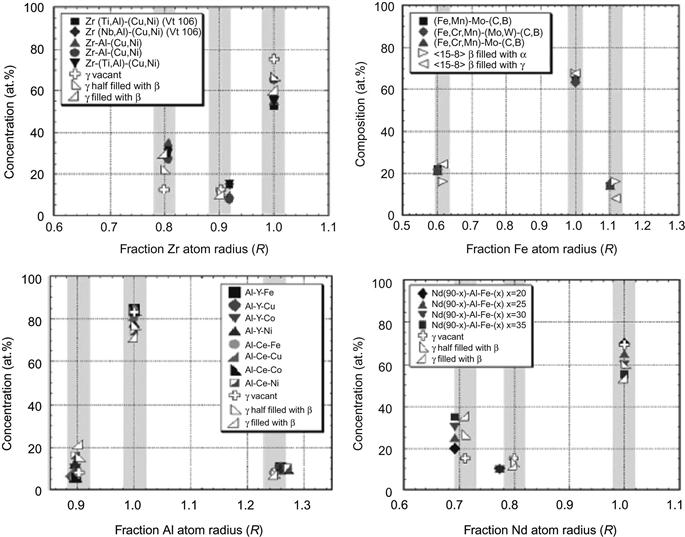
A large negative enthalpy of mixing ensures ordering and hence cannot stabilize random crystalline solid solution. Similarly, a large size factor is against the H-R rule for the solid solution formation and hence would destabilize a crystalline solid solution and enhance the GFA. The topological approach to glass formation is largely due to the work of Egami and Waseda (1984) and Miracle (Senkov and Miracle, 2001). Miracle (2006) has been able to identify glass forming composition ranges for a variety of classes of glasses based on the topological approach (Figure 3.4), where they suggest that a good glass forming system should have certain fractions of large-, small-, and intermediate-sized atoms.
Early thermodynamic efforts to evaluate GFA used enthalpy of mixing obtained from Miedema calculations, originally demonstrated in binary systems and later extended to multicomponent systems, to separate solid solutions from amorphous phase formation domains. Figure 3.5 shows such an effort in case of Ti![]() Ni
Ni![]() Cu system (Murty et al., 1992) for identifying ternary compositions that can lead to amorphous phase formation. These results were found to be close to those experimentally obtained by MA in this system.
Cu system (Murty et al., 1992) for identifying ternary compositions that can lead to amorphous phase formation. These results were found to be close to those experimentally obtained by MA in this system.
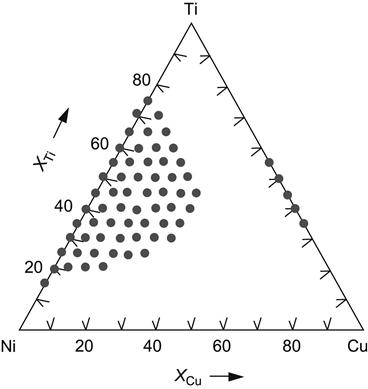
 NiCu system (Murty et al., 1992).
3.3.2 Thermodynamic Parameters to Predict the Formation of Solid Solution and Metallic Glass
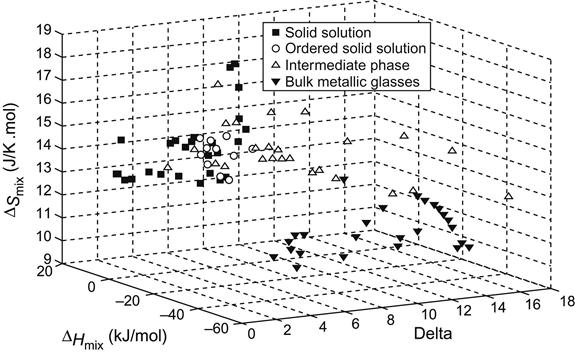
Thermodynamics parameters like enthalpy of mixing (ΔHmix), entropy of mixing (ΔSmix), and topological parameters like δ (Zhang et al., 2008b) and mismatch entropy (ΔSσ) were used (Takeuchi et al., 2013a) to demarcate the BMG and solid solution formation conditions in multicomponent alloys. Zhang et al. (2008b) showed that simple solid solutions form in alloys with parameters satisfying the criteria: −20≤ΔHmix≤5 kJ/mol, 12≤ΔSmix≤17.5 J/K mol, and δ≤6.4% (Figure 3.6). When only disordered phases are allowed, the criteria are more restrictive, requiring a smaller negative limit of ΔHmix (≥−15 kJ/mol) and a smaller δ (≤4.6%).
Here δ is defined as
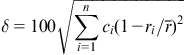
wherein ci and ri are composition and atomic radii of ith element and ![]() is the average atomic radius.
is the average atomic radius.
Later, they used another thermodynamic parameter for prediction of solid solution formation as (Zhang et al., 2012c; Yang and Zhang, 2012):
where ![]() is the hypothetical melting temperature calculated according to the rule of mixtures. They placed a new criterion that simple solid solutions form when Ω≥1.1 and δ≤6.6% (Zhang et al., 2012c).
is the hypothetical melting temperature calculated according to the rule of mixtures. They placed a new criterion that simple solid solutions form when Ω≥1.1 and δ≤6.6% (Zhang et al., 2012c).
Guo and Liu (2011) pointed out that ΔHmix, atomic size difference (δ) and mixing entropy (ΔSmix) should all be used together to identify solid solution formation. They suggested that solid solution is expected if all the three parameters satisfy the conditions of −22≤ΔHmix≤7 kJ/mol, 0≤δ≤8.5, and 11≤ΔSmix≤19.5 J/K mol. They identified that atomic size difference is the critical parameter for identifying solid solution and BMG forming HEAs. They suggested that BMGs form when −49≤ΔHmix≤−5.5 kJ/mol, δ≥9, and 7≤ΔSmix≤16 J/K mol.
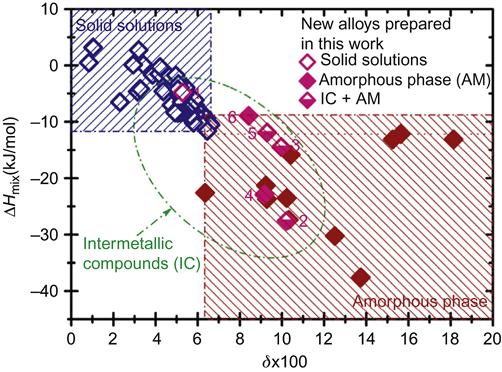
Guo et al. (2013a) used 2D maps of ΔHmix and δ to identify the conditions for the formation of solid solutions, intermetallics, and amorphous phases in HEAs as shown in Figure 3.7. They pointed out that solid solutions can form when δ≤6.6 and −11.6<ΔHmix<3.2 kJ/mol. The amorphous phase can form when δ>6.4, and ΔHmix is significantly negative (ΔHmix<−12.2 kJ/mol). In a similar study, Ren et al. (2013) have identified the conditions for solid solution formation in HEAs as δ≤2.77 and ΔHmix≥−8.8 kJ/mol. Although the above criteria have some inconsistence between them, they basically are useful guidelines to design compositions with disordered and/or ordered solid solutions.
Wang et al. (2009a) and Sriharitha et al. (2013) observed a conversion from FCC structure to BCC when the Al content in AlCoCrCuFeNiTi and AlCoCrCuFeNi is increased. Wang et al. (2009a) attributed this to lattice distortion which destabilizes the close-packed FCC structure. Guo et al. (2014) have also observed that the solid solution decomposes when the lattice distortion crosses a value of 0.018 and this was observed when the number of elements increased to four and five when they studied Ni, CoNi, CoFeNi, CoCrFeNi, and CoCrCuFeNi. A close observation of their results suggests that the decomposition is actually observed only for the quinary alloy and the second FCC phase that is observed in this case is possibly due to the segregation of Cu, due to its positive ΔHmix with Fe and Cr. Thus, it is important to have an unbiased study while identifying the conditions that lead to certain phase formation in HEAs. Singh and Subramaniam (2014) have also pointed this out recently based on a detailed assessment of the results of a number of ternary, quaternary, and quinary equiatomic alloys.
In contrast to the above observations, Otto et al. (2013b), based on the individual substitutions of different 3D and 4D transition elements to a quinary alloy (CoCrFeMnNi), found that it is the free energy minimization that decides the phase formation and neither ΔSmix nor ΔHmix can decide this independently. Thus, attempts to maximize configurational entropy alone do not lead to the formation of single-phase solid solutions and one needs to consider the interactions between the elements, attractive or repulsive, that can lead to intermetallics or phase separation. In addition, atomic size difference also can play a crucial role, particularly in deciding the phase formation between crystalline solid solution and amorphous phases.
As for mismatch entropy which concerns with the atomic size difference among composing elements, Takeuchi et al. (2013a) had calculated it through the following equations:
where
ρ is packing fraction (0.64 for dense random packing). y1, y2, and y3 are dimensionless parameters, expressed as
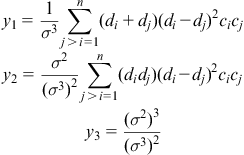
where
where di is the atomic diameter of ith component.
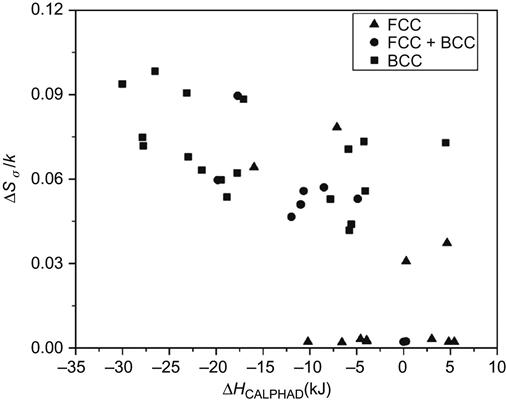
The analysis of a large number of HEAs (Raghavan et al., 2012) indicates that solid solution formation in multicomponent alloys is favored when the ratio of ΔSconf/ΔSfusion is greater than 1 and 1.2 for equiatomic and nonequiatomic alloys, respectively. The results also point out that BCC phase is favored when the atomic size difference is larger, which is reflected by a higher value of mismatch entropy (ΔSσ/k) as shown in Figure 3.8. FCC phase appears to form only when the mismatch entropy (ΔSσ/k) is very small and the ΔHmix is close to zero. This indicates that close-packed structures get stabilized when the system follows H-R rules and hence is close to ideal solution. In contrast, BCC phase gets stabilized when the mismatch entropy (ΔSσ/k) is very large and the ΔHmix is more negative, indicating that open structures (BCC) can accommodate more strain and also nonideality.
Bhatt et al. (2007) have used the product of ΔHmix and Sσ/kB (PHS) to effectively identify the compositions that are best glass formers in ternary and quaternary systems. However, this parameter was not found to be that effective in predicting the best glass forming composition in quinary and other higher order systems. However, when the configuration entropy is also considered in the form of a new parameter (PHSS), which is a product of ΔHmix, Sσ/kB, and ΔSconf, the prediction is found to be better. A more negative PHSS value was found to lead to higher GFA in multicomponent systems (Rao et al., 2013).
Takeuchi et al. (2013a) statistically analyzed and compared the plots between ΔHmix versus Sσ/kB and ΔHmix versus δ for 6150 ternary amorphous alloys from 351 systems. They found the relationship of Sσ/kB~(δ/22)2 between mismatch entropy and atomic size difference. This again confirms that atomic size difference and mismatch entropy are basically correlated with each other. In the comparison of the plot for HEAs, BMGs and high-entropy BMGs, they found that new HEAs with simple solid solution may occur when −50 kJ/mol≤ΔHmix≤−40 kJ/mol, and 6≤δ≤10. The evidence is the Al0.5CuNiPdTiZr alloy with BCC single structure falling in this region. Thus, they provide a possible opportunity to design simple solid solution in difference regions.
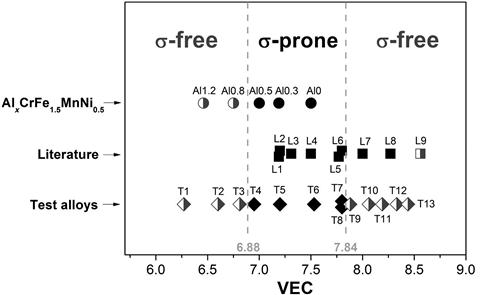
Guo et al. (2011) found that the valence electron concentration (VEC) is the critical parameter for determination of BCC and FCC phase formation in HEAs. FCC phase forms when VEC≥8 whereas BCC phase forms when VEC<6.87. FCC and BCC coexist in between. This criterion is interesting since the FCC stabilizers or formers such as Co and Ni have VEC=9 and 10, whereas BCC stabilizers such as Al and Ti have VEC=3 and 4, respectively. That implies that more FCC elements tend to form FCC phase. Tsai et al. (2013c) have used this approach to delineate the σ phase formation domain based on the phases formed after aging of a number of HEAs (Figure 3.9). The side and central domains indicate the absence and presence of σ phase after aging, respectively. The aging condition for the AlxCrFe1.5MnNi0.5 alloys and the test alloys is 700°C 20 h, while the rest of the alloys are collected from the literature. This criterion could be combined with Guo’s criterion to reveal the tendency of FCC and BCC phase to form σ phase during aging or annealing at intermediate temperatures between about 600°C and 1000°C.
3.4 Pettifor Map Approach to Predict the Formation of Intermetallic Compound, Quasicrystal, and Glass
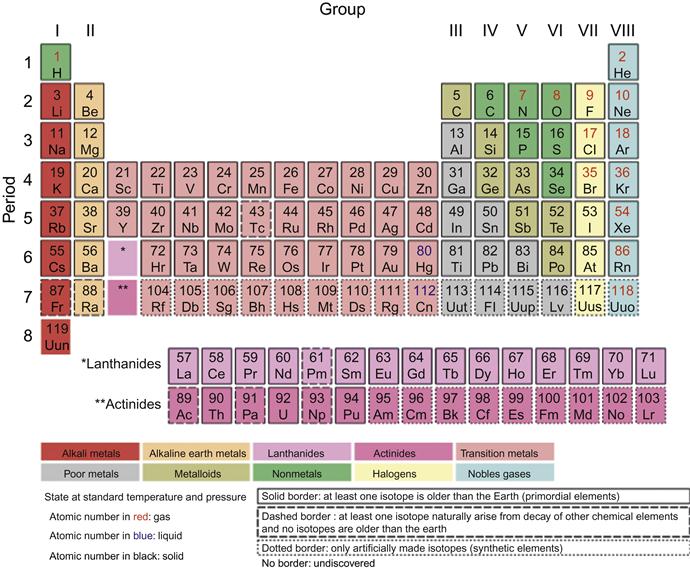
Alloying is a powerful method for changing the structure of the materials. The structure of alloys can be broadly categorized into four different types: crystalline solid solution, crystalline intermetallics, quasicrystalline intermetallics, and glass. The ability to predict the structure of a material is one of the fundamental challenges of materials research. The original H-R rules for the mutual solubility of two components include three factors: atomic size, electronegativity, and valency. Therefore, it is possible to predict the extent of solid solutions by considering these three factors. Pettifor (1984) has pioneered the structure of binary crystalline intermetallics. He has added a fourth factor of bond orbitals along with size, electronegativity and valency and has created a chemical scale. In this chemical scale, each element in the periodic table is assigned a unique number called the Mendeleev number. The Mendeleev number is a phenomenological coordinate used by Pettifor, which is determined by running a 1D string through the 2D periodic table (Figure 3.10 and 3.11). The path of the string is chosen in such a way to give best structural separation of AB compounds. Therefore, elements which are neighbors in their atomic numbers could have very different Mendeleev numbers and elements with different atomic numbers could be neighbors with respect to their Mendeleev numbers. This single number can be used to differentiate various structures.
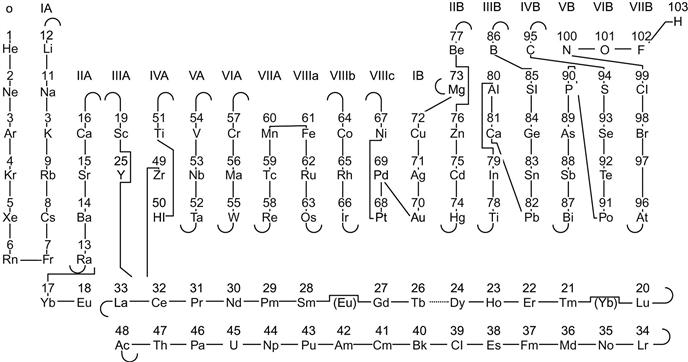
Based on this concept a map is constructed and boundaries are drawn to separate compounds of different structure types. Bare patches in the map show the regions of positive heats of formation, which correspond to binary nonformer. Pettifor (1988) has also shown that the structure mapping approach can be used to predict the structure of ternary and quaternary compounds by treating them as pseudobinaries (Pettifor, 1988). He has used the method of calculating average Mendeleev number for this prediction. If AxBy is considered as the binary alloy and ternary and quaternary additions C and D preferentially go the A and B sites, respectively, then the alloy can be treated as a pseudobinary alloy (AxC1−x) (ByD1−y). The pseudobinary alloy is characterized by the average Mendeleev numbers M*A and M*B which are given by M*A=xMA+(1−x)Mc and M*B=yMB+(1−y)MD. This simple scheme shows that the structural domains of pure AB and AB3 binaries are similar to that of the pseudobinaries.
Nearly 20 years after the advocacy of this structure mapping approach, Villars et al. (2001, 2004) used the Mendeleev number for the prediction of former/nonformer in any binary, ternary, and quaternary systems (Figure 3.12). They reported that the Mendeleev number is a highly effective parameter as compared to the atomic number for this structure prediction method.
Jeevan and Ranganathan (2004) used the Pettifor pseudobinary structure mapping approach for the classification of quasicrystals. They have shown that AB6 and A13B5 compounds are related to quasicrystals and are actually the extension of the AB and AB3 compounds. They were able to understand the quasicrystal forming ability of various compositions in Zn![]() Mg
Mg![]() RE and Cd
RE and Cd![]() Mg
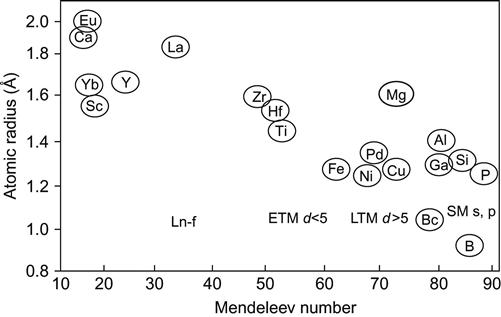
Mg![]() RE systems using this approach. Ranganathan and Inoue (2006) have used this approach for the identification of higher order quasicrystal forming alloys (ternary and quaternary) as pseudobinary quasicrystalline intermetallics. They considered the largest sized atom as the most important constituent. They have been also able to classify quasicrystals into four structural classes (Bergman class, Mackey class, Kuo class, and Tsai class) based on the nature of the bond orbital s, p, d, or f of the large atom with four associated related crystal structures. They have also identified that atomic size together with Mendeleev number can give a better systematic classification of quasicrystals to different groups (Figure 3.13). They observed that Mendeleev number is the most important parameter in determining the quasicrystal forming ability of alloys. They also pointed out that atomic size factor is the dominant parameter for quasicrystalline alloys rather than composition. They argued that a minimum amount of the large-sized atom is necessary to create icosahedral order in the phase. They have shown that Pettifor’s average Mendeleev number scheme is also applicable to A2B3, A5B2, AB2, and AB6 stoichiometries and related quasicrystals.
RE systems using this approach. Ranganathan and Inoue (2006) have used this approach for the identification of higher order quasicrystal forming alloys (ternary and quaternary) as pseudobinary quasicrystalline intermetallics. They considered the largest sized atom as the most important constituent. They have been also able to classify quasicrystals into four structural classes (Bergman class, Mackey class, Kuo class, and Tsai class) based on the nature of the bond orbital s, p, d, or f of the large atom with four associated related crystal structures. They have also identified that atomic size together with Mendeleev number can give a better systematic classification of quasicrystals to different groups (Figure 3.13). They observed that Mendeleev number is the most important parameter in determining the quasicrystal forming ability of alloys. They also pointed out that atomic size factor is the dominant parameter for quasicrystalline alloys rather than composition. They argued that a minimum amount of the large-sized atom is necessary to create icosahedral order in the phase. They have shown that Pettifor’s average Mendeleev number scheme is also applicable to A2B3, A5B2, AB2, and AB6 stoichiometries and related quasicrystals.
Biswas and Ranganathan (2006) suggested, based on Mendeleev number that many higher order alloys can be visualized as pseudo-lower-order alloys. Disordered solid solutions can be seen to be pseudounary, crystalline intermetallics can be at the highest level pseudobinary. They also demonstrated that most quasicrystals and their rational approximants are pseudobinary and that most metallic glasses are pseudoternary. They were able to demonstrate correlation between the Mendeleev number and GFA in Mg![]() Cu
Cu![]() Re alloys. The GFA appears to reach a maximum at a Mendeleev number of 27 (Gd). They also observed that Mg
Re alloys. The GFA appears to reach a maximum at a Mendeleev number of 27 (Gd). They also observed that Mg![]() Cu
Cu![]() Gd alloys have better GFA in comparison to Mg
Gd alloys have better GFA in comparison to Mg![]() Cu
Cu![]() Nd, due to the higher Mendeleev number of Gd compared to Nd.
Nd, due to the higher Mendeleev number of Gd compared to Nd.
Takeuchi and Inoue (2006) were the first to use this approach for the classification of BMGs. They have adopted Pettifor’s pseudobinary structure mapping approach to analyze the characteristic of atomic pairs in ferrous BMGs. They have described the multicomponent BMG forming systems as the sum of pseudobinary systems. For example, a ternary AaBbCc (A, B, and C are the constituent elements and a, b, and c are the atom percentages of the respective elements) BMG can be described as the sum of three pseudobinaries: Aa/(a+b)Bb/(a+b), Bb/(b+c)Cc/(b+c), and Cc/(c+a)Aa/(c+a). Multicomponent BMG systems also can be described as the sum of many pseudobinaries.
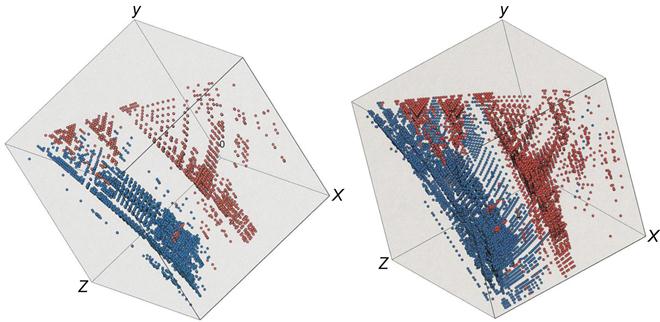
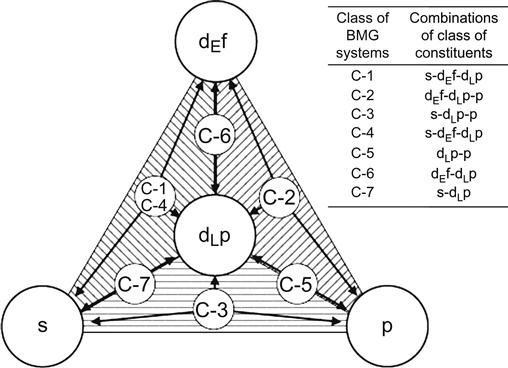
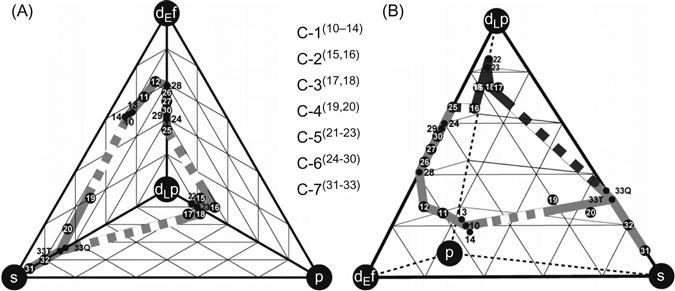
Takeuchi et al. (2007) have analyzed BMGs with a tetrahedron composition diagram that comprises constituent classes from blocks of elements in the periodic table. Figure 3.14 shows the grouping of BMGs based on the classes of constituents, namely, s-, dEf-, dLp-, and p-blocks. When the BMGs contain Al and Ga, they are assumed to correspond to either s- or p-block elements. This analysis revealed the presence of a composition band connecting different classes of BMGs (Figure 3.15). They could show that this diagram is applicable to any multicomponent alloy system and glass forming compositions can be analyzed from the bonding nature of the atomic pairs. In addition, they indicated that such composition diagrams can be used for analyzing other metallic materials such as quasicrystalline alloys and intermetallic compounds.
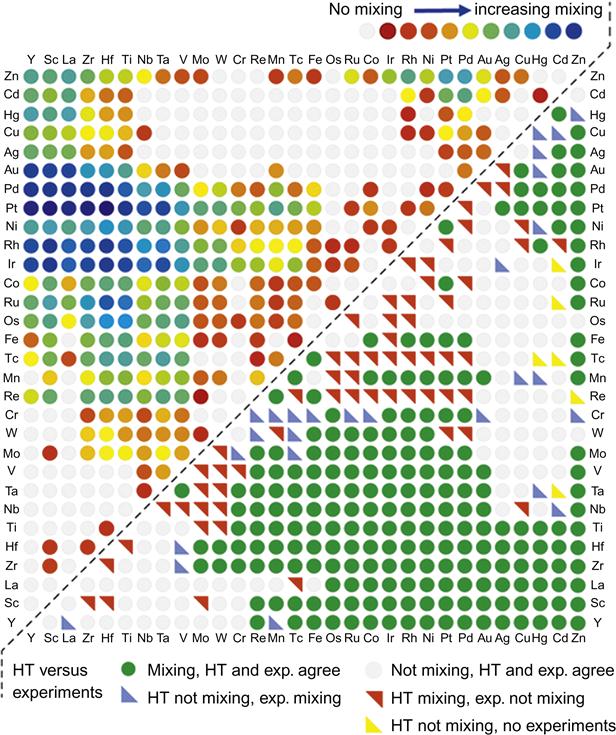
Curtarolo et al. (2013) carried out high-throughput analysis of binary intermetallics and were able to segregate compound forming and noncompound forming systems based on Mendeleev number using Pettifor map approach (Figure 3.16).
3.5 Phase Separation Approach to Find Single-Phase HEAs
From the different approaches mentioned above, it can be said that there are still no universal criteria to predict the formation of different phase types. Even so, these approaches and predictions are very helpful for composition design with an aim to achieve required phase types such as disordered solid solution, partially ordered solid solution, intermetallics, quasicrystalline compounds, and metallic glasses.
In addition to the above principles for judging the phase type of constituent phases of a HEA composition, one might directly obtain the compositions for generating monolithic-phase HEAs from the EDS (energy dispersive spectrometer) or EPMA (electron probe microanalyzer) analyses on each major phase of a multiphase alloys. This method has often been used in the development of conventional alloys. Suppose a binary alloy has two phases, α and β, in the microstructure. Then, we can use the composition of α phase to prepare simple α-phase alloy. For a more conservative way, the β-phase forming elements might be reduced suitably to let the composition safely fall into α-phase region. Similarly, simple β-phase alloy could be obtained. This methodology could be equally applied to HEAs for creating more single-phase alloys, single matrix alloys with a dispersion of second phases, or simple spinodally decomposed alloys. Obviously, these compositions are generally nonequiatomic.
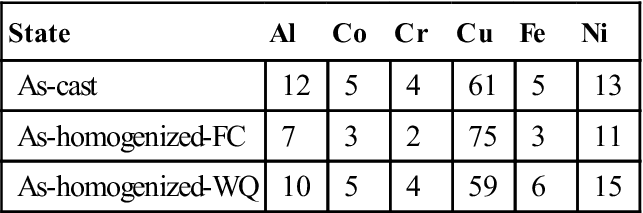
Depending on the property required for a particular application, a particular phase in the multiphase alloy is targeted. For example, it has been well known that Cu in the alloy system AlxCoCrCuFeNi tends to segregate in the interdendritic region due to its significant repulsion to Cr, Fe, and Co. Tables 3.1 and 3.2 show the chemical composition of dendrite and interdendrite, respectively, for Al0.5CoCrCuFeNi alloy in different states (Tsai et al., 2009b). From the dendrite composition, new single FCC phase alloy at high temperatures might be designed. Similarly, interdendrite composition might provide new concentrated Cu alloys.
Table 3.1
Composition of Dendrite Regions in Al0.5CoCrCuFeNi Alloy Obtained by EDS Analysis (in at.%) (Tsai et al., 2009b)
| State | Al | Co | Cr | Cu | Fe | Ni |
| As-cast | 9 | 19 | 21 | 11 | 20 | 20 |
| As-homogenized-FC | 7 | 21 | 22 | 11 | 21 | 18 |
| As-homogenized-WQ | 7 | 20 | 21 | 11 | 22 | 18 |
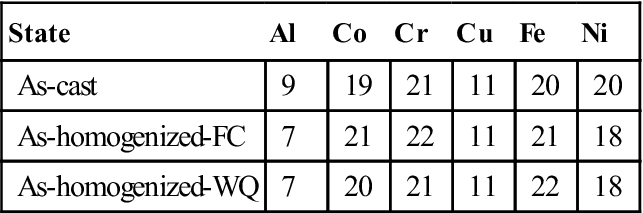
Table 3.2
Compositions of Interdendrite Regions in Al0.5CoCrCuFeNi Alloy Obtained by EDS Analysis (in at.%) (Tsai et al., 2009b)
| State | Al | Co | Cr | Cu | Fe | Ni |
| As-cast | 12 | 5 | 4 | 61 | 5 | 13 |
| As-homogenized-FC | 7 | 3 | 2 | 75 | 3 | 11 |
| As-homogenized-WQ | 10 | 5 | 4 | 59 | 6 | 15 |
It should be mentioned that by Gibbs phase rule, the degree of freedom for a single phase in composition is high. So, one can further adjust the concentration of each element to improve some properties but still maintain the single phase. In fact, most HEA researchers have used such principles to develop new HEAs for desired properties from the beginning. In general, equiatomic HEAs are the beginning points for understanding new alloy systems. Based on this, nonequiatomic HEAs were derived for better performance. Then, fine tuning of composition and process were also done in order to achieve aimed properties just like the historical development of high-performance alloys.