
Impact of smart meter implementation on saving electricity in distribution networks in Romania
Gheorghe Grigoras Gheorghe Asachi Technical University of Iasi, Iasi, Romania
Abstract
The “smart grid” concept is a term used not only in the scientific community, but also recognized and used by all electricity companies. Today, it is not possible to build an advanced infrastructure without an integrated view of all systems because only an integrated approach could provide a harmonized interoperability of the various system components. In electricity distribution, the emergence of the “smart grid” concept is due to the requirements of saving electricity and the integration of renewable sources, together with the needs of companies to select the optimal investment, optimal operation, and increasing energy efficiency. This chapter refers only to smart metering from all advanced technologies that define the basic architecture of a smart grid. In addition, the impact on the distribution networks from Romania from the viewpoint of saving electricity is presented.
Keywords
Smart metering; Advanced metering management; Distribution networks; Saving electricity; Distribution networks operator
Abbreviations
ANRE National Energy Regulatory Authority
DNO distribution network operator
EC European Commission
EU European Union
LV low voltage
MEPS minimum energy performance standards
RAB regulated asset base
1 Overview: Romania and the European situation
1.1 Introduction
The installation of smart meters can be considered a discreet revolution that is already underway in many countries around the world, including Romania. Smart meters must ensure the bidirectional communication between consumer/prosumer and the distribution networks operator (DNO) while promoting energy efficiency services. Thus, on the one hand, the customers can get accurate information online regarding electricity consumption and production, which allows them to take measures to become more energy efficient. On the other hand, DNOs provide accurate data on the consumption pattern, enabling them to manage and better plan their investments in networks. DNOs will ensure, in accordance with the result of mandates M/441/EC [1] and M/490/EC [2] in the field of smart metering and smart grids, that consistent and more cost-effective developments in the fields of communications and information will establish a more effective management of the network [3].
It all began in 2009 when the European Parliament approved the third energy package of the European Union (EU) (Directive 2009/72/EC), a legislative initiative aimed at principally improving the competition in the electricity and gas markets. In Romania, the early stages for the implementation of smart metering began that same year. Initially, several pilot projects that focused on the installation of automatic meter reading—with only 15,000 customers that implemented advanced metering management—were ongoing. For these stages, during 2009–12, the information is presented as a whole in Table 1 [4]. The residential consumers completely dominate, constituting 99% of all electricity customers in Romania. The share of nonresidential consumers (such as industry and small and medium enterprises) is approximately 1%. A very small number of the smart meters was until now installed at residential customers, and hence a high potential for the implementation of smart metering system can be identified [5].
Table 1
| Consumer category | Consumer number | Smart meters installed (pc.) | Smart meters installed (%) |
|---|---|---|---|
| Public consumers (larger nonresidential customers) | 20,000 | 9700 | 48.5 |
| Small and medium nonresidential customers | 600,000 | – | 0 |
| Residential consumers | 8,380,000 | 34,300 | 0.4 |
| Total | 9,000,000 | 44,000 | 0.48 |

At the end of 2012, the Romanian National Energy Regulatory Authority (ANRE) published a study carried out by the Global Management Consulting Firm—A.T. Kearney, at the request of the European Bank for Reconstruction and Development (EBRD). The study focused on the feasibility of introducing and using the smart meters in the markets for electricity, natural gas, and heat from Romania. Based on this study and others made by some DNOs, the smart electricity distribution has become a priority of ANRE, which, starting from Law No. 123/2012 on electricity and gas, issued Order No. 91/2013 that provides as a national target the implementation of smart metering systems for electricity to approximately 80% of the final consumer number by 2020 [6]. In accordance with Romanian law on electricity and natural gases, the same study assessed the implementation of smart metering systems from the viewpoint of long-term costs and benefits to the market, profitability, and feasible implementation deadlines [7]. The reduction of electricity losses, lower operating costs, and utilities could lead also to increase the benefits. Other important aspects were about relevant elements of the cost-benefit analysis and an effective approach to install the smart meters [5]. The feasibility study, including the results of the cost-benefit analysis, indicated a positive net present value. This led to the conclusion that the implementation of smart metering in the electricity sector has the potential to be a profitable investment due to the benefits from reducing electricity losses in electric networks and decreasing operating costs under certain conditions and assumptions.
Because the results of the cost-benefit analysis were positive, ANRE has proposed a plan to implement the smart metering system, taking into account the best practices, latest technologies, appropriate standards, and the importance of developing the electricity and gas markets. A suggestive time frame for the implementation of smart metering in Romania is presented in Fig. 1 [8].

1.2 Romania versus European countries
The monitoring done since 2011 by the European Commission (EC) [9] showed that progress has been strongest in countries with a significant impulse in the regulatory field (Fig. 2).

It can be observed that many so-called “dynamic movers” took into account very ambitious rollout plans. Furthermore, the minimum requirements of smart meters have been clarified in most of these countries. On the other side, countries that are classified as “market drivers” had only moderate progress. In general, it should also be said that in many countries there is still a lot of skepticism among consumers and private companies. Romania belongs in the category “waverers” [9].
Along with 16 other states from the EU that have decided in favor on a large scale (> 80%) for the implementation of electricity smart metering after cost-benefit studies, Romania had an official decision pending. In these studies, Romania and Poland were specifically mentioned, emphasizing that although the feasibility analyses indicated positive results, the formal decisions regarding the beginning of some national projects have been delayed. This aspect was highlighted by the EC in 2014, and it is shown in Table 2 [10].
Table 2
| Country | Wide-scale roll-outa | CBA conducted | Outcome of the CBAa |
|---|---|---|---|
| Austria (AT) | Yes | Yes | Positive |
| Denmark (DK) | Yes | Yes | Positive |
| Estonia (EE) | Yes | Yes | Positive |
| Finland (FI) | Yes | Yes | Positive |
| France (FR) | Yes | Yes | Positive |
| Greece (EL) | Yes | Yes | Positive |
| Ireland (IE) | Yes | Yes | Positive |
| Luxembourg (LU) | Yes | Yes | Positive |
| The Netherlands (NL) | Yes | Yes | Positive |
| Sweden (SE) | Yes | Yes | Positive |
| Great Britain (GB) | Yes | Yes | Positive |
| Poland (PL) | Yes—Official decision pending | Yes | Positive |
| Romania (RO) | Yes—Official decision pending | Yes | Positive |
| Malta (MT) | Yes | No | NA |
| Spain (ES) | Yes | No | NA |
| Italy (IT) | Yes | NA | NA |
| Czech Republic (CZ) | No | Yes | Negative |
| Lithuania (LT) | No | Yes | Negative |
| Belgium (BE) | No | Yes | Negative/inconclusive |
| Portugal (PT) | No | Yes | Inconclusive |
| Germany (DE) | Selective | Yes | Negative |
| Latvia (LV) | Selective | Yes | Negative |
| Slovak Republic (SK) | Selective | Yes | Negative |
| Cyprus (CY) | No decision | In progress | NA |
| Hungary (HU) | No decision | In progress | NA |
| Slovenia | No decision | In progress | NA |
| Bulgaria | No decision | NA | NA |

a At least 80% of customers by 2020.
Different indicators resulted from the study made for Romania [5,6]. These indicators reflected the total costs per the information collected, adjusted to reflect the best electricity-specific activities. Thus, the total costs per categories were estimated as 648.2 million euros, and the average costs per metering point per categories (based on a 15-year modeling period) were 77.35 euros. These costs are some of the smallest from the EU. A comparison between costs from different countries is presented in Figs. 3 and 4 [11]. The signification of abbreviations for countries is given in Table 2.


However, the analysis based on the recent pilot projects has led to the conclusion that, in Romania, the average cost per metering point increased to €122. The components of this cost are represented by the following: smart meters (€75), communications (€10), information technology (€4), distribution (€25), and others undefined costs (€8) [11].
1.3 Configuration and key functionalities of the smart metering system in Romania
The assessment of the model corresponds to a “middleware layer” design. It contains the following main components: data concentrators and balancing meters installed on each electric substation from the distribution network and meters placed with customers. The data communication occurs through power line communication (PLC) wiring from the smart meters to concentrators and through various communication channels from concentrators to a central database.
Most DNOs have adopted a similar configuration, as depicted in Fig. 5.

The establishment (through regulatory tools and mechanisms) and the use of open standard communication protocols played a very important role in the connecting of smart meters to the data concentrators and then to the central database. Such an approach avoided the massive investment in equipment that is not interoperable, cannot log, or generates errors in the data transmission when purchased from different suppliers [5]. The key functionalities of the smart metering system used in Romania are indicated in Fig. 6.

The adopted solution for the smart metering system in Romania has a low cost with minimum functionality. However, the benefits could decrease due to the minimum functions.
2 The current status of smart metering in Romania
2.1 General aspects
In Romania, there are eight DNOs that serve more than 9 million customers [7]:
- 1. CEZ Distributie (CEZ)—15.1% electricity distributed nationwide.
- 2. ENEL Distributie Banat (ENEL-B)—9.8% electricity distributed nationwide.
- 3. ENEL l Distributie Dobrogea (ENEL-D)—8.4% electricity distributed nationwide.
- 4. ENEL Distributie Muntenia (ENEL-M)—16.2% electricity distributed nationwide.
- 5. E.ON Moldova Distribuţie (E.ON) (in January 2017, changed its name to DELGAZ GRID)—10.3% electricity distributed nationwide.
- 6. ELECTRICA Distributie Transilvania Sud (Electrica-TS)—13.3% electricity distributed nationwide.
- 7. ELECTRICA Distributie Transilvania Nord (Electrica-TN)—11.6% electricity distributed nationwide.
- 8. ELECTRICA Distributie Muntenia Nord (Electrica-MN)—16.2% electricity distributed nationwide.
The share of electricity distribution nationwide corresponds to the year 2015, when the total electricity distributed was approximately 42.4 TWh.
Each company is responsible for the exclusive distribution of electricity within its licensed region, based on a concession agreement with the Romanian state acting through the Ministry of Energy (see Fig. 7).

Beginning in 2013, all DNOs developed pilot projects to evaluate the efficiency of the smart meter implementation program. Thus, a homogeneous implementation (pilot projects in the regions covered by DNOs) is given by [6]:
- • The installation of smart meters for consumers from the urban/rural areas served by a DNO for each demonstration project.
- • The permanent monitoring of electricity consumption by consumers (online) to enable them to benefit from the positive impact of energy efficiency measures to be implemented as well as the immediate impact of pricing policies to be applied on the behavior of nonresidential electricity customers.
- • The recorded data that must be sufficient to analyze and optimize the functioning of distribution facilities and equipment in order to increase the efficiency of networks. These data must allow the rapid identification of action points.
The expected results of the pilot projects were the following [6]:
- • Installation of smart meters enables DNOs to reach their target of approximately 80% implementation of final customers by 2020, as required by Law No. 123/2012 [12].
- • For selected areas, the electricity consumption will decrease by 10% due to the smart management at the consumer and the distribution levels.
- • To support the model that DNOs use for the implementation of smart metering.
- • Savings of around 300 MWh/year/project (based on the annual average electrical consumption of urban families in Romania).
Through these projects, the technical possibilities for achieving the solution of smart metering and the customers’ benefits in the new system are investigated. On the other hand, an analysis related to data protection in the system of remote reading and the protection of communication lines is deepened.
Based on the experience acquired in 2013, by the end of the next year, ANRE had issued an order regarding smart metering, called the “Order on the implementation of smart metering in electricity” [13], which provides, in addition to a range of general functionalities of smart metering systems, general data on the implementation plan and a description of the pilot projects.
According to the regulatory stipulations on the deployment of smart metering systems, DNOs.
submitted proposals to ANRE for the realization of some pilot projects in 2015. Those results were to provide needed information to establish the conditions and tools on the developing of a schedule and a national plan for the implementation of smart metering.
ANRE approved 18 pilot projects worth 69,639,770 lei (approximately 15.48 million euros) in 2015 (see Table 3 [5]). For these projects, a set of performance indicators was defined for smart metering systems so that progress could be monitored during the implementation process and a period thereafter. The performance indicators relate to the following issues: the status of implementation, the structure of intelligent metering systems, the economic effects, the quality, and the security of information. These indicators will be applied to all these pilot projects so as to verify the achievement of proposed objectives.
Table 3
| DNO | Number of Pilot projects | Number of customers | Total cost (million euro) |
|---|---|---|---|
| ENELDistributie Banat | 3 | 9961 | 1.17 |
| ENEL Distributie Dobrogea | 4 | 10,000 | 1.10 |
| ENELDistributie Muntenia | 1 | 11,392 | 1.48 |
| CEZ Distributie | 2 | 20,150 | 3.57 |
| EON Distributie | 2 | 23,237 | 1.85 |
| ELECTRICA Transilvania Sud | 2 | 23,047 | 5.09 |
| ELECTRICA Transilvania Nord | 2 | 5335 | 0.9 |
| ELECTRICA Muntenia Nord | 2 | 2143 | 0.32 |
| Total | 18 | 105,265 | 15.48 |

The implementation areas were defined and the characteristic data and information have been set in terms of the technical, economic, sociodemographic, and qualitative aspects. The processing of these data is aimed at prioritizing a hierarchy of the areas for each DNO through a multicriteria analysis to assess the potential implementation of smart metering systems and the preparation of the national plan.
The analysis report on the pilot projects for each DNO given by ANRE in August 2016 [14] showed the following important aspects:
- • Postimplementation results on the benefits in question are not relevant to all pilot projects.
- • Cost-benefit analyses did not allow a comparative study based on the obtained results.
- • The initial assumptions are different, depending on the business strategies, with the specific aims and focus of each DNO.
- • Cost-benefit analyses are positive for ENEL Distributie, E.ON Distributie, and ELECTRICA Transilvania Sud but negative for CEZ Distributie.
The result was the need for ANRE to impose a detailed model of cost-benefit analysis or the performance of a cost-benefit analysis for all DNOs, possibly through an impartial external consultant in order to avoid allegations of nontransparency and lack of objectivity [14].
However, the final targets vary from a DNO to another as follows: ENEL target 80% by 2020 and ELECTRICA and CEZ < 50% while E.ON targets more than 50% [15].
2.2 The implementation of smart metering by DNOs
2.2.1 ENEL
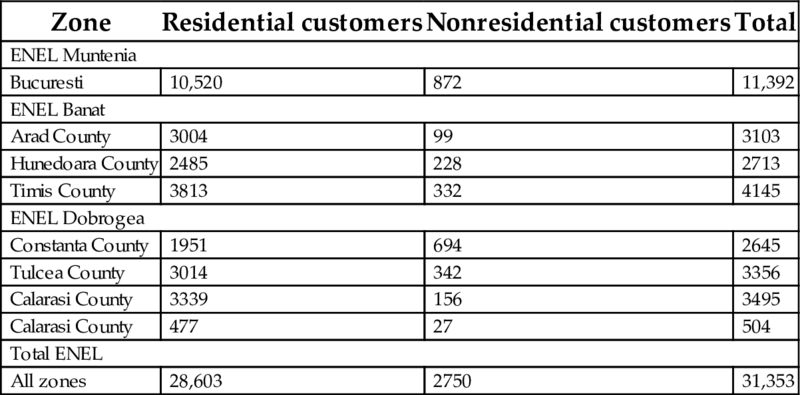
ENEL provides services to 2.8 million customers in three key regions of the country: Muntenia Sud (MS) (including the Bucharest zone), Banat (B), and Dobrogea (D), representing one-third of the electricity distribution market in Romania. Since 2014, the company has carried out an extensive program of investments to modernize the infrastructure in Banat, Dobrogea, and Muntenia [16,17]. In Table 4, the pilot projects and the number of smart meters in the three branches are given. It can observed that more than 30,000 smart meters were installed.
Table 4
| Zone | Residential customers | Nonresidential customers | Total |
|---|---|---|---|
| ENEL Muntenia | |||
| Bucuresti | 10,520 | 872 | 11,392 |
| ENEL Banat | |||
| Arad County | 3004 | 99 | 3103 |
| Hunedoara County | 2485 | 228 | 2713 |
| Timis County | 3813 | 332 | 4145 |
| ENEL Dobrogea | |||
| Constanta County | 1951 | 694 | 2645 |
| Tulcea County | 3014 | 342 | 3356 |
| Calarasi County | 3339 | 156 | 3495 |
| Calarasi County | 477 | 27 | 504 |
| Total ENEL | |||
| All zones | 28,603 | 2750 | 31,353 |
From 2016, the pilot projects were selected in both urban and rural areas. The information is given per total, residential, and nonresidential customers in Table 5 [16].
Table 5
| Zone | Area | Number of places | Total |
|---|---|---|---|
| ENEL Muntenia | |||
| Bucuresti | Urban | > 3 | 22,294 |
| Ilfov County | Rural | 3 | 14,256 |
| Urban | 1 | 9329 | |
| Giurgiu County | Rural | 9 | 7219 |
| ENEL Banat | |||
| Timis and Caras Severin Counties | Rural | 7 | 2741 |
| Urban | 2 | 11,742 | |
| Hunedoara County | Rural | 7 | 4145 |
| Arad County | Rural | 1 | 1001 |
| Urban | 1 | 6662 | |
| ENEL Dobrogea | |||
| Constanta and Tulcea Counties | Urban | 6 | 11,383 |
| Rural | > 6 | 5708 | |
| Calarasi County | Rural | 3 | 4030 |
| Urban | 2 | 6831 | |
| Total ENEL | |||
| All zones | Rural | > 36 | 39,100 |
| Urban | > 15 | 68,241 | |
| Total | > 51 | 107,341 | |

The total smart meters installed in pilot projects from 2014 to 2016 are indicated in Fig. 8 per each county served by the three subsidiaries of ENEL.

The number of smart meters installed until now is low in relation to the target assumed by the national program (see Fig. 1), but ENEL considers that the number will increase up to 80% of total customers until 2020.
2.2.2 CEZ
CEZ has been present on the Romanian market since 2005, ensuring the electricity supply to seven counties in the southern area. The company provides services to 1.427 million customers. The modernization of the metering system represents an ambitious investment by CEZ, which carried out pilot projects in four areas of Dolj County in the period 2013–14 [18]. The pilot projects were selected from both urban and rural areas (see Table 6).
Table 6
| Zone | Area | Number of places | Total |
|---|---|---|---|
| Dolj County | Urban | 2 | 12,164 |
| Rural | 2 | 1033 | |
| Total | 4 | 13,197 |

In 2015, the implementation of smart metering continued, using the pilot projects from the same county (Dolj). The number of smart meters is separately given for residential and nonresidential customers (see Table 7 [18]).
Table 7
| Zone | Area | Number of places | Residential consumers | Nonresidential customers | Total |
|---|---|---|---|---|---|
| Dolj County | Urban | 1 | 17,620 | 1389 | 19,009 |
| Rural | 1 | 1039 | 102 | 1141 | |
| Total | 2 | 18,659 | 1491 | 20,150 |

The investments continued in 2016 with Olt County, but their value is lower (see Table 8 [18]).
Table 8
| Zone | Area | Number of places | Residential consumers | Nonresidential customers | Total |
|---|---|---|---|---|---|
| Olt County | Rural | 1 | 54 | 9 | 63 |
| Total | 1 | 54 | 9 | 63 |

The total smart meters installed in the pilot projects of CEZ from 2013 to 2016 are indicated in Fig. 9.

2.2.3 ELECTRICA
ELECTRICA consists of three electricity distribution subsidiaries (see Fig. 7), namely:
- • ELECTRICA Muntenia Nord ensures the electricity supply to six counties from the southeast part of Romania.
- • ELECTRICA Transilvania Nord ensures the electricity supply to six counties from the north and northwest parts of Romania.
- • ELECTRICA Transilvania Sud ensures the electricity supply to six counties from the central part of Romania.
The total number of customers supplied is approximately 3.6 million [19].
Information about the implementation of smart metering is poor. The data are based on presentations from various scientific events and the declarations of managers in the Romanian press.
The program for the implementation of smart meters began in 2012 within some pilot programs. The implementation stage and the adopted solutions at the level of 2012 are presented in Table 9 [19].
Table 9
| Technical solutions | Area | Number of pilot projects | Customer type | Total |
|---|---|---|---|---|
| PLC communications | Urban | 6 | Residential customers | 9215 |
| Rural | 2 | Residential customers | ||
| Urban | 1 | Nonresidential customers | ||
| GSM/GPRS communication | Urban | 15 | Residential customers | 45,660 |
| Optical fiber and wire/GSM communications | Urban | 18 | Nonresidential customers | 9726 |
| Total | 32 | 64,601 |

In 2012, subsidiaries reported that the degree of implementation for smart meters was the following [11]: ELECTRICA Transilvania Nord—1%, ELECTRICA Transilvania Sud—3%, and ELECTRICA Muntenia Nord—5%.
Currently, the plan is to install 250,000 smart meters in the three distribution subsidiaries; however, only 200,000 had been installed by 2016 through ongoing pilot projects [20].
2.2.4 E.ON (DELGAZ grid)
E.ON provides services to approximately 1.4 million customers in six counties from the northeastern part of Romania. The company has carried out an extensive program of investment to modernize the infrastructure since 2012. From 2010 to 2012, E.ON has implemented a “load curves collecting” system that allowed the testing of technology and the functionality of smart metering. The main objective of the project was to develop specific load profiles for the different categories of customers in order to facilitate the opening of the retail market for small users [21].
By the end of 2015, E.ON aims to install a total of 226,000 smart meters within an investment program of 30 million dedicated to the development of such networks. By the end of 2012, E.ON installed about 14,300 smart meters. In 2013, another 35,000 smart meters [22] were installed, followed by 147,000 units in 2015. In 2016, plans called for the installation of an additional 55,000 smart meters. The investment for this purpose from 2014 to 2016 was about 20 million euros [23]. The evolution of the implementation program from 2012 to 2016 is given in Fig. 10.

3 Impact of smart metering implementation on saving electricity in distribution networks in Romania
3.1 General aspects
Smart metering provides more accurate billing of the electricity used based on real consumption and decision making on the tariff for the flattening of the load curve and reduction of the invoice. Additional reasons for the implementation of smart metering in the electricity sector are the benefits to the entire society, which may result from the installation of smart grid solutions (smart grids) based on a smart metering infrastructure [24]. Also, significant reductions in electricity consumption and CO2 emissions can be obtained by providing information about consumption on central Internet portals, which consumers can access directly or at electronic devices located at the consumption point. In addition, the “demand response” solutions can help to reduce the peak load using information from the smart meters. The level of expenditure, the losses in the electricity distribution networks, and the volume of investments are supervised indicators in order to improve the quality of the distribution service due to the implementation of smart metering in Romania.
Thus, smart metering will have a direct impact on:
- • The need to increase energy efficiency through a greater transparency of metering information as well as encouraging the consumers to change their consumption behavior.
- • The pressure of regulatory authorities for a decrease of the cost by reducing electricity losses and the costs of meter reading and through a better identification of the required investments.
- • The education of consumers to reduce the consumption at peak load.
- • The environmental protection (reducing the peak load will lead to a decrease in electricity production and the use of power plants with high emissions of carbon dioxide).
- • The security of the electricity supply by introducing the flexible infrastructure and minimizing the number of power plants while increasing the share of electricity production from renewable sources.
From the point of view of DNOs, smart metering could follow and improve the state parameters and operation conditions of distribution networks, contributing to increasing energy efficiency. This could be done by reducing their own technological consumption (technical and commercial), the interruptions in power supply, the number of incidents, the voltage dips, the expenditure level, the investments, the operational costs with meter reading, etc.
In Fig. 11, an evolution of electricity losses assumed by each DNO beginning with 2014 is presented [24].

These values will be obtained based on the investments of DNOs in proper distribution networks aiming for modernization measures (replacement of aging equipment and installations) and measures for the implementation of smart grid technologies (distribution automation, distributed generation, smart metering, etc.).
Fig. 12 shows the estimated electricity saved from 2014 to 2020 from distribution networks set out in the national action plan to achieve the target assumed by Romania and the compliance with requirements from Directive 2012/27/EU [24].

The targets are obtained only if the above technical measures are adopted. The implementation of smart metering influences the operation of distribution networks. Thus, the optimal decision making based on information from the smart meters can lead to higher electricity savings.
For the implementation of smart metering in Romania in the period 2017–20, the estimated electricity savings are presented in Fig. 13 [24]. These savings lead to a decrease in nontechnical losses.

In terms of pollutant emissions, about 0.437 kg of CO2 are emitted per kWh generated. Thus, the decrease of pollutant emissions (for the data from Fig. 13) can be seen in Fig. 14. It can be observed that total pollutant emissions decrease with approximately 76,221 ton of CO2.

In the following paragraph, the results obtained in three case studies will be presented to demonstrate the positive impact of implementation of smart metering on the operation and planning of distribution networks.
3.2 Case studies
3.2.1 Phase balancing using smart metering
Due to the distribution of single-phase loads on phases and their random instant demand values in the low voltage (LV) distribution networks, current unbalances can occur. These unbalances increase electricity losses and the risk of capacity constraint violation while deteriorating the power quality. The disadvantages can be eliminated by an optimal phase allocation of customers to balance the LV feeder using data provided by smart meters.
The case study was conducted on an LV electric distribution network included in a pilot project of smart metering program from Romania [25]. The structure of this network is presented in Fig. 15 [25].

The circles signify poles at which consumers are connected via service cables. The total numbers of poles from the network is 198. The line length between two poles is 40 m, as specified in Romanian standards. The LV electric distribution network has three feeders with the primary characteristics presented in Table 10.
Table 10
| No. feeder | Total length (m) | Customer number | Conductor type | Conductor size (phase + neutral) (mm2) | Length of section (m) |
|---|---|---|---|---|---|
| 1 | 280 | 13 | Classical | 1 × 50 + 50 | 280 |
| 2 | 3520 | 163 | Stranded | 3 × 35 + 35 | 120 |
| Classical | 3 × 50 + 50 | 3760 | |||
| 3 | 3880 | 167 | Stranded | 3 × 50 + 50 | 120 |
| Classical | 3 × 50 + 50 | 2080 | |||
| Classical | 3 × 35 + 35 | 960 | |||
| Classical | 1 × 25 + 25 | 280 | |||
| Classical | 1 × 16 + 25 | 80 | |||
| Total | 7680 | 343 | Classical | 7440 | |
| Stranded | 240 |

The model for an analyzed distribution network was created using a professional package. The conductor properties were entered into the model using the conductor specification data sheets. The lengths for the trunks of LV distribution feeders (conductors between poles) and service cables to each customer were determined via a physical onsite inspection.
Each consumer is connected to a distribution pole via the service cable. The initial phase allocation represents the real situation corresponding to the connection of each customer to the network. The consumer types and their consumption categories are indicated in Table 11.
Table 11
| Consumer type | No. | Phase | Consumption category (kWh/year) | ||||||
|---|---|---|---|---|---|---|---|---|---|
| R | S | T | 0–400 | 400–1000 | 1000–2500 | 2500–3500 | > 3500 | ||
| 1-Phase | 335 | 83 | 152 | 100 | 150 | 108 | 65 | 5 | 7 |
| 3-Phase | 8 | – | – | – | 5 | 2 | 0 | 0 | 1 |

All customers from the network are integrated into the smart metering system. The individual load profiles for each consumer were taken from that system. The steady-state calculations were made for each hour from the days of the study period (1 week) and the results are presented in Table 12.
Table 12
| No. | Day | Load (kWh) | ΔW (kWh) | ΔW (%) | Input energy (kWh) |
|---|---|---|---|---|---|
| 1 | TU | 1064.3 | 67.5 | 6.0 | 1131.8 |
| 2 | WE | 960.4 | 52.2 | 5.2 | 1012.6 |
| 3 | TH | 941.4 | 54.7 | 5.5 | 996.1 |
| 4 | FR | 887.2 | 45.8 | 4.9 | 933.0 |
| 5 | SA | 984.2 | 60.5 | 5.8 | 1044.7 |
| 6 | SU | 828.2 | 40.1 | 4.6 | 868.3 |
| 7 | MO | 912.3 | 49.9 | 5.2 | 962.2 |

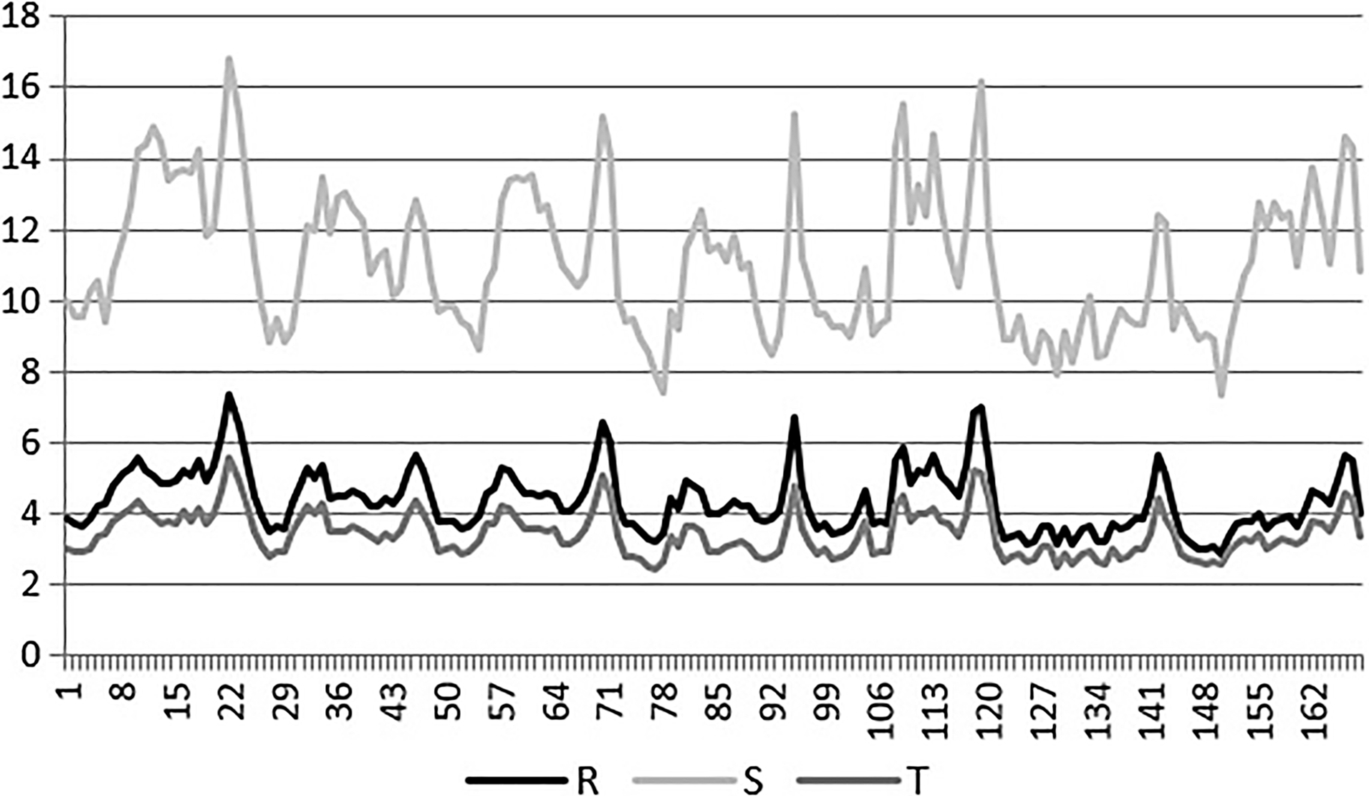
An important aspect of the analysis relates to the degree of current unbalance of each LV electric distribution feeder from the analyzed substation zone. This was evaluated using the unbalance factor calculated by DNOs from Romania with relation [25]:

where: iav is the average value of the current.
The value of CUF should not exceed 1.10 r.u.
Because feeder 1 is very short and supplies only 13 consumers, this was removed from the analysis. For feeders 2 and 3, the values obtained were 1.25 r.u. and 1.09 r.u., respectively. It can be observed that, for the second feeder, the value of CUF exceeded with 15% the admissible maximum value. This aspect can be highlighted by the loading of phases on the first section of the feeder, presented in Fig. 16.
For this feeder, it proceeded at the reallocation of customers on phases such that the degree of current unbalance would be below the admissible maximum value (1.1 r.u.). The obtained results are indicated in Table 13.
Table 13
| No. | Pole | Initial phase | Allocated phase | No. | Pole | Initial phase | Allocated phase |
|---|---|---|---|---|---|---|---|
| 1 | 20 | R | S | 32 | 48 | S | R |
| 2 | 20 | R | S | 33 | 48 | S | T |
| 3 | 23 | R | S | 34 | 49 | S | R |
| 4 | 26 | T | S | 35 | 54 | S | T |
| 5 | 27 | T | S | 36 | 54 | S | R |
| 6 | 34 | T | R | 37 | 54 | S | R |
| 7 | 34 | T | R | 38 | 54 | S | T |
| 8 | 34 | T | R | 39 | 55 | S | T |
| 9 | 37 | T | R | 40 | 65 | S | R |
| 10 | 37 | T | R | 41 | 66 | S | R |
| 11 | 38 | T | R | 42 | 66 | S | T |
| 12 | 39 | T | R | 43 | 67 | S | R |
| 13 | 39 | T | R | 44 | 68 | S | T |
| 14 | 39 | T | R | 45 | 68 | S | T |
| 15 | 39 | S | R | 46 | 70 | S | R |
| 16 | 40 | T | S | 47 | 72 | S | T |
| 17 | 40 | T | S | 48 | 75 | S | T |
| 18 | 40 | T | S | 49 | 76 | S | R |
| 19 | 41 | T | S | 50 | 78 | S | T |
| 20 | 42 | T | S | 51 | 79 | S | R |
| 21 | 43 | T | S | 52 | 80 | S | T |
| 22 | 43 | T | S | 53 | 82 | S | T |
| 23 | 44 | T | S | 54 | 83 | R | T |
| 24 | 45 | T | S | 55 | 84 | S | R |
| 25 | 45 | T | S | 56 | 87 | S | T |
| 26 | 45 | T | S | 57 | 88 | S | R |
| 27 | 45 | T | S | 58 | 89 | S | T |
| 28 | 46 | T | S | 59 | 90 | S | R |
| 29 | 46 | T | S | 60 | 93 | S | T |
| 30 | 47 | R | S | 61 | 95 | S | T |
| 31 | 47 | S | R | 61 | 95 | S | T |

These achievements have resulted in a significant reduction of the degree of unbalance (CUF = 1.016 r.u.). This translates into loads much closer on phases, as evidenced by the graphs from Fig. 17.

With the new data (see Table 13), the steady-state calculations have led to the results presented in Table 14.
Table 14
| Day | Total load (kWh) | Initial case (unbalanced) | Final case (balanced) | ||||
|---|---|---|---|---|---|---|---|
| Input energy (kWh) | ΔW (kWh) | ΔW (%) | Input energy (kWh) | ΔW (kWh) | ΔW (%) | ||
| MA | 1064.3 | 1131.8 | 67.5 | 6 | 1108.5 | 44.1 | 4 |
| MI | 960.4 | 1012.6 | 52.2 | 5.2 | 995.6 | 35.1 | 3.5 |
| JO | 941.4 | 996.1 | 54.7 | 5.5 | 977.3 | 35.8 | 3.7 |
| VI | 887.2 | 933 | 45.8 | 4.9 | 918 | 30.6 | 3.3 |
| SA | 984.2 | 1044.7 | 60.5 | 5.8 | 1023.3 | 39 | 3.8 |
| DU | 828.2 | 868.3 | 40.1 | 4.6 | 855.8 | 27.5 | 3.2 |
| LU | 912.3 | 962.2 | 49.9 | 5.2 | 945.5 | 33 | 3.5 |
| Total | 6578 | 6948.7 | 370.7 | 5.3 | 6824 | 245.1 | 3.6 |

The analysis of the results presented in Table 14 highlights a significant reduction of weekly electricity losses in the pilot zone with 1.7%, from 5.3% to 3.6%. The variation of hourly power losses from the studied period for both cases (unbalanced and balanced) is presented in Fig. 18, when a decrease of the power losses can be observed. In addition, the final situation of customer allocation led to improving the voltage level on the phase S (highly loaded phase) and at a voltage balance in the final nodes of can observed distribution feeder. The variation of voltages in Node 95 (both cases) is shown in Figs. 19 and 20.


An extension of the analysis at 1 year revealed that the electricity savings can be by 8.7 MWh/year. This amount of electricity savings was assessed considering the forecasting coefficients for load-in function by each season [25]. This value could be obtained if data from the smart meters are used by DNOs for the purpose of an optimal operation and planning of the network.
3.2.2 Reduction of commercial losses based on smart metering
One of the biggest benefits corresponding to the implementation of smart metering is decreasing the electricity losses and especially commercial losses. The commercial electricity losses result from the errors and consumptions of measuring equipment as well as from electricity theft. In many implementation zones, the installation of smart meters is essential to restore or change components from networks in order to have good results and proper monitoring. Also, the electric substations are equipped with balanced smart meters, which measure the total losses based on the difference between the measured electricity and the sum of all measured electricity by the smart meters from customers. Due to these balanced smart meters, the nontechnical (commercial) losses can be easily evaluated based on the difference between total losses and technical losses. The technical losses can be calculated exactly because the smart meters can be connected to a central database provided with dedicated software that can determine the technical losses in a very short time. Thus, the technical and commercial losses can be evaluated more accurately and very fast.
In Predescu and Vornicu [26], taking into account these aspects, the results obtained after the implementation of smart metering in some pilot networks from Romania were presented. The conclusions were that the commercial losses reached all areas, but in some, the reduction is significant (see Fig. 21).

The electricity savings for each area are shown in Fig. 22. The total electricity savings obtained from reducing the commercial losses was approximately 0.548 GWh.

3.2.3 Smart metering-based decision making for replacement of distribution transformers
The energy efficiency of distribution networks can be increased adopting some measures focused on the reduction of electricity losses. Thus, the investments in new electricity generation units and its transmission and distribution to consumers will decrease.
The distribution networks from Romania as well as other European countries are characterized by a vast majority of components (lines, transformers, switching equipment, etc.) at the end of their lifetime. These components have been in operation since the 1960s. Fig. 23 presents two profiles: the first indicates the investments made in electric distribution networks, and the second suggests the time frame for investments in the replacement of aging equipment, at the limit of the lifetime [27].

An analysis of the situation presented in Fig. 23 leads to the conclusion that in the forthcoming period, the vast majority of components from the electric distribution networks will be replaced. It can be observed that the height of this modernization is reached during the period 2016–20. In this context, the DNOs must propose and implement strategies that lead to improved energy efficiency. The eight DNOs from Romania have permanent multiannual investment programs that take into account the energy efficiency. Among the general objectives of the development/modernization strategies envisaged by DNOs can be mentioned [28–30]:
- • Increasing the security of the electricity supply to all consumers.
- • Reducing electricity losses.
- • Increasing the degree of security in operations and function safety.
- • Decreasing the amount of damage in electric installations and the interruption duration of consumers.
- • Ensuring the quality parameters of electricity supplied in accordance with ANRE.
- • Reducing the amount of undelivered electricity to consumers as a result of unplanned outages.
- • Reducing the maintenance and repair costs.
The measures that can be taken to achieve all objectives of development/modernization are as follows:
- • Modernization of the transformer substations.
- • Increasing the voltage level from 6 kV up to 20 kV.
- • Development of distribution automation by installing the reclosers and remotely controlled switches.
- • Integrating the SCADA system in all electric substations.
- • Introduction of the smart metering.
- • Installing the automatic voltage regulators in all electric substations.
- • Introduction of the asset management system.
The achievement of all objectives is directed toward better consumer satisfaction from the viewpoint of power quality, sustainable energy development, and high economic performance.
In this paragraph, only the modernization of MV/LV electric substations based on the replacement of transformers was treated. Thus, the results obtained in a pilot project will be presented. The distribution transformers with older minimum energy performance standards (MEPS) were replaced with efficient transformers (European performance standard EN 50464). Decision making was based on the data provided by the balanced smart meters installed in MV/LV electric substations. For example, the weekly loading profile of a transformer (provided by the balanced smart meter) is presented in Fig. 24.

The aim is obtaining the technical and economic benefits from the replacement of all overload and underload old transformers. The old transformers are considered the transformers with the following MEPS: RO_1960, RO_1967, and RO_2006 (see Fig. 25 [31]).

The analysis revealed 51 distribution transformers (20/0.4 kV) that meet the above criteria, as you can see in Table 15. The information about the loading of transformers was obtained from the load profiles recorded by the balanced smart meters installed in each electric distribution substation.
Table 15
| MEPS | RO_1967 | RO_1972 | RO_2006 | Total | |
|---|---|---|---|---|---|
| Number | (pieces) | 12 | 32 | 7 | 51 |
| (%) | 24 | 63 | 14 | 100% | |

In the initial stage, the loading factor had values between 3% and 160%. The final rated power of transformers has been flattened, now situated in the range 40%–80%. This aspect is reflected by the loading factor represented in Fig. 26. Also, Fig. 27 shows the initial versus final rated power.


As to the annual energy losses, they decreased by 330.9 MWh (about 63%). A comparison between the annual electricity losses in the initial and final stages is presented in Fig. 28.

Further, the specific electricity savings (MWh/year/transformer) were calculated. The obtained value for this indicator is 6.5 MWh/year/transformer. Finally, an assessment of the total annual cost of electricity losses was calculated, as you can see in Fig. 29, and the obtained benefit was by 26,483 euro/year.

Due to the tightening of the regulatory framework, the decisions of DNOs for the replacement process must be based on detailed technical and economic analysis, having as input the data provided by the smart metering system. These decisions should lead to:
- • Increasing the electricity savings.
- • Reducing the maintenance and operation costs.
- • Reducing the security risks of people and goods.
- • Reducing the risk of penalty arising from noncompliance with the quality conditions of the distribution service imposed by the performance standards.
4 Conclusions and future trends
The most applied model by DNOs from Romania to the implementation of smart metering from 2012 to 2016 was an exponential model that involved the installation of a smaller number of smart meters in the early years (to allow electricity distribution companies to adjust the parameters, to plan and learn from the experience of the first years) followed by a balanced implementation for the coming years.
ANRE proposed beginning with 2014 to implement pilot projects and evaluate the specific aspects of the distribution network in order to establish the conditions for the final installation of intelligent metering systems by each operator, targeting the informational campaign for customers and logistics activities. The pilot projects represent part of the national program for the implementation of smart metering and are included in the investment plans of DNOs [32]. These projects take into account urban and rural areas with high electricity losses, areas that require the modernizing of electric networks, and urban and rural areas in good technical condition and small electricity losses.
The investments corresponding to the implementation of smart metering are recognized in the regulated asset base (RAB) by ANRE and paid the regulated rate of return, which also applies to other investments of DNOs. The implementation of smart metering systems can be made through accessing some funding sources or grants, including from European funds, these being considered investments of DNOs.
This funding will not establish the beginning corresponding to the implementation of the smart metering system and the values of financed investments will not be included in the RAB calculation, according to ANRE. The document stipulates that, to the request of the customer/DNO paying a fee, the smart metering systems should include advanced pricing structures, records of the consumption depending on the period, and a remote financial control without being passed through the computer system (for respecting confidentiality) [32].
The establishment of tariffs is made by the supplier with the data only available to the customer. Load curve can be an important element in the correct setting of the tariff for consumers. The smart meters are designed to help the consumers save energy as well as force the DNOs to ensure a better quality of service.
The results of pilot projects for smart metering showed that the installation of smart metering makes economic sense only in urban areas [16]. There are many DNOs that believe the smart meter helps just to know consumption in real time, to reduce thefts and commercial losses. Thus, it is very important for DNOs to explain to customers the benefits for them: the real time readings of consumption, ensuring the ideal power consumption curve, or balancing the power consumption at the level of each household [33].
At this moment, ANRE is in the stage of cost-benefit assessment on eight regions where the smart meters were implemented. The analysis of the implementation stage at the end of 2015 revealed the following [7]:
- • The postimplementation results concerning the expected benefits are not relevant to all pilot projects due to the very short time period from the completion of the implementation up to the reporting date of the achievements (lack of a relevant period for monitoring); it does not provide indicative premises for decision making on a rollout.
- • Cost-benefit analyses submitted by DNOs did not allow a comparative analysis of the results. These were achieved on different analysis models following the business strategy of DNO.
- • The results of cost-benefit analyses are not positive for all DNOs.
The preliminary conclusions of cost-benefit analysis are not favorable in achieving the proposed level. ANRE will launch in 2017 the national proposal for smart metering, but it is already clear that Romania cannot reach a smart metering degree of approximately 80% from the electricity consumption by 2020 as forced by European regulations. One of the explanations is linked to the fact that there are eight DNOs, four entities legally, each with its own design, cost, and specifications.
The situation from 2016 to 2020 is presented in Table 16 [7].
Table 16
| DNO | Number of zones for implementation | Number of smart meters to customers | Number of smart meters in electric substations | Number of smart meters for replacement in 2016–20 |
|---|---|---|---|---|
| CEZ | 2606 | 1,398,919 | 13,268 | 1,202,115 |
| ENEL Banat | 448 | 866,366 | 7697 | 360,022 |
| ENEL Dobrogea | 344 | 626,627 | 5498 | 301,874 |
| ENEL Muntenia | 254 | 1,201,804 | 6805 | 569,298 |
| E.ON (DELGAZ GRID) | 2552 | 1,154,729 | 9857 | 947,300 |
| ELECTRICA Transilvania Sud | 1782 | 1,078,383 | 6059 | 627,864 |
| ELECTRICA Transilvania Nord | 1963 | 1,224,969 | 8719 | 576,320 |
| ELECTRICA Muntenia Nord | 1414 | 1,224,969 | 10,218 | 730,766 |
| Total | 11,363 | 8,798,299 | 68,103 | 5,315,559 |

It can be observed that the number of smart meters that should installed from 2016 to 2020 represents approximately 57% from the total.