
Chapter 12
Case Study Application III: RISKCURVES
A. Basco*
I. Raben**
J. Reinders**
Abstract
This chapter discusses the application of TNO’s software packages RISKCURVES and EFFECTS in the quantitative Natech risk analysis of a refinery located on the Mediterranean coast. In addition to conventional industrial accident scenarios that could lead to a release of dangerous substances, the impact of two natural hazards (earthquake and tsunami) on the overall risk level was also considered and the priority risk contributors identified.
Keywords
quantitative risk assessment
QRA
earthquake
tsunami
refinery
individual risk
societal risk
This chapter discusses the application of TNO’s software packages RISKCURVES and EFFECTS in the quantitative Natech risk analysis of a refinery located on the Mediterranean coast. In addition to conventional industrial accident scenarios that could lead to a release of dangerous substances, the impact of two natural hazards (earthquake and tsunami) on the overall risk level was also considered and the priority risk contributors identified.
12.1. Introduction
Public perception of the disaster potential derived from the interaction of natural hazards with industrial installations has strongly increased in the last decades (Krausmann et al., 2011; Salzano et al., 2013). For effective Natech risk reduction to take place, the risk first needs to be identified and analyzed. Hence, there is a strong need for Natech risk-analysis methodologies and tools. In this study, a quantitative analysis of Natech risks of a refinery at a Mediterranean coast was carried out using RISKCURVES and EFFECTS, exploiting the fact that computerized tools have been used for decades for the assessment of conventional industrial risks. Due to the refinery’s location, the impact of earthquakes and tsunamis was analyzed in addition to risks from accident causes other than natural hazards.
The analysis was performed within the framework of the EU project STREST (2016) which aimed to develop harmonized stress tests for critical infrastructures against natural hazards and which followed the stress tests performed for European Union nuclear power plants to review their response to extreme situations.
12.2. Methodology
Quantitative risk analysis (QRA) is a complex and time-consuming task, as depicted in Fig. 12.1, which shows the steps and relevant aspects of a QRA. Selecting relevant equipment, choosing which accident scenarios are applicable, determining their frequencies, and modeling the physical effects are just a few of the hurdles a user finds on his way when performing a QRA. These issues clearly affect the overall risk figures as several arbitrary choices and simplifications are necessarily introduced in the process. For the sake of comparability of studies, standard methods were developed in the Netherlands, to a large extent by TNO, through reference handbooks which are called the Yellow Book, Green Book, Purple Book, and Red Book (VROM, 2005a–d). The “colored” books are public and may be considered de facto as a standard reference for any risk analysis. The QRA presented in this chapter was performed using TNO’s software packages RISKCURVES for quantitative risk assessment and EFFECTS for safety and hazard analysis (TNO, 2015), both of which are based on the “colored” books.

Figure 12.1 Steps for Standard Industrial Quantitative Risk Assessment
For any defined accident scenario, the physical effects and consequences need to be assessed. These are influenced by the release rate, weather conditions, and calculation models/methods, etc. Physical effects evaluated are toxic concentrations, heat radiation (pool fire, flash fire, torch fire, fire ball), and overpressure. The Yellow Book contains models for the calculation of physical effects. Vulnerability models relating heat radiation, overpressure, and toxic concentrations to lethal consequences are provided in the Green Book and were implemented in the same software. The probability of scenarios, physical effects, and damage is influenced by many parameters. It can be assessed by using fault trees, event trees, case histories, or following the Red and the Purple Book. Risk is finally determined from two attributes: the adverse effects (consequences) of an accident and the frequency with which these consequences occur. In the QRA study presented in this chapter, two types of risks are considered based on Dutch legislation (Ministry of Infrastructure and Environment, 2010): locational risk (LR) and societal risk.
The first is defined as the frequency per year that a hypothetical person will be lethally affected by the consequences of possible accidents during an activity involving hazardous materials, for example, a chemical plant or transport activities. This risk indicator is a function of the distance between the exposed person and the activity, regardless of whether people are actually living in the area, or at the specified location. LR is presented in contours on maps of the surroundings; the contours connect locations of equal LR. The LR is sometimes also referred to as the individual risk (Section 7.2). Societal risk is defined as the cumulative frequency that a minimum number of people will simultaneously be killed due to possible accidents during an activity with hazardous materials. Here, the actual presence of people in the surroundings is taken into account. The societal risk for transport activities is calculated per single kilometer. Societal risk is also called “group risk.”
According to studies by several authors, the overall methodology proposed in Fig. 12.1 can be applied when considering natural hazards as the triggering event for the structural failure of industrial equipment, provided that the vulnerability of the equipment is evaluated in terms of loss of containment of hazardous materials (Fabbrocino et al., 2005; Campedel et al., 2008; Salzano et al., 2009).
12.3. Description of the Case Study
A refinery on the Mediterranean coast was selected for this study. In the considered installation many storage tanks are present, containing a large variety of hydrocarbons, such as LPG, gasoline, gasoil, crude oil, and atmospheric and vacuum residues. The capacities of the tanks vary from about 100 m3 (fuel oil, gasoil, gasoline, kerosene) to 160,000 m3 (crude oil). All tanks are located in catch basins (bunds) with concrete surfaces. Solely the LPG is stored in pressurized spheres, all others in single containment tanks.
In order to evaluate the societal risk, the (actual) presence of persons in the surroundings of the refinery needs to be taken into account, since the number of persons present influences the societal risk. Fig. 12.2 presents the population distribution considered for the test case.
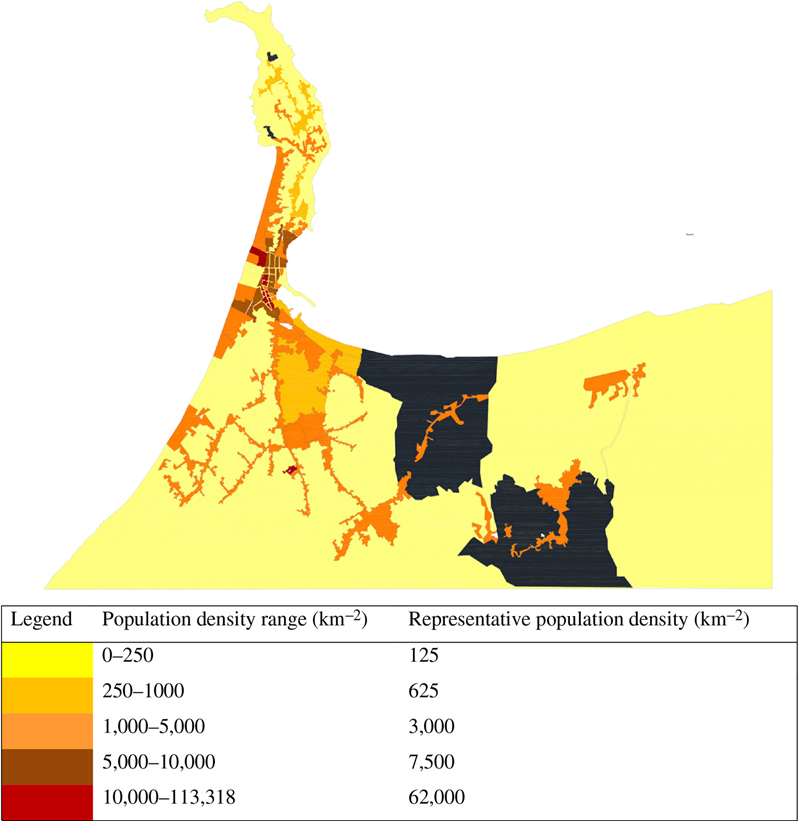
Figure 12.2 Population Distribution per km2 Used for the Case Study
For the present QRA no distinction was made between day and night population densities. Rather, it was assumed that the population distribution does not vary between day and night. Two weather classes were considered: (1) D5: neutral atmosphere with 5 m/s wind, which occurs during both day- and night-time, and (2) F1.5: very stable atmosphere with 1.5 m/s, which occurs only during the night. The probability of a specific wind direction is random, that is, the wind rose is circular. The standard accident scenarios and related frequencies adopted for the QRA of the given test case are reported in Table 12.1.
Table 12.1
Standard Scenarios and Associated Frequencies for Industrial Accidents
| Scenario | Frequency (Year−1) | |
| Atmospheric Vessels (Single Containment) | Pressurized Vessels | |
| Instantaneous release of the complete inventory | 5 × 10⁻⁶ | 5 × 10⁻⁷ |
| Continuous release of the complete inventory in 10 min at a constant rate of release | 5 × 10⁻⁶ | 5 × 10⁻⁷ |
| Continuous release from a hole with an effective diameter of 10 mm | 10−4 | 10−5 |

Normally, two pipe-related scenarios are considered for QRA’s: a full-bore rupture and a small leak. Depending on the configuration of the pipe, a full-bore rupture could result in a two-sided outflow, that is, outflow determined by the upstream equipment/conditions and back flow from the downstream equipment. In order to consider pipe failure correctly, detailed information on its layout, operating conditions, and implemented safety measures is necessary. Unfortunately, information at this level of detail is not available and therefore pipe-related accident scenarios as defined in the Purple Book were not taken into account. However, since pipes and pipelines might be more vulnerable to natural hazards than storage vessels, completely ignoring pipes would result in an underestimation of the impact of natural hazards on the overall risk. For this reason, an additional scenario was defined: the full-bore rupture of a pipe connected to a storage vessel, resulting in the loss of containment of the storage vessel. Backflow from downstream equipment is not considered. The failure frequency of the pipe connection is based on the Purple Book and 1-m pipe length (see Table 12.2).
Table 12.2
Standard Scenario and Frequencies for Above-Ground Pipes With Diameter D
| Scenario | Frequency (Year−1) | ||
| D < 75 mm | 75 mm < D < 150 mm | D > 150 mm | |
| Full-bore rupture | 10−6 | 3 × 10⁻⁷ | 10−7 |

Most tanks are located in large catch basins that encompass several tanks while each tank is located in a dedicated subbasin. This means that small spills remain contained in the subbasin where the leakage occurs without spreading to the other tanks, and for larger leakages the liquid can spread to the neighboring subbasin, but remains contained within the main basin. For the large-leak scenarios (instantaneous and 10-min release), we assumed that the liquid will spread beyond the subbasin. These scenarios have been located at the center of the main basin. For the instantaneous-release scenario we assumed that due to overtopping of the basin wall a surface of 1.5 times the main-basin area is covered by liquid. These assumptions are summarized in Table 12.3. Failure of the bund (basin) walls was not considered. Domino effects were also not taken into account although large pool sizes may cause domino effects upon ignition (e.g., BLEVEs of the LPG spheres).
Table 12.3
Pool Surface Areas
| Scenario | Pool Surface Area Considered |
| Instantaneous release tank | 1.5 × main basin |
| 10-min release tank | Main basin |
| 10-mm leak tank | Subbasin |
In case of the impact of a natural event, its hazard and the associated vulnerability of the industrial equipment need to be evaluated. For the specific location of the refinery, earthquake and tsunami hazards were assessed within the STREST project (STREST, 2016). The results were expressed in terms of PGA and hw2 occurrence, where PGA is the peak ground acceleration registered for the earthquake and hw2 is the product of the height and the velocity of the tsunami wave impacting the equipment. Here, the annual mean frequency of PGA exceedance is shown, for the sake of brevity (Fig. 12.3).

Figure 12.3 Hazard Curve in Terms of Mean Annual Frequency of Exceedance of Peak Ground Acceleration (PGA)
By combining natural-hazard curves and equipment vulnerabilities, new accident scenarios (expressed in terms of loss of containment like for conventional industrial accident analysis) were defined. The final results are listed in Table 12.4, where the representative scenarios and the corresponding annual frequencies are shown. More details on the procedure for Natech QRA can be found in Chapter 7, in the open literature (Salzano et al., 2003; Fabbrocino et al., 2005; Campedel et al., 2008; Lanzano et al., 2013; 2014; 2015; Basco and Salzano, 2016), and in STREST project deliverables (STREST, 2016).
Table 12.4
Accident Scenarios and Frequencies for Stationary Vessels due to Natural-Hazard Impacts (Salzano et al., 2003; Fabbrocino et al., 2005; Campedel et al., 2008; Lanzano et al., 2013; 2014; 2015)
| Scenario | Frequency (Year−1) | ||
| Earthquake | Atmospheric Vessels (Single Containment) | Pressurized Vessels | Pipes |
| Instantaneous release of the complete inventory | 3.70 × 10⁻³ | 1.16 × 10⁻⁹ | — |
| Continuous release of the complete inventory in 10 min at a constant rate of release | 3.70 × 10⁻³ | 1.16 × 10⁻⁹ | — |
| Continuous release from a hole with an effective diameter of 10 mm | 7.33 × 10⁻² | 0 | — |
| Full-bore rupture | — | — | 5.56 × 10⁻² |
| Tsunami | Atmospheric Vessels (Single Containment) | Pressurized Vessels | Pipes |
| Instantaneous release of the complete inventory | 1.85 × 10⁻⁵ to 3.47 × 10⁻⁴ | 0 | — |
| Continuous release of the complete inventory in 10 min at a constant rate of release | 1.85 × 10⁻⁵ to 3.47 × 10⁻⁴ | 0 | — |
| Continuous release from a hole with an effective diameter of 10 mm | 0 | 0 | — |
| Full-bore rupture | — | — | 0 |
| Earthquake + Tsunami | Atmospheric Vessels (Single Containment) | Pressurized Vessels | Pipes |
| Instantaneous release of the complete inventory | 3.7 × 10⁻³ to 4.05 × 10⁻³ | 1.16 × 10⁻⁹ | — |
| Continuous release of the complete inventory in 10 min at a constant rate of release | 3.7 × 10⁻³ to 4.05 × 10⁻³ | 1.16 × 10⁻⁹ | — |
| Continuous release from a hole with an effective diameter of 10 mm | 7.33 × 10⁻² | 0 | — |
| Full-bore rupture | — | — | 5.56 × 10⁻² |

For earthquake-induced Natech accidents, the release frequencies are location-independent: all atmospheric vessels have the same release frequency, as do the pressurized vessels and pipes. Small releases are not considered for pressurized vessels. The frequencies refer to the likelihood of failure of one or more tanks as a result of the earthquake or tsunami. It is assumed that one catch basin is large enough to hold the volume of the failing tanks and that the catch basin remains intact during and after an earthquake or tsunami. Hence, the pool size is not affected by the number of tanks collapsing. Similar to conventional industrial risks, for the earthquake-triggered instantaneous-release scenario we assumed that due to overtopping of the basin wall a surface of 1.5 times the main-basin area is covered by liquid. The consequence analysis was based on the released volume of one tank.
For tsunami-induced releases the location of the vessel determines the release frequency. Only vessels within approximately 250 m from the shoreline will suffer damage due to the tsunami and release their contents. The release frequency is not the same for all vessels. For instance, all pressurized vessels are located further inland away from the shore and will not be affected by the tsunami. No pipe ruptures or small leakages are caused by the tsunami, no matter where the vessels or pipes are located.
Not all hazardous substances present on site were considered individually, and representative substances were used instead. Table 12.5 shows which representative substance was used for each product. Atmospheric residue, heavy vacuum gas oil, and vacuum residue were not considered in the QRA.
Table 12.5
Representative Substances
| Product | Representative Substance |
| Atmospheric residue | NA |
| Crude oil | Pentane |
| Fuel oil | Nonane |
| Gasoil | Nonane |
| Gasoline | Pentane |
| HVGO | NA |
| Jet fuel/kerosine | Nonane |
| LPG | Propane |
| Naphtha | Pentane |
| Others | Pentane |
| VAC residue | NA |
12.4. Results and Discussion
The risk of each separate event was first compared, that is, industrial risk from conventional release sources not related to natural hazards, earthquake- and tsunami-induced risks. Fig. 12.4 presents the LR contours for each of these risks. The black crosses indicate the location of the scenarios.

Figure 12.4 Locational Risk—Single Causes Only
Conventional industrial risks result in large contours, especially for the lower risk levels (10−7 and 10−8 year−1). These contours are dominated by the risks related to the LPG storage vessels.
When considering only earthquake-induced risks, the 10−7 and 10−8 year−1 risk contours are smaller. This is due to the lower release frequency for the LPG tanks compared to conventional accident causes. The higher risk levels (> 10−6 year−1) are dominated by the atmospheric tanks which for earthquakes have a higher release frequency compared to that of conventional industrial risks, resulting in larger 10−5 and 10−4 year−1 contours. The industrial risks on the right side of the site are mainly caused by the atmospheric tanks. When comparing pure industrial risks with earthquake-induced risks, one can observe that in case of an earthquake the risks on the right side of the site have increased by a factor of approximately 1000 and that the 10−4 year−1 contour is located at almost the same location as the 10−7 year−1 contour for conventional industrial risks. This is due to the failure frequency of atmospheric tanks being a factor 1000 higher for earthquakes than for failure due to conventional accident causes.
The risks associated with tsunami-induced releases are the smallest of the three release causes. Only atmospheric vessels close to the shore were predicted to result in hazardous-materials releases. Vessels located further away do not pose risks.
Fig. 12.5 shows the LR when considering (1) industrial + earthquake-induced risks; (2) industrial + tsunami-induced risks; and (3) industrial + earthquake- and tsunami-induced risks. The most dominant risks are the industrial and earthquake-induced risks. The figure indicates that for this pilot case, low risks (< 10−6 year−1) are dominated by the industrial risks as they are caused by failure of the LPG vessels from causes not related to natural hazards. Earthquake and tsunami do not damage these vessels.

Figure 12.5 Locational Risk—Cumulated Risks
Natural hazards cause an increase in the total risk levels. As the tsunami only damages a limited number of vessels along the shore line, the risk increase is, however, limited. Similar results for earthquakes only and involving a simplified analysis of the earthquake hazard, can be found in Salzano et al. (2003, 2009), Campedel et al. (2008), or Fabbrocino et al. (2005).
Fig. 12.6 shows the societal risk per accident cause. Up to approximately 200 fatalities, Natech accidents from earthquake and tsunami provide a more important contribution due to the higher failure frequency of the atmospheric tanks under these conditions. Larger numbers of fatalities are only caused by industrial risks or earthquakes. This is due to consequences from the failure of the LPG vessels which are not affected by the tsunami due to their location further away from the shore.

Figure 12.6 Societal Risk—Industrial, Earthquake- or Tsunami-Induced
12.5. Conclusions
Natural hazards can play an important role in the total risk of installations with hazardous substances. In this study, the effect of an increased frequency (caused by earthquakes or tsunamis) of a number of hazmat release scenarios on locational and societal risk was assessed.
The impact of natural hazards depends on many (location-specific) factors. For the site analyzed in this study, the tsunami damaged only a limited number of atmospheric storage vessels along the shore line. Hence, the increase of the total risk due to tsunami is limited. Nonetheless, the potential overloading of emergency response should be considered, at least for the tanks along the coastline.
Of more importance is the effect of an earthquake, which significantly increases the failure frequency of atmospheric storage tanks. However, neither an earthquake nor a tsunami considerably increases the failure frequency of and hence the risk posed by pressurized vessels (like LPG spheres). Since for the considered site the risk is largely dominated by the LPG tanks (which fail due to accident causes not related to natural hazards), the impact of these natural events is limited.
This pilot case was performed to show the impact of natural hazards on the outcome of a quantitative risk analysis of an industrial site where hazardous substances are present. The aim was not to perform a detailed QRA of the pilot site (for such an exercise much more detailed information would have been required) but merely to show how (the most common) accident scenarios are affected by an increased release frequency caused by earthquakes and tsunamis.
Other scenarios that can be relevant in case of earthquakes or tsunamis were not evaluated. For instance, failure of multiple tanks was not taken into account. However, multiple and simultaneous releases may result in release volumes that can exceed the catch basins’ capacity, and hence lead to larger pool sizes, especially if the catch basins fail. Domino effects were also not considered although cascading events can be more frequent during Natech accidents (cf. Chapter 3 and Section 7.3.2.2). For instance, if a pool of flammable material extends to an area with LPG spheres, BLEVEs may occur. The impact of debris (or large objects like ships) swept onshore with a tsunami is also a source of danger to hazardous industry that was not taken into account in this study. Such phenomena will result in larger impact areas, and hence may increase the number of casualties.
It is interesting to note that with earthquakes and tsunamis having large impact areas, many of the fatalities calculated in the QRA might have occurred also had such an installation not been present, for example, due to building collapse. In other words, the additional number of casualties caused by the damaged industrial installations may very well be much smaller under these conditions. Nevertheless, natural hazards can be an important contributor to the overall risk level of a hazardous installation and should therefore be considered in a facility’s risk assessment to ensure appropriate prevention and preparedness.
..................Content has been hidden....................
You can't read the all page of ebook, please click here login for view all page.