Chapter 3

The Great Rebalancing: Rattling the Electricity Value Chain from Behind the Meter

Robert Smith*
Iain MacGill**
*    East Economics, Sydney, NSW, Australia
**    Centre for Energy and Environmental Markets (CEEM) and School of Electrical Engineering and Telecommunications, University of New South Wales, Sydney, NSW, Australia

Abstract

This chapter aims to redress traditional conceptions of the electricity value chain which have focused heavily on costs on the grid side of the meter. DER is now driving a great rebalancing, rattling the value chain and refocusing the sector on costs and benefits behind the meter. Most assets are behind the meter and the consumer surplus from energy services is almost certainly the largest segment of the value chain. This raises questions about the relevance of the meter as the key dividing line in the industry value chain. The chapter then considers the implications of this great rebalancing for cost reflective pricing and regulation.

Keywords

distributed energy resources
value chain
electricity grid
distributed generation
battery storage
electricity distribution
Reforming the Energy Vision
platform economy
share economy

1. Introduction

Change is afoot for the electricity sector. As reflected in other chapters in this volume, the exact end point remains contentious but there is broad consensus on the direction and the drivers. Distributed energy resources and renewables are in; centralized generation and fossil fuels are on the way out. Driven by climate change and new technology, the grid is being reshaped and a recalculation and redistribution of the electricity value chain is under way. Innovation and disruption at the grid’s edge is happening on a scale not seen for over 100 years. And within this metamorphosis the links in the value chain facing the greatest uncertainty appear to be the bits in the middle, the regulated monopoly transmission and distribution networks.
The electricity sector in transition is a study in contrasts. Generation is still dominated by large-scale coal, hydro, and nuclear generation who’s designs, and in some cases actual plants, are 50 or more years old. Cables, transformers, poles and wires, and the simple accumulation meter have changed little in the past 100 years. However, the past decade has seen extraordinary growth in renewables, particularly wind and solar. Over 15% of Australian households have rooftop PV installed as further described by Mountain & Harris, Biggar & Dimasi, and Webb et al. Yet even as ubiquitous connection of end-use appliances foreshadows an “Internet of everything,” described by Knieps, many key end-use technologies, like electrical resistance storage hot water systems, space heaters, and cooktops, remain similar to they were in Edison’s days.
With the changes underway the traditional value chain and business model seems a poor fit for the 21st century grid. The traditional model is based on monopoly regulation that guarantees returns on regulated assets deemed to have a “used and useful” life of 40 years and funded through volumetric tariffs. Guaranteeing returns out 40 years is problematic when auguring the future of the grid out even 5 years has become increasingly challenging. One way to see beyond the uncertainty, to separate what is possible and practicable from what is fanciful, is to follow the value chain.1
The value of electricity to its original end-use customers was immense. At the start, in its first key role of lighting, it was considerably more expensive than existing gas lighting but still offered greater value—particularly in terms of safety, simplicity, illumination, and cleanliness.2 From its Pearl Street New York roots the original electricity value chain quickly grew to serve an amalgam of diverse and disparate end users linked together by transmission and distribution.3 A value chain anchored to remote centralized generation at one end and local customers at the other.
Now new technologies in local energy creation and storage means that, for increasing numbers of end users, the value chain has slipped its anchor. Even the need for the “poles and wires” is being reassessed as with DER generation value finds a haven closer to home embedded among energy users.
This chapter examines the disruption and innovation of the value chain at the grid’s edge, looking: first, in Section 2 at what made the traditional value chain so effective; then in Section 3 at new visions for the value chain and complexity; next in Section 4 at the value of the tariff cost stack compared to the full value chain; and finally in Sections  5 and  6 at DER’s role in the full value chain and drawing conclusions.

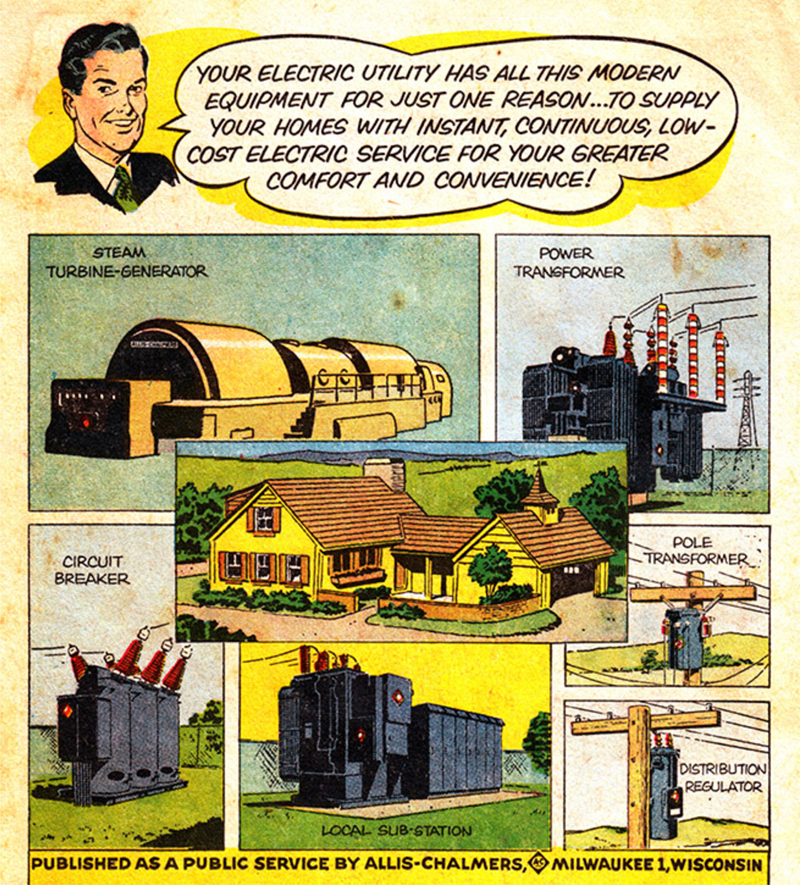
2. Greater comfort and convenience

As the widespread consensus has shifted in favor of a disruptive future for the grid it is worth revisiting and remembering the strength of certainty about the centralized value chain which existed in the past.
The image the industry sought to project is shown in Fig. 3.1 from a utility public relations comic of the 1950s. While this is utility propaganda from the postwar golden age for electricity it also reflects the view largely supported by regulators, investors, and customers into the start of the 21st century.
image
Figure 3.1 Electricity service for your greater comfort and convenience.
The advantages of the traditional centralized utility network model emerged after Westinghouse, with Tesla in his corner, defeated Edison in the “current wars” and alternating current became the standard for electricity distribution, largely because of its superior ability to carry power over long distances. Thomas Insull at Consolidated Edison in Chicago then shaped the business model, institutions, and value chain to support utilities as regulated monopolies.4 Since Insull’s day, regulation, deregulation, and reregulation has fractured and recombined the institutional and financial elements of the value chain within different jurisdictions. However, the physical elements of the chain in generation, transmission, distribution, and retail remained relatively stable through the 20th century and the utility model also proved remarkably resilient.
This stability was based on delivering value. Three things combined to drive the centralized electricity grid’s value proposition: economies of scale, continuous load growth, and diversity of use.
The scale economies come from the engineering properties of equipment, bigger is better value per unit of output, and from customer density, the more customers at a location the cheaper to serve each. Continuous growth ensures that you can capture the benefits of scale economies. You could never build too big only too soon, as eventually demand grew to absorb the extra capacity obtained cheaply though scale economies. Indeed, scale economies, supported by load density from geographic proximity and continuous growth, created enough surplus value from urban, commercial, and industrial supply that it could often be used to cross-subsidize remote, rural, and disadvantaged users.
Less obvious, particular once the industry matured, were the critical advantages of load diversity. The recently developed concepts of the share economy, shareconomy,5 the connected economy, peer economy, platform economy, access economy, and collaborative consumption are based around increased utilization of assets through customer’s joint usage. Under this new value chain, the business models of companies like Uber and Airbnb are built around facilitating consumers to share the underutilized assets they own with others. Diversity of load in the electricity grid, however, also ensures asset sharing that dramatically cuts the cost of capacity and of supplying reliable and resilient energy services to customers. Customers are interconnected, value is shared, and consumption is collaborative, but assets are owned by regulated monopoly utilities.
Diversity works like magic to get extra use out of a given capacity. As customers’ individual loads are not perfectly correlated, the average customer load at time of system peak is substantially less than the sum of each customer’s individual peak load. Australian customers’ data have shown that while an individual residential customer’s 90% Probability of Exceedance (POE) peak demand may average 11 kVA, for a group of 32 customers this more than halves reducing to 4.6 kVA and then for 1000 customers reduces further to 2.6 kVA, and for 1 million customers then shrinks to 2 kVA.6 Where a standalone electricity system might therefore have to provide 11 kVA capacity to serve its single customer, a network serving 1 million similar customers only needs to be able to provide 2 kVA per consumer.
Economists hold the “there is no such thing as a free lunch” but when scale favors larger generation and distribution, growth ensures scale advantages are realized and diversity spreads capacity usage across customers the marginal cost of grid capacity becomes extremely low. These scale and diversity benefits tend to be largest at the generation level and smaller closer to the customer. And this has implications for the economics of DER that aren’t well appreciated in much of the discussion.
While DER is becoming increasingly attractive compared to averaged volumetric tariffs it is easy to forget that the traditional electricity grid benefits which come at the aggregated system level (and underpinned low average kWh tariffs) are potentially lost or unable to be realized at the customer level for DER. Therefore, the network benefits of individual customer’s efforts to manage their own peak loads are not fully reflected up the value chain as the impact of individual load profiles on the system peak has already been reduced due to diversity, and the cost reduced due to scale economies.
The attraction of the old grid model was not lost on investors. Benjamin Graham in his 1949 seminal work on value investing, The Intelligent Investor, described the “comfortable and inviting situation” of utilities for conservative investors:

The position of utilities as regulated monopolies is assuredly more of an advantage than a disadvantage for the conservative investor. Under law they are entitled to charge rates sufficiently remunerative to attract the capital they need for their continuous expansion, and this implies adequate offsets for inflated costs. While the process of regulation has often been cumbersome and perhaps dilatory, it has not prevented utilities from earning a fair return on their rising invested capital over many decades.7

Over 75 years later, Grahams’ protégé and major proponent, Warren Buffet, has continuing confidence in the business model for electricity utilities investments:

Our confidence is justified both by our past experience and by the knowledge that society will forever need huge investments in both transportation and energy. It is in the self-interest of governments to treat capital providers in a manner that will ensure the continued flow of funds to essential projects. It is concomitantly in our self-interest to conduct our operations in a way that earns the approval of our regulators and the people they represent.

But notes that this confidence is being challenged:

In its electric utility business, our Berkshire Hathaway Energy (“BHE”) operates within a changing economic model. Historically, the survival of a local electric company did not depend on its efficiency. In fact, a “sloppy” operation could do just fine financially. That’s because utilities were usually the sole supplier of a needed product and were allowed to price at a level that gave them a prescribed return upon the capital they employed. The joke in the industry was that a utility was the only business that would automatically earn more money by redecorating the boss’s office. And some CEOs ran things accordingly. That’s all changing……. tax credits, or other government-mandated help for renewables, may eventually erode the economics of the incumbent utility, particularly if it is a high-cost operator. BHE’s long-established emphasis on efficiency—even when the company didn’t need it to attain authorized earnings—leaves us particularly competitive in today’s market (and, more important, in tomorrow’s as well).8

However even Warren Buffet, the world’s most successful investor, may be underestimating the changes planned by some. BHE’s long-established efficiency in the old business model may not be enough if the shape of the value chain is radically altered by cost-effective DER and reconfigured regulation. While Gellings in his chapter doubts the need for a new business model, most other contributing authors doubt the continued viability of the old model.

3. New visions of the value chain: rhetoric, reality, regulation, and the REV

Despite early concerns, it is now apparent that customers with existing grid supply and DER will not to go off-grid in large numbers, at least in the near term.9
In essence, while volumetric tariffs price the grid mainly on kWh usage, a grid connection provides a bundle of services which are independent of energy volumes and which are still highly valued by customers. Due to these services the new value chain and business models being constructed still hold a role for the “poles and wires” networks. A continuing role for the grid is uncontentious. What is highly contentious is what the role will be, how it is paid for, and by whom. The uncertainty created by DER, particularly for transmission and distribution, has spawned a spate of new models with snappy labels and snazzy infographics but few insights and fewer answers.10
Looking at PwC’s analysis as one of the better examples, Fig. 3.2 shows 10 areas interconnected in a “new market paradigm” which is so dense with links that the real interest becomes why some areas are not interconnected. With 35 of 45 possible links shown why should new entrants not have a connection to retail? Or distributed generation lacks a connection to storage? The picture can be replaced by a simple statement; in the new value chain you need to understand how everything is connected to everything else.
image
Figure 3.2 PwC’s new market paradigm.
PwC’s attempt to encapsulate the value chain and different parameters into eight possible business models is shown in Fig. 3.3 but where to disentangle the value which underpins the business model labels is left to imagination.11
image
Figure 3.3 PwC’s business model choices.
Knowing that things are connected and that value is involved is not enough to enable you to map how it is connected and can be restructured.
Regulators in major jurisdictions, as Conboy, Picker, and Zibelman state in the opening of the book, are repositioning the rules and incentives to respond to DER but also to rattle and rearrange the traditional value chain. New rules are needed to better align the underlying economics of DER with tariffs and costs. And some rule makers are proving highly proactive. For example, Ofgem’s RIIO (Revenue = Incentives + Innovation + Outputs) approach in the United Kingdom is attempting to embed climate change, innovation and stakeholder’s interests into the regulatory frameworks for gas and electricity prices. It involved radical change and is designed to accommodate innovation and DER, yet at its core it is still cost-to-serve monopoly regulation.12
The most ambitious, certainly most impressive sounding, attempt to rearrange the regulated links of the value chain, however, comes from the birth place of the grid, New York. Reframing the Energy Vision (REV) represents one of the most radical attempts to reshape regulation of the grid in the past 100 years.
The REV has its genesis in 2012 after Superstorm Sandy when the New York regulator, as discussed by Zibelman, took the approach that traditional cost-to-serve ratemaking was untenable for 21st century.13 The response was the REV a “modern regulatory model that challenges utilities … by better aligning shareholder financial incentives with consumer interest.”14
The REV framework proposes radical changes to support and incentivize third-party involvement and a Distributed System Platform (DSP) which mimics other sectors like Telcos and smartphone apps where:

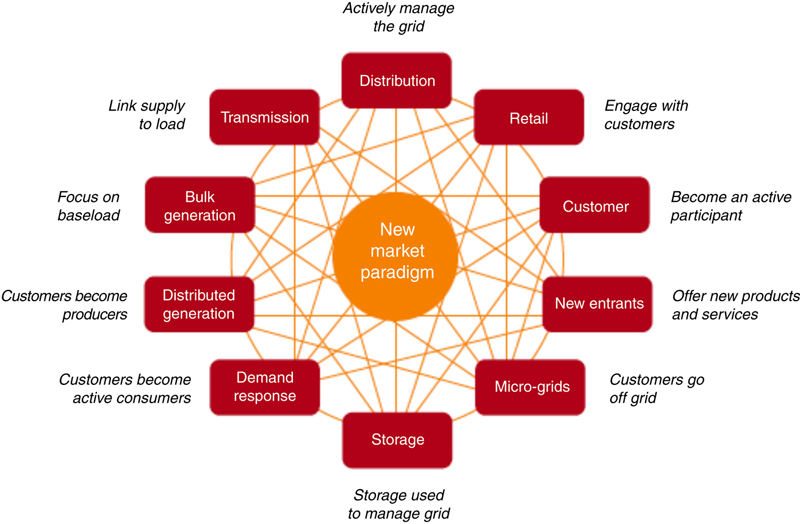
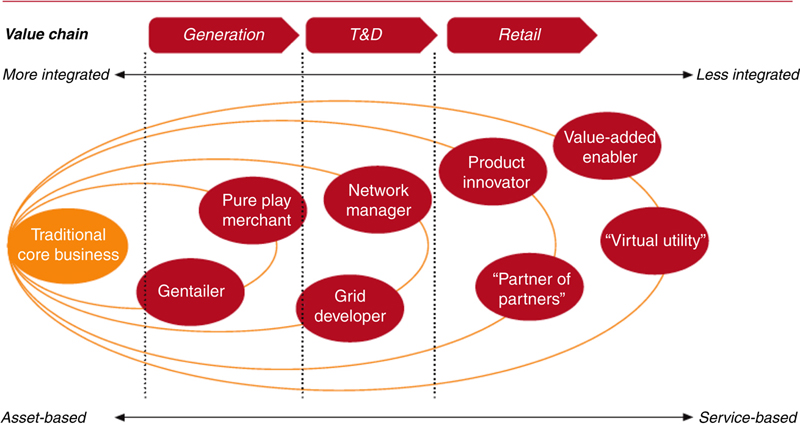
the traditional provider’s role has evolved to a platform service that enables a multi-sided market in which buyers and sellers interact. The platform collects a fee for this critical market-making service, while the bulk of the capital risk is undertaken by third parties.15

The new REV role for the networks is as market-maker not as asset owner and manager; no longer an owner of physical links in the value chain but a linker of chain components which will “reorient the electric industry and the ratemaking paradigm toward a consumer-centred approach that harnesses technology and markets.”16
This effectively aims to turn the traditional electricity business model on its head. It assumes new digital technology can solve major problems by creating efficient signals through market prices. New price signals that will vaporize the old problems of monopoly market power, information asymmetry, the sunk costs in large and lumpy capital, scale economies, instantaneous flow, socially sanctioned and accepted cross-subsidies, and the value of diversity and trade; problems that have exercised regulators minds for over a century. The success or failure of radical visions like the REV depends on whether these problems are actually addressed rather than merely shuffling them along the value chain. Whether this is rhetoric or reality depends on whether the underlying problem of DER innovation and disruption is complex or merely complicated.

3.1. Complicated or Complex?

Understanding the technical issues of voltages, storage losses, two-way flows, efficient dispatch, and establishing efficient prices is important for imaging the future of the grid but is unlikely to be sufficient. This is because the issues of innovation and disruption at the grid’s edge are complex rather than complicated.17
Complicated problems are ones where rules and relationships are numerous and may not be known, but are known to exist. They differ from a simple problem mainly in scale. Big computers and big data can crunch and crush these types of problems. Yet while the management of well-established industries like the grid tends to be complicated, industry transformations are complex. A complex problem is one where rules are not known and not knowable, and relationships are not clear or changeable. A complicated problem is likely to involve estimates of performance and risk which are measurable or have probabilistic boundaries; a complex problem is likely to involve uncertainty, which by definition is not amenable to measurement.
Designing an electric car, the battery and power delivery system that drive it is complicated but now seem poised for mass market adoption.18 By comparison, forecasting the adoption rate of electric vehicles is complex, more so now that EVs are naturally twinned to the emergence of autonomous vehicles as further described by Webb & Wilson. Not only are forecasts required of uncertain EV technology progress there are also uncertainties about policy responses, autonomous vehicles, conventional fuels and fuel prices, geopolitics, climate change, and customers’ preferences and behaviors.19 And the uncertainty that prevails for EVs has parallels across other products, technologies, sectors of the economy, and customer segments at the grid’s edge.
A view that the value chain is complicated rather than complex, and hence amenable to organized rearrangement, underpins much of the rhetoric of current attempts at grid value chain redesign and business model creation. This perception underestimates the complexities of interactions across the value chain and, in particular, the understanding required of customer value.
Speaking at a World Future Society function in 1977 Ken Olsen, founder of the then technology giant Digital Equipment Corporation, said “There is no reason anyone would want a computer in their home.” This quote went on to be listed as one of the worst predications of all time.20 Yet it was taken out of context. Olsen’s speech actually debunked the popular and persistent postwar notion of the fully automated home where a computer could, and would, control the key aspects of our lives from the lights and appliances to diet and exercise. In its original context it has proven remarkably prescient for over 40 years, a time span similar to predicting from now to 2057. Technical complication has not stopped the automated home developing beyond the grid’s edge, it is the complexity of aligning technology and regulations with what customers’ value.
What was missing in 1977, and still needs to be found, is a place within the existing full electricity value chain to fit a new customer value proposition, and around which new business models that incorporate innovation and disruption can be built.

4. The tariff cost stack, the mystery beyond the meter and the full electricity value chain

In the early days of the electricity sector, utilities were focused on customer value and what went on beyond the meter. Utilities had appliance stores, promoted extra plug points into houses, had salesmen, actively competed with gas, and saw themselves as providing a new, modern, and cutting edge technology. With regulation, rate cases, deregulation, and reregulation, together with the inevitable torpor that comes with technology and industry maturity, this customer focus was lost.
As the industry matured the customer became a number, a meter identifier, a billing code, or at best a stream of data points from a meter. Volumetric tariffs, based on averages and therefore economically inefficient,21 raised enough revenue and worked well enough in a world of continued growth (see Haro et al.). The industry took for granted that it delivered an “instant, continuous, low-cost electricity service for your greater comfort and convenience.” The utilities link to end users weakened and the incentives for them to see the world from beyond the meter, to understand what customers’ value, grew fainter.
So, while the value of the utilities regulated assets which are built into tariffs was weighed and measured, debated and routinely dragged through the courts, what customers do, including the value of customers’ assets, became a mystery. The electricity value chain behind the meter has not been thought of as either part of the larger electricity system or its own household microgrid but as individual elements. Appliance purchases are made individually, as one-off decisions by consumers for a fridge, a phone, or a George Foreman grill and as part of the value chain of product manufacturers and retailers not the electricity sector.
Once considered as a whole it becomes clear that the majority of the investment in the grid, broadly defined, is done by it users and the largest part of the value chain is behind the meter. The traditional grid value chain, as it is commonly calculated and depicted, is better viewed as a “wholesale + network + retail” tariff cost stack. The tariff cost stack is typically driven by generation pricing (with competitive wholesale markets in some jurisdictions), monopoly network cost-plus and rate of return regulation (either with or without added incentives), and a retail operation and profit margin placed on top to create a price, the tariff, that is seen by customers in the market.
The asset value of the traditional grid value chain, the “tariff cost stack” elements, is simultaneously both simple to measure and complex to understand. This is because some parts (the networks) have published regulated assets values, while others have revenues set by market values and no official asset values. The prices which drive the regulated revenues are based on estimated asset values which in a competitive market would be the basis for setting asset values.22 Regulated distribution and transmission asset values are therefore well reported but artificial.
In Australia pool prices and long-term contracts should allow calculation of true generation asset values but estimating these is increasingly confabulated and confused by decisions about energy policy. Estimates are unstable as, for example, current high pool prices reflect underlying costs but also incentives for renewables and carbon pricing, recent closures of gas fired and brown coal generation, uncertainty about interconnectors, national and international climate change policy, and geopolitics more generally.
An official view at a time of relative stability, c.2010, estimated the value of traditional grid assets in the Australian National Electricity Market (NEM) as over $100 billion comprising of: $40 billion generation (for the major generation assets operating in 2008 and not including new renewables); $17 billion for transmission; and $46 billion for distribution.23 This can be viewed as the tariff cost stack or value chain to the meter. More recent regulated asset values, as at 2015, have transmission assets as similar at $18 billion but distribution increasing to $64 billion24 and this suggests a total tariff cost stack value of around $125 billion (Table 3.1).

Table 3.1

The Electricity Tariff Cost Stack, Australian Grid Asset Values 2015

$ Billion
Powerlink 6.6
TransGrid 5.8
AusNet 2.5
ElectraNet 2.0
TasNetworks 1.2
NEM Transmission 18.2
Energex 10.9
Ergon Energy 9.0
Ausgrid 14.6
Endeavour 5.7
Essential 6.9
ActewAGL 0.8
Powercor 3.1
AusNet Services 3.2
United Energy 1.9
CitiPower 1.7
Jemena 1.1
SA Power Networks 3.6
TasNetworks 1.5
NEM Distribution 64.1
Western Power 10.0
Total 74.1

Source: www.aer.gov.au

The traditional value chain of the electricity grid is shown in Fig. 3.4. Regulation of the industry, and the tariff structures that come with it, have shaped the way the electricity system is seen, operated, and people relate and respond to the grid. It has a linear flow that follows the flow of electrons through the system. The grid boundary, in people’s minds, in regulation and in legislation stops at the utility meter. Its end point is seen as the value at the meter where the retail tariff is measured and applied.
image
Figure 3.4 The traditional electricity grid value chain.
Even before recent changes this view was limited. Missing from the tariff cost stack view of the electricity value chain is the activity on the customer side of the meter.
The meter and the retail tariff are better seen not as the end point but as the midpoint of the value chain for electricity customers. Beyond the meter customers have always made substantial investments to derive value from electricity. The value of electricity is not just the tariff cost but the cost of everything that consumers themselves do and pay for on their side of the meter to get benefits from electricity as shown in Fig. 3.5.
image
Figure 3.5 The customer-side value chain.
Most obviously the true end point includes the cost of appliances and equipment - the whitegoods, TVs, phones, and gadgets for households and equipment, machinery, and computers for businesses. Beyond this are the customer internal electricity infrastructure, fixtures and fittings, wiring, lighting, building design and maintenance, as well as investments in energy efficiency that support customers in deriving benefit from grid electricity. But even adding this customer cost stack on top of the tariff cost stack does not create the true top of the value chain.
The true top of the value chain is the well-being, quality of life, or satisfaction that is felt by end consumers. The gap between costs and value in use is consumer surplus25: the difference between what a customer actually pays for all the components required for what electricity delivers, and what they would pay if they were made to pay the maximum they could. This component of the value chain is also missing from most of the new business models’ understanding of value.
When broadly defined and considered as a whole it becomes clear that the majority of the value chain is on the users’ side of the meter. However, customers’ holdings of electricity assets are challenging to calculate. There is no centralized accounting as is done for regulated assets but rough estimates show that meter-side assets greatly exceed in value the grid-side assets that make their way into tariffs.
Variations in the value chain exist for particular customers, locations, circumstances, and needs—such as off-grid customer, cogeneration, and controlled loads—but for most of the 20th century and the majority of electricity customers, the customer cost stack has been remarkably stable and linear.
Now, as DER is becoming widespread it is stepping across and blurring the boundary of what value belongs to the grid (Fig. 3.6). These “new” components of the value chain have been possible for decades, but struggled to compete with the value for money of centralized grid electricity. As their kWh costs have fallen compared to conventional industry tariffs they are now poised to increase investment behind the meter and tip the existing imbalance further toward customer assets.
image
Figure 3.6 DER additions to the value chain.
Importantly, the new DER additions to the value chain is not simply tacked on to the end of the tariff cost stack, it needs to be seen as a value wedge positioned between the meter and customers’ own existing value add and consumer surplus.

4.1. Customer Assets Beyond the Meter

A full estimate of end users’ asset holdings within the electric value chain is a separate, larger topic. However, preliminary estimates from various data sources available for Australia confirm that the investment by customers, before considering new technologies in DER, considerably exceeds the roughly $125 billion value of grid-side asset investment.
One simple perspective of households electricity asset holdings comes from household expenditures shown in Table 3.2.

Table 3.2

Australian Household Expenditures (Australian Bureau of Statistics, 2011)

Household expenditure on goods and services $ per week 2009-10
Lowest Second Third Fourth Highest All households
Electricity (selected dwelling) 16.83 21.00 23.28 27.45 32.60 24.23
Whitegoods and other electrical appliances (excluding stoves and related) 5.47 10.14 9.53 10.47 15.64 10.25
Cooking stoves, ovens, microwaves, hot plates and ranges 0.98 *1.68 1.69 *3.45 5.17 2.60
Audio-visual equipment and parts 7.28 10.74 12.29 18.08 23.46 14.37
Home computer equipment (including pre-packaged software) 1.58 5.15 7.87 9.21 13.16 7.39
Blank and pre-recorded media (excluding pre-packaged computer software) 2.31 4.33 6.09 9.54 13.42 7.14
Appliances (selected & media) 17.62 32.04 37.47 50.75 70.85 41.75
Appliance spendi as a % of Electricity spend 105% 153% 161% 185% 217% 172%

The latest 2015–16 survey is completed but unpublished however air conditioning, smartphone, and mobile computing usage has increased along with rooftop PV. Simultaneously there had been a bubble in distribution and transmission asset spending in Australia, as well as renewable generation and closures of fossil fuel plants.

Across expenditure groups, from the lowest to the highest quartile, more is spent each week on appliances and supporting assets needed to get utility from electricity than on electricity tariffs. On average households spent 72% more to get value out of electricity than they did to have it supplied by the grid. Across all households, c.2010, this spending was around $19 billion a year which, if assets have a life of 10 years, would exceed the $125 billion total value of all grid assets. And this is only the value of basic household applications before considering the full range of residential assets or any nonresidential assets.
The asset imbalance would be still more stark if to this simple view the following are added: household wiring, hot water systems, installation cost, lighting, design features, insulation cost, fixtures and fittings, and the increased uptake of newer technologies since 2010. Moreover, electricity tariffs include not only asset costs (the deprecation of longer lived regulatory assets and a WACC) but also operating costs as well as environmental levies and concession payments.
This imbalance between the grid side and customer side of the meter would be even greater but for the continuing efficiency gap across the meter due to the emergence of new technology and real price deflation. The benefits of technology have mostly accrued behind the meter in appliance efficiency and function, particularly in ICT. The grid side has lagged both because of its long lived assets (which are slow to turnover and incorporate new technologies) but also as, by their nature, grid assets are predominantly electromechanical whereas technology improvement has been greatest in electronics. This change is reflected in the price changes customers have seen for electricity and appliance as shown in Fig. 3.7.
image
Figure 3.7 Relative prices of electricity and household appliances, 1980–2015
(Australian Bureau of Statistics, 2016).
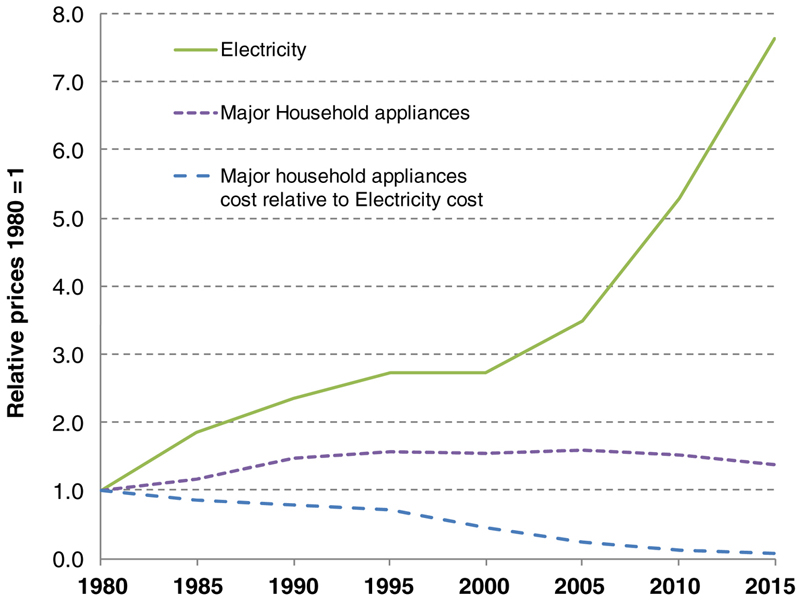
Prices are shown at 5-year intervals. Customer anger over electricity price rises has flowed from both historic expectation of real price deflation and “just price” concepts, which date back to St. Thomas Aquinas.
Balancing this lower cost of appliances is the increased number of new appliances. Household electric appliance and equipment numbers grew from an average of 46 in 2000 to 67 in 201026 and will be larger now. This trend has also seen a shift to high value but lower energy consumption appliances, such as smartphones, LED lights, digital TVs, and computers. These newer devices typically have lives shorter than traditional whitegoods and much shorter than the 40-year deemed life of regulated assets.
With little change in real prices, Australian retail sales of fridges and freezers have slowed to an average of around $1 billion a year, while washing machines, dishwashers, and clothes dryers combined also average about another $1 billion.27 Sales of these five major whitegoods over the last 20 years amount to around $32 billion, equivalent to a current optimized depreciated replacement cost of around $18 billion (approximately the value of all transmission assets). And, this has happened while the relative cost of appliances has been steady in real terms and the average fridge annual kWh usage has fallen over 40% due to energy efficiency.
Another perspective of the value chain is possible by taking an industry view, using IBISWorld28 estimates of revenue in selected industry sectors. This puts the total “tariff cost stack” value, based on annual electrical utility retail revenue, in 2016 as $46 billion, which is around $10 billion less than the revenues for just electrical equipment wholesaling.
For the retailing and service sectors where there is a clearly identifiable link to customers’ electricity use behind the meter, revenues top $50 billion per annum, as shown in Table 3.3. This is without being able to identify other substantial commercial, industrial, and transport uses. A comprehensive list of grid connected assets would uncover larger swaths of economic value. For example, it overlooks the billions invested in electric transport in trams and trains (not to mention elevators and lifts), all of which is outside of the traditional “tariff cost stack” accounting.

Table 3.3

IBIS World Revenue Estimates, 2016–17 ($ Billion)

Selected Wholesaling $B
Telecommunications and Other Electrical Goods 30
Computer and Computer Peripheral 18
Household Appliance 8
Electrical Wholesale 56
Selected Retail and services
Electrical Services 19
Domestic Appliance Retailing 14
Air Conditioning and Heating Services 7
Computer and Software Retailing 6
Electrical and Lighting Stores 2
Insulation Services 1
Elevator Installation and Maintenance 1
Domestic Appliance Repair and Maintenance 1
51
Electricity Grid
Fossil Fuel Electricity Generation 14
Hydro generation 2
Wind and Other Electricity Generation 2
Electricity Transmission 3
Electricity Distribution 17
Generation transmission and distribution 38
Electricity Retailing 46

Source: https://www.ibisworld.com.au/

Taking a different asset stock view, Australian national accounts estimates of net capital stock do not separate electricity equipment assets from other types of assets. Fortunately, the information technology capital stock (a part of the full electricity value chain) is estimated separately. On this measure alone, shown in Table 3.4, nonutility industry ICT assets exceed the value of all utility assets (including water and gas assets along with electricity).

Table 3.4

Australian System of National Accounts Information Technology Net Capital Stock, Selected Items by Industry

$ Billions
Computers and peripherals Electrical and electronic equipment Computer software Total
Electricity, gas, water and waste services 1.4 15.1 2.6 19.1
Information media and telecommunications 0.7 9.7 4.0 14.5
Financial and insurance services 3.0 1.6 9.2 13.8
Public administration and safety 2.8 1.8 5.4 10.0
Transport, postal and warehousing 0.8 3.3 4.6 8.7
Professional, scientific and technical services 1.6 0.9 5.4 7.9
Rental, hiring and real estate services 2.3 4.0 1.1 7.4
Retail trade 1.3 2.6 2.7 6.7
Wholesale trade 1.1 2.6 2.7 6.4
Manufacturing 1.0 1.9 3.3 6.2
Health care and social assistance 1.0 2.1 2.3 5.4
Construction 1.1 2.8 1.2 5.1
Education and training 1.0 1.0 3.0 5.0
Arts and recreation services 0.4 2.2 1.0 3.6
Mining 0.2 1.6 1.7 3.5
Accommodation and food services 0.3 2.4 0.3 3.0
Other services 0.3 2.1 0.5 2.9
Administrative and support services 0.6 0.3 1.6 2.5
Agriculture, forestry and fishing 0.2 1.5 0.4 2.0
Total 21.0 59.6 52.9 133.4
Total nonutility 19.6 44.4 50.3 114.3

Difficult as meter-side assets are to identify and value, consumer surplus is more problematic. The value of customer reliability (VCR) provides an imperfect proxy of consumer surplus, in terms of the costs associated with not having supply when it is expected. VCR estimates in Australia are typically two orders of magnitude greater than the cost of electricity.29
Even if an accurate estimate of the VCR was available the full customer surplus from electricity is still problematic. This is because in a real sense there is no standalone value chain for electricity. Electricity is always an input into another value chain, whether of cold beer, hot showers, or aluminum smelting. Electricity customers, now being labeled “prosumers” and “prosumagers,” have always used electricity to produce their version of value or utility in their businesses or homes. The formal objective of the Australian National Energy Market is “the long term interest of customers” but customers are only interested in electricity as an input into their household and business production functions for other outputs and outcomes.
The traditional electricity value chain is only one part of the overall economy and an increasingly smaller part as energy intensity declines. Yet the digital economy, climate change policy, and EVs make the overall economy more tightly coupled and bundled with reliable electricity supply. This can be seen in the stock of software assets in Table 3.4 which are worth more than ICT hardware assets. As electricity’s relative resource use falls and energy intensity declines its role in underpinning broader economy wide benefits is increasing. This highlights the importance of maximizing benefits, not just minimizing and allocating costs, as the way to increase value.
As the meter is clearly not the end point of the full electricity value chain the utility industry’s heavy focus on smart meters, tariffs, and the meter as the focal point for managing customer value is likely misplaced. The business models that will emerge need to look beyond the tariff and the meter to where the largest share of assets and greatest volume of value sits within households and businesses. And DER, wedged in just behind the meter, needs to find a place and value within the true value chain.

5. The DER dilemma for the true electricity value chain

DER costs, benefits, and grid impacts need to be seen in the context of the true value chain, including the consumer surplus rather than just the tariff cost stack view. This reflects Amory Lovin’s “hot shower and cold beer” approach, and also Lancaster characteristics theory’s that all goods and services can be viewed as the characteristics they deliver for the customer.
Household expenditure on distributed energy has been significant in Australia over the past decade. There is already around 5 GW of household PV systems involving an overall investment well over $10 billion. This has been a win for customers with PV but the former generous feed-in tariffs and non cost reflective kWh pricing has led to challenges elsewhere in the value chain.
Accommodating DER in the traditional business model was not an issue when investment was small, just one of the many manageable distortions and cross-subsidies ever present in the electricity sector. But when DER becomes large the kWh tariffs that create individual value at individual cost shifts too much of the shared network costs onto other consumers. In particular, DER may reduce network revenue far more than it reduces network costs creating an imbalance.
The dilemma for DER on the value side is that much of what it can offer is already included as part of the bundled service provided by grid electricity, and DER still requires some of the services of the grid to realize its value. Parts of the grids value proposition remain unchallenged and are valued even when other components are achieved with DER. In particular, if a grid connection is valued for reliability, emergency use, DER backup, or facilitating trading electricity, grid access to obtain any of these values means customers have access to all the others that come bundled with it. For example, if you have DER but retain a grid connection for reliability, the cost imposed on the transmission and distribution part of the value chain may be little different from that of a consumer without DER.
The prospect of adding DER for demand management benefits that reduce network costs, particularly transmission and distribution network augmentation, has diminished in Australia and many other jurisdictions, falling along with peak demand and energy usage. Even in the world of high growth this demand management benefit was liable to be locational and time dependent so this channel for DER value add is limited.30
Put another way, DER’s problem is that a substantial part of its value creation is more appropriately considered value duplication. It is in competition with the value proposition of grid electricity that is not only relatively low cost due to economies of scale, diversity, and sunk costs but comes as a bundle where the major cost of transmission and distribution for a grid connection, available for reliability, energy export, and backup is little different than for full grid energy supply. This is acceptable if customers choose based on an equitable balancing of costs and benefits among customers.
The original move to electrification involved a rebalancing. In the industrial revolution factories that were tied to wind but particularly water mills first escaped the constraint of place with onsite steam engines. Then Edison designed a system with centralized power generation and distributed use. Power moved offsite, became centralized, and as homes and business’ organized their assets around remote electricity generation people’s investment on their side of the meter became separated from the grid. But this was done with trial and error in a social construct for sharing of value, not templates for value chain restructuring and business model paradigm shifts. New technologies tend not to replace older ones, they reposition them. Prior to electricity, shafts and belts delivered first wind and water then steam power from a factory’s single power source to worker’s stations in an arrangement like that in Fig. 3.8. Initially electrification replaced the single factory power source and only over time did wires replaced shafts and individual motors appeared at workspaces.31 Rebalancing after innovation and disruption took time and required understanding, accommodating, and adapting rather than predicting and proscribing.
image
Figure 3.8 Factory line shaft power drive. (Source: http://www.singen-hegau-archiv.ch/singen-industrie.html.)
Now with DER we face another rebalancing. Generation is moving back onsite and transmission and distribution are changing from a monopoly on electricity supply into a monopoly for electricity exchange. Where electrification allowed expansion and economies of scale to cause tariffs to fall, now DER holds the prospect of deelectrification and with it the possibility of increasing tariffs undermining the viability of the utilities’ old business model.
The handsome returns utilities make, on an asset base that now looks outdated, are being questioned. However, while returns were made handsome to attract capital, as Graham and Buffet note, there is also limited upside for utilities compared to other investments. A utility would never reap the rewards of an Apple, an Amazon, or an Uber so it never had the risks placed on it of value loss.
New business models need to recognize that the old model bundled a range of highly valuable services and also managed the risks to consumers of underinvestment by rewarding conservative and reliable infrastructure choices. If the cost of this risk reduction is not covered by tariffs it will invariably appear somewhere else in the value chain.
Rearranging value capture in a world of increased DER will require revisiting the old largely volumetric supply tariffs levied at the meter, and providing more economically efficient prices to increasingly empowered and enabled consumers, as further explored by Steiniger and Johnston, among others, in this volume. This is not the same as assuming, as for example the REV seems to imply, that the monopoly elements no longer have a value or that their value can now be delivered efficiently at market prices by third parties through market mechanisms. Underpinning the monopoly elements of the grid is its bundle of services that still have a very high value as inputs to the needs of customers. A value so high that it can support different tariff and pricing models for grid elements, accommodate cross-subsidies, and still allow for the large investments customers make beyond the grid.

6. Conclusions

To make the business case for anything, someone must want something and must be willing to pay more for it than it costs, or else someone needs to find a way to charge less for something than people are already paying for it. You need to add value or reduce cost. This is the conundrum for DER.
Generation can be replaced by DER, as long as reliability and system stability can be maintained. But for effective value delivery from DER the transmission and distribution infrastructure is still required and their costs are effectively fixed over the short and medium term. In particular, adding DER cost behind the meter doesn’t necessarily let you take equivalent network cost away in front to the meter. In many cases, a large part of the value that DER creates is a duplication of the bundled value already provided by the grid. In such cases, DER may end up increasing costs and eroding the overall customer surplus that end users might enjoy. Like the move from shafts to wires with electrification, creating real value with DER will be a complex process, likely to involve extended trial and error and a deeper understanding of what customers’ value and where both value and costs can be shifted across the new and broader value chain.
As the digital economy increases, as the connected economy and the share economy increase, as EVs and autonomous vehicles increase, dependence on a reliable and resilient grid also increases. Wishing for similar new business models to materialize for electricity and assuming that the value chain for the grid can delink and reconfigure to suit, as a range of the proposed business models appear to assume, will not work.
Solving complex problems in the grid and setting prices to recover costs with DER innovation and disruption requires an understanding of what customers’ value and how value is created and bundled. The costs of the grid can only be replaced and the benefits augmented by understanding and addressing them and not by downplaying them and assuming them away. The first complex step to this is seeing a full view of the electricity utility value chain and this means being wary of any approach that is not firmly anchored in understanding the true top of the chain, utility as seen by the consumer.

References

Australian Bureau of Statistics, 2011. 6530.0 Household Expenditure Survey, Australia: Detailed Expenditure Items, 2009–10.

Australian Bureau of Statistics, 2016. 6401.0 Consumer Price Index, September Quarter 2016.

Bain & Company, 2015. World Economic Forum in collaboration with Bain & Company. The Future of Electricity-Attracting Investment to Build Tomorrow’s Electricity Sector.

Biggar, D., 2011. The fifty most important papers in the economics of regulation. Working Paper No. 3, ACCC/AER Working Paper Series.

Buffet, W., 2015. Berkshire Hathaway Inc. Shareholders letter. Available from: http://www.berkshirehathaway.com/letters/2015ltr.pdf

Cambridge Economic Policy Associates, 2016. Future regulatory options for electricity, Networks Energy Networks Association (ENA) and Commonwealth Scientific and Industrial Research Organisation (CSIRO).

Chaline E. History’s Worst Predications and the People Who Made Them. New York, NY: Chartwell Books; 2011.

Colander D, Kupers R. Complexity and the Art of Public Policy: Solving Society’s Problems From the Bottom Up. Princeton, NJ: Princeton Press; 2015.

Davies, M., 2015. Tariffs, What are the Issues (Load Factor, Diversity & Density). Available from: https://www.atse.org.au/Documents/Events/intelligent-grids/8-Electricity-Tariffs-Mervyn-Davies.pdf

Deloitte, 2016. The future of the global power sector, preparing for emerging opportunities and threats. Available from: https://www2.deloitte.com/global/en/pages/energy-and-resources/articles/future-of-global-power-sector.html

Devine Jr WD. From shafts to wires: historical perspective on electrification. J. Econ. His. 1983;43(2):347372.

Energy Efficient Strategies, 2008. Energy use in the Australian residential sector 1986–2020. Report for the Department of the Environment, Water, Heritage and the Arts.

Energy Networks Association, CSIRO, 2016. Electricity network transformation roadmap. Unlocking value: microgrids and stand alone systems roles and incentives for microgrids and stand alone power systems.

Fouquet R, Pearson PJG. Seven centuries of energy services: the price and use of light in the United Kingdom (1300–2000). Energy J. 2006;27:139177.

Kay J. Obliquity: Why Our Goals Are Best Achieved Indirectly. London: Profile Books; 2010.

LeVine S. The Powerhouse: America, China, and the Great Battery War. New York: Penguin Books; 2016.

New York Public Service Commission, 2015. White Paper on Ratemaking and Utility Business Models.

Productivity Commission, 2013. Electricity Network Regulatory Frameworks, Report No. 62, Canberra.

Productivity Commission, 2016. Digital disruption: what do governments need to do? Canberra.

PwC Global Power & Utilities, 2014. The road ahead. Gaining momentum from energy transformation. Available from: https://www.pwc.com/gx/en/utilities/publications/assets/pwc-the-road-ahead.pdf

Rocky Mountain Institute, 2013. E-Lab, New Business Models for the Distribution Edge: Transition From Value Chain to Value Constellation.

Rocky Mountain Institute, 2014. The Economics of Grid Defection: When and Where Distributed Solar Generation Plus Storage Competes With Traditional Utility Service.

Shiman DR. Explaining the collapse of the British electrical supply industry in the 1880s: gas versus electric lighting prices. Econ. Bus. Hist. 1993;23(1):fall 1993.

Smith R, MacGill I. Revolution, evolution or back to the future? Lessons from the electricity supply industry’s formative days. In: Sioshansi FP, ed. Distribute Generation and Its Implication for the Utility Industry. Oxford: Academic Press; 2014: (Chapter 24).

Yakubovich V, Granovetter M, McGuire P. Electric charges: the social construction of rate systems. Theory Soc. 2005;34:579612.

Further reading

Allis-Chalmers, 1955. The Ghost Town that Came to Life. Available from: http://www.misterkitty.org/extras/stupidcovers/stupidcomics490.html

Australian Bureau of Statistics, 2015. 5204.0 Australian System of National Accounts.

Australian Energy Market Operator (AEMO), 2014, Value of Customer Reliability—Final Report. Available from: http://www.aemo.com.au/-/media/Files/PDF/VCR-final-report--PDF-update-27-Nov-14.pdf

Australian Energy Regulator (AER), 2015. State of the Energy Market 2015. Available from: https://www.aer.gov.au/publications/state-of-the-energy-market-reports/state-of-the-energy-market-2015

Australian PV Institute, 2016. National Survey Report of PV Power Applications in Australia 2015. Available from: http://apvi.org.au/pv-in-australia-2015/

Brox J. Brilliant: The Evolution of Artificial Light. Boston, MA: Houghton Mifflin Harcourt; 2010.

Consolidated Edison, 2016. Distributed System Implementation Plan (DSIP self-assessment and five-year view of the integration of Distributed Energy Resources into Planning, Operations, and Administration). Consolidated Edison, New York, NY.

Energy Efficient Strategies for the Commonwealth of Australia, 2011. Third Survey of Residential Standby Power Consumption of Australian Homes—2010.

Granovetter, M., McGuire, P., 1998. The making of an industry: electricity in the United States. In: Callon, M. (Ed.), Sociological Review Monograph Series: The Laws of the Markets, vol. 46, issue S1. Wiley-Blackwell, Oxford, pp. 147–173.

Hawken P, Lovins AB, Lovins H. Natural Capitalism: Creating the Next Industrial Revolution. Boston, MA; London: Back Bay Books; Routledge; 2000.

Jonnes J. Empires of Light: Edison, Tesla, Westinghouse, and the Race to Electrify the World. New York, NY: Random House; 2003.

Ledovskikh, A., 2016. Electricity Retailing in Australia, IBISWorld Industry Report D2640 and other reports. Available from: http://www.ibisworld.com.au/

Marshall, A., 1895. Principles of Economics. Available from: https://archive.org/stream/principlesofecon01marsrich/principlesofecon01marsrich_djvu.txt

McDonald F. Insull: The Rise and Fall of a Billionaire Utility Tycoon. Chicago, IL: University of Chicago Press; 1962.

New York Mayor’s Office of Long-term Planning and Sustainability, 2013. A Stronger, More Resilient New York.

New York Public Service Commission, 2014a. Reforming The Energy Vision Staff, Report and Proposal.

New York Public Service Commission, 2014b. Symposium Technical Conference—An Energy Agenda for the Future.

New York Public Service Commission, 2014c. Order Establishing Brooklyn/Queens Demand Management Program.

Nordhaus, W., 1998. Do real-output and real-wage measures capture reality? The history of lighting suggests not. Crowles Foundation Paper No. 975, Yale University.

Porter ME. The Competitive Advantage: Creating and Sustaining Superior Performance. New York, NY: Free Press; 1985.

Schlesinger H. The Battery: How Portable Power Sparked a Technological Revolution. Washington, DC: Smithsonian Books; 2010.

Waide P, Tanishima S. Light’s Labour’s Lost, Policies for Energy-Efficient Lighting, In Support of the G8 Plan of Action. Paris: International Energy Agency; 2006.

Wasik JF. The Merchant of Power: Sam Insull, Thomas Edison, and the Creation of the Modern Metropolis. New York, NY: Palgrave Macmillan; 2006.


1 The value chain often describes the journey of a product through a chain of activities that each add value; Porter’s corporate strategy approach with the firm as the unit of analysis. In this chapter we use the term as an industry value chain or supply chain, like an input output model, and a societal approach based on utility to end users.

2 See Fouquet and Pearson (2006) on light value, Shiman (1993) on early competition between electricity and gas while diversity still exists across Australian, with gas having a large role in Victoria and wood significant in Tasmania.

3 See Yakubovich et al. (2005) Sydney (a late starter on electrification) had a major coal-fired power station (now the Powerhouse Museum) operating within 1.5 km of the town hall till 1959.

4 See Smith and MacGill (2014) and also Yakubovich for discussion of the mid-1890s debate on the Wright and Barstow pricing systems.

5 Terms like “shareconomy,” while in vogue, are problematic as they are applied across a range of activities involving new commercial arrangements between consumers, rather than sharing as it is traditionally understood.

6 Calculations are from Davies (2015) using data from the Smart Grid Smart City project.

7 Graham, p. 356.

8 Buffet (2015).

9 See Rocky Mountain Institute (2013,  2014) as an example.

10 See PwC (including their caveats), Deloitte (2016), ENA and CSIRO (2016), and Bain & Company (2015).

11 PwC acknowledges the overwhelming uncertainty and similar approaches with similar issues that appear elsewhere.

12 Cambridge Economic Policy Associates (2016) and Biggar (2011) for an excellent summary of the history of regulation which highlights the considerable issues that have always been present with the traditional cost to serve model, even with deregulation and RPI-X incentives.

13 NYPSC Chairman Richard Kauffman’s speeches share Buffet’s fundamental dislike of the inefficiencies of the old business model, and favors a platform approach based on perceptions of what is possible from high tech sectors.

14 New York Public Service Commission (2015).

15 Ibid, also check web for the hype on the “platform economy.”

16 NYPSC, Case 15-M-0252.

17 See Colander and Kupers (2015); Kay (2010).

18 LeVine (2016) traces the path of recent battery progress.

19 Productivity Commission (2016).

20 Chaline (2011).

21 See discussion in Biggar & Dimasi, Orton et al.

22 This is the cornerstone of Benjamin Graham’s approach to value investing.

23 Productivity Commission (2011).

24 Missing from this traditional NEM view is around $10 billion for Western Australian assets not in the NEM and new renewable generation assets.

25 The concept of consumer surplus originates with Alfred Marshall’s “Principles.” Michael Porter’s popularization of the value chain approach to corporate strategy focused on value capture of companies with value assumed at market prices.

26 Energy Efficient Strategies (2008).

27 ABS Retail sales.

28 IBISWorld revenues are for all chain components so cannot be seen as the value add of a particular activity.

29 See Productivity Commission (2013) for international comparisons.

30 The NY REV make much of the Brooklyn Queens Demand Management (BQDM) Project, but it predates the REV framework and the latest 2016 Distributed System Implementation Plan (DSIP) filings show limited scope for DM compared to total grid costs.

31 Devine (1983).

..................Content has been hidden....................

You can't read the all page of ebook, please click here login for view all page.
Reset
3.16.218.105