
Chapter 7
Regulations, Barriers, and Opportunities to the Growth of DERs in the Spanish Power Sector
Eloy Álvarez Pelegry Orkestra, Bilbao, Spain
Abstract
Generous regulatory support for renewables in Spain, within the framework of renewable energy plans had serious financial repercussions. This led to a reversal of the legislation with consequences for the deployment of DERs. A dramatic fall in photovoltaic costs and a reduction in prices for electricity storage offer opportunities for photovoltaic self-consumption, in which technology, economics, and regulation all play key roles. In addition, innovation and business models may lead to a disruptive change in the grid. Large-scale penetration of electric vehicles is expected, due to improvements in batteries and a reduction in costs, backed by policy support.
Keywords
regulation in Spanish power sector
renewable energy policy
distributed energy resources
energy storage and batteries
electric vehicles
1. Introduction
Regulation and economics are key issues for technology development, and an appropriate combination of the two drives innovation. The recent history of Spain clearly shows how a combination of these factors has led to a major increase in the installed capacity of renewables,1 while also engendering certain economic difficulties. The promotion of small and distributed photovoltaic (PV)-based generation, backed by favorable costs and concepts, such as consumer empowerment, is currently under debate, with particular emphasis on specific rules and economics.
These developments have all taken place within the context of a set of EU energy policies setting clear targets for the penetration of renewables in final energy consumption and a dramatic change in the economics of PV power, key elements in the development of distributed energy resources (DERs).
Section 2 of this chapter summarizes Spanish legislation on renewables since the 1980s; Section 3 discusses renewable energy plans. Section 4 describes the results of these measures and policies in terms of new installed capacity, renewable electricity production, and renewables in final use, as well as the economic implications of aggregated costs for the electricity system. Self-consumption has become a key issue in the development of DERs and their possible consequences for grids. Section 5 discusses the regulatory aspects of this technological arrangement.
Changes to the regulations now enable households to cover part of their electricity consumption at a reasonable price with small PV facilities, though their viability depends on location, capacity, and whether or not they are connected to the grid. Section 5 also provides an economic analysis, describing and analyzing different cases. A key issue is also considered in this section: the economics of PVs at a “utility scale.”
Another key topic that may have a disruptive implication on electricity grids is the growth in electric vehicles (EVs). This issue is dealt with in Section 6. In view of the importance of batteries to the penetration and development of EVs, one part of this section analyzes the implications of developments in this area. The potential development of EVs is also analyzed, examining the investment needs followed by the chapter’s conclusions.
2. Regulation/legislation on renewables in Spain
From the outset, the development of renewable energy in Spain has proceeded on a trial-and-error basis, given that it was operating in largely uncharted waters. By the mid-1990s, when targets were far from being reached, ill-advised regulatory design had created a complex situation. The result was a number of very significant changes in the electricity system, which in turn affected numerous activities, including generation—where new taxes were introduced—and power transmission and distribution—for which remuneration was reduced.2
Regulatory promotion of renewables can be traced back to 1980 and the enactment of the Law on Energy Conservation (Ley 82/1980).3 Under this legislation, power utilities were required to buy energy from small producers with domestic installations for which they paid a regulated domestic electricity tariff.
Royal Decree (RD) 2366/1994 set prices for wind, solar, and minihydro facilities with under 100 MVA capacity4 and also established priority access to the grid for the electricity produced by this type of facility.
Subsequently, Law 54/1997 liberalized electricity generation in Spain and created the Regimen Especial (a special regime or framework to include power from renewables and cogeneration). The law also set a target of a 12% share of renewables in electricity by 2010.
The special regime was further developed by RD 2818/1998, which established payment rates for the various different forms of renewable technology. A PV plant with capacity of under 5 kW, for instance, was entitled to remuneration of €396 per MWh; a wind plant to €66 per MWh. The producer could choose between this regulated price and a prima (premium on pool price); this took the form of an incentive added to the pool price, which came to €360 per MWh for PV and €32 per MWh for wind energy.
In 2004, RD 436/2004—which remained in force until 2007—incorporated economic incentives for solar thermoelectric plants. These were linked to an average reference tariff (Tarifa Media de Referencia or TMR). For example, PV plants of less than 100 kW enjoyed an incentive of 575% for the first 25 years and 460% thereafter.5 Rates were also set for wind and solar thermoelectric, which were valid up to a given installed capacity: 150 MW for PVs, 200 MW for solar thermal, and 13,000 MW for wind.
RD 661/2007 was enacted 3 years later in 2007. On this occasion, the regulation included both a floor and a cap rate for solar, thermoelectric, and wind, as well as a review mechanism based on the consumer price index. For wind power, the cap and floor were €85 and €71.2 per MWh, respectively, for the first 20 years, whereas for solar thermoelectric the rates were €344 and €254.
As discussed in the next section, there followed a dramatic increase in the number of PV and wind facilities. RD 1578/2008, enacted in 2008, established new incentives for PV facilities, with different rates for rooftop- and ground-based plants. It also set limits on total capacity to limit the total value of incentives. In 2009, RD 6/2009 implemented a procedure to better determine plans for new facilities to monitor the development of renewables. In 2010, RD 1614/2010 limited the operating hours of solar thermoelectric and wind plants in an attempt to restrict the amount paid out in incentives for renewables (see Section 4).
Two key years for the development of renewables were 2012 and 2013. As discussed in Section 4, the sheer quantity of economic incentives threatened to undermine the financial viability of the power system, given that despite a continuous increase in electricity prices for domestic and industrial consumers, the increase in tariffs fully failed to offset the total increase in costs.
In 2012, Royal Decree Law (RDL) 1/2012 suspended economic incentives for new renewable plants, offering them the pool market price instead. Later the same year, RD 13/2012, among other measures, reduced remuneration for distribution and transmission, as well as capacity payments and interrumpibilidad (the service whereby supply can be cut to certain high-consuming clients). In addition, Law 15/2012 established a tax of 7% on power generation and created new taxes on nuclear and hydro generation.
In 2013, RDL 2/2013 abolished economic incentives for special regime facilities and under RDL 9/2013, enacting urgent measures for the financial stability of the electrical system, the government created a new remuneration system for those renewables, based on the concept of reasonable return on investment. The system is based on the “standardization” of the different technologies, so standard capital expenditure for investments is fixed, taking into account a reasonable return on pretax investment (yield on Spanish 10-year government bonds plus 300 basis points). This new method of payment also takes the economic life span of the projects into consideration. It is subject to review every 6 years, with an interim review every 3 years.
Law 24/2013 on the Electricity Sector, enacted on December 26, 2013, introduced a large number of major changes and was seen as a reform of the legislation, given that aside from the many changes introduced in RDs, no specific law on the electricity sector had been enacted since 1997.
In terms of developments in renewables, the new law was complemented by Order IET/1045/2014, approving the parameters for remuneration of the different standard investments, having established the life span for economic remuneration (between 20 and 30 years, depending on the technology), standard operation, and maintenance costs, as well as “standard” operating hours.
Other important pieces of legislation include RD 1699/2011 and RD 900/2015, both related to self-consumption; and RD 647/2011 on EVs.
As can be seen, regulatory developments in Spain have lacked permanence, with numerous new pieces of legislation created in response to different regulatory challenges, especially since 2007.
| Basic legislation/regulation and energy plans related to renewables | ||
| Year | Basic legislation on renewables | Plans for renewables |
| 1980 | Law 82/1980 Energy Conservation | — |
| 1986 | — | Renewables Plan 1986–1988 |
| 1990 | — | National Energy Plan 1991–2000 (PEN 1991–2000) |
| 1994 | RD 2366/1994 | — |
| 1997 | Law 54/1997 | — |
| 1998 | RD 2818/1998 | — |
| 1999 | — | Plan for Renewable Energy Promotion 2000–2010 (PFER 2000–2010) |
| 2000 | RD 1955/2000 | — |
| 2004 | RD 436/2004 | — |
| 2005 | — | Renewable Energy Plan 2005–2010 (PER 2005–2010) |
| 2007 | RD 661/2007 | — |
| 2008 | RD 1578/2008 | — |
| 2009 | RD Law 6/2009 | — |
| 2010 | RD 1614/2010 | National Action Plan for Renewables 2010–2020 (PANER 2010–2020) |
| RD 1565/2010 | ||
| RDL 14/2010 | ||
| 2011 | RD 1699/2011 | Renewables Energy Plan 2011–2020 (PER 2011–2020) |
| RD 647/2011 | ||
| 2012 | RDL 1/2012 | — |
| RDL 13/2012 | — | |
| Law 15/2012 | — | |
| 2013 | RDL 2/2013 | — |
| RDL 9/2013 | — | |
| Law 24/2013 | — | |
| 2014 | RD 413/2014 | — |
| “Order” IET 1045/2014 | — | |
| 2015 | RDL 9/2015 | — |
| RD 900/2015 | — | |

3. Spanish renewable energy plans
The development of renewable energy sources in Spain has been governed by a series of national energy plans, backed by the legislation described in Section 2. We shall now examine the planned developments and results, further described in Section 4.
The first energy plan to focus on renewables was the Renewable Energy Plan 1986–1988, which sought to promote the development of this type of energy, although no specific targets were set. The Plan Energético Nacional (PEN) 1991–2000 (National Energy Plan), established a target of 3.2% of renewables in primary energy by 2000.
In 1999, a number of specific targets were set in the Renewable Energy Promotion Plan (Plan de Fomento de Uso de Energías Renovables or PFER) 2000–2010: 9000 MW for wind, 135 MW for PV, and 200 MW for solar thermoelectric.6
Six years later, the government brought out a new renewable energy plan (the PER 2005–2010), which targeted 12% of renewables in primary energy, 29.4% of electricity from renewables, and 5.75% of biofuels in transport by 2010. Specifically, 20,150 MW was to be generated from wind power facilities, 500 MW from solar thermal, and 400 MW from PV.
Five years later, a new National Renewable Energy Action Plan (Plan de Acción Nacional de Energías Renovables or PANER, 2010–2020) was implemented. The plan incorporated the targets for renewable energy contained in European Directive 2009/28/EC, that is, 20% of renewable energy sources in final use. This was followed by a new Renewable Energy Plan (PER 2011–2020) approved in 2011, which set a target of 20.8% of renewables in final energy by 2020, 39% in electricity generation, and 11% in transport.
Thus since 1986, and more clearly since 1991 (Fig. 7.1), energy policy has been established through a series of plans with specific targets for renewables. These have increased from a 4.5% penetration level in 1990 to a 10% target for 2000, later revised to 12% in primary energy by 2010. For 2010, the target was increased to nearly 30% of renewables in electricity and around 6% in biofuels. The current target is for 21% of renewables in final energy by 2020, with 39% in electricity generation and 11% in transport.
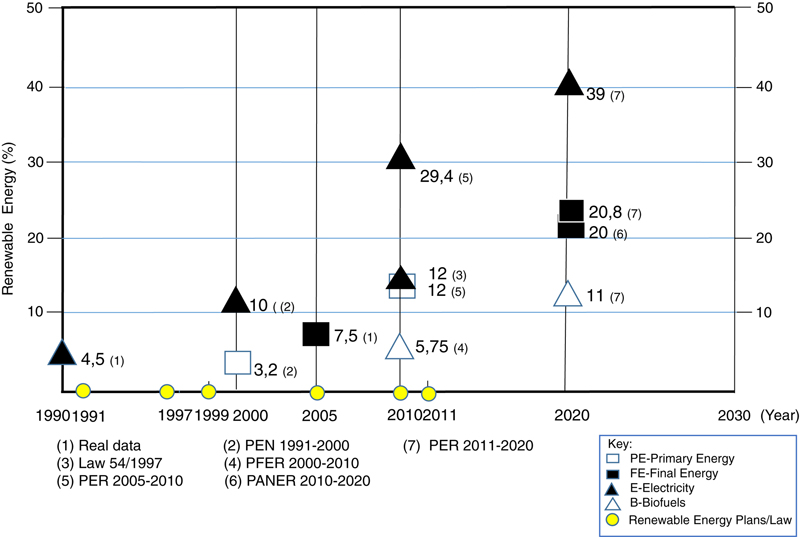
Figure 7.1 Targets for renewables in energy plans.
Note 1: The Renewable Energy Plan 1986–1988, which promoted renewables without setting quantifiable targets, is not included here. (Source: Original based on various laws and energy directives.)
Note 1: The Renewable Energy Plan 1986–1988, which promoted renewables without setting quantifiable targets, is not included here. (Source: Original based on various laws and energy directives.)
As discussed in the next section, the 2010 targets for installed wind, solar thermal, and PV capacity were clearly surpassed. Nevertheless, a combination of greater-than-planned installed capacity, generous feed-in tariffs initially offered to technologies at an early stage of development, and a drop in demand since 2008 created a very serious economic and financial threat to the stability of the electricity system. Even the European Commission’s services warned the Spanish government that the situation in the electricity system was neither economically sound nor sustainable.
4. Development of renewables and costs
Fig. 7.2 provides a more in-depth overview of trends in renewables in Spain, showing the capacity installed each year since 1990.
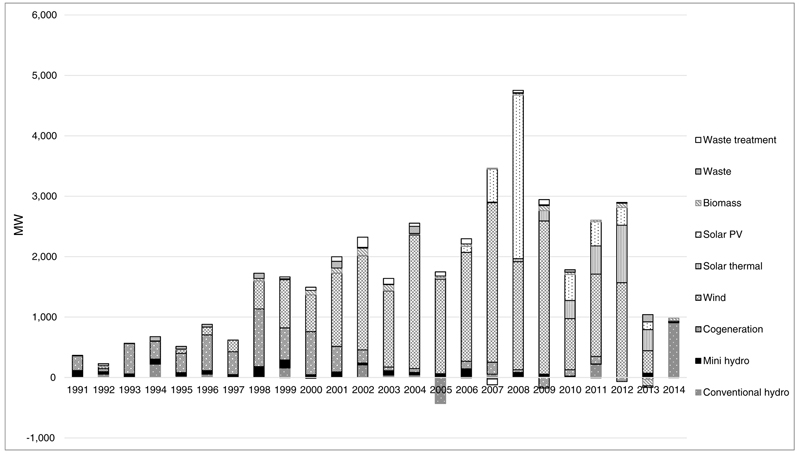
Figure 7.2 New renewable power and cogeneration by year (MW). (Source: Corrales et al. (2016) from REE, CNMC, and Eurostat.)
Fig. 7.3 shows total accumulated installed capacity since 2000.
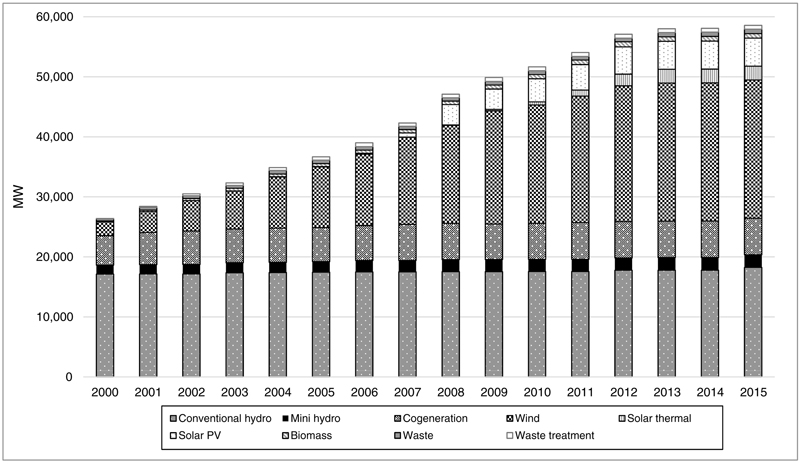
Figure 7.3 Development of accumulated renewable power and cogeneration by year (MW). (Source: Corrales et al. (2016) from REE, CNMC, and Eurostat.)
The legislation described above, particularly RDs 2818/1998, 436/2004, and 661/2007 have had a clear influence on the development of renewable energy, with a logical delay between enactment of the legislation and construction and commissioning of facilities. This is particularly clear in the case of PV, as can be seen in Fig. 7.4.
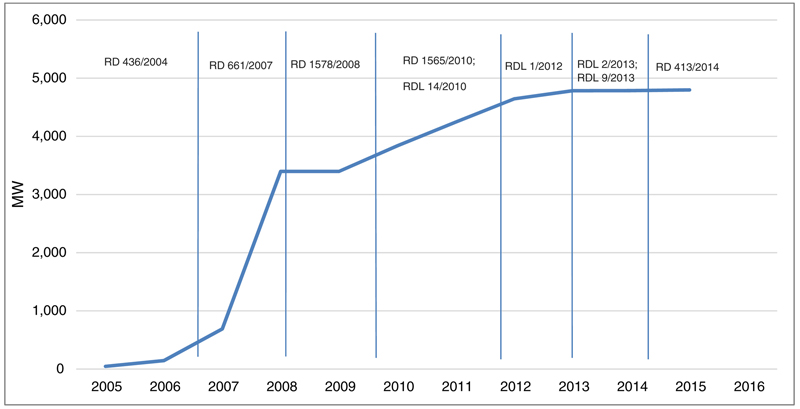
Figure 7.4 Development of photovoltaic (PV) power in Spain (2005–2014). (Source: Corrales et al. (2016) from CNMC, REE, and Mir (2011).)
One of the main reasons for the dramatic fall in electricity demand was the economic crisis of 2008, which lasted beyond 2012,7 longer than initially expected. In 2014, primary energy demand stood at 118 Mtoe and final energy at 83 Mtoe. Both figures were below the level for 2000. The situation was similar for electricity, with demand of 258 TWh in 2014, comparable to the figure for 2005.8
As discussed above, a strong, rapid development in renewable technologies in the Spanish electricity mix had serious consequences, including an increase in regulated costs, to the point of becoming almost uncontrollable.
Regulated costs are calculated as the sum of feed-in tariffs for renewables (RES) and cogeneration, electricity transmission, and distribution costs, the annuity of the tariff deficit and extrapeninsular compensation for the higher cost of supplying power on the Spanish islands, the Balearics, and the Canaries. These costs have increased dramatically since 2006–2007, as can be seen in Fig. 7.5, showing different types of regulated costs, and Fig. 7.6, showing the specific remuneration of the various renewables and other energy sources incentivized under the “special regime.”
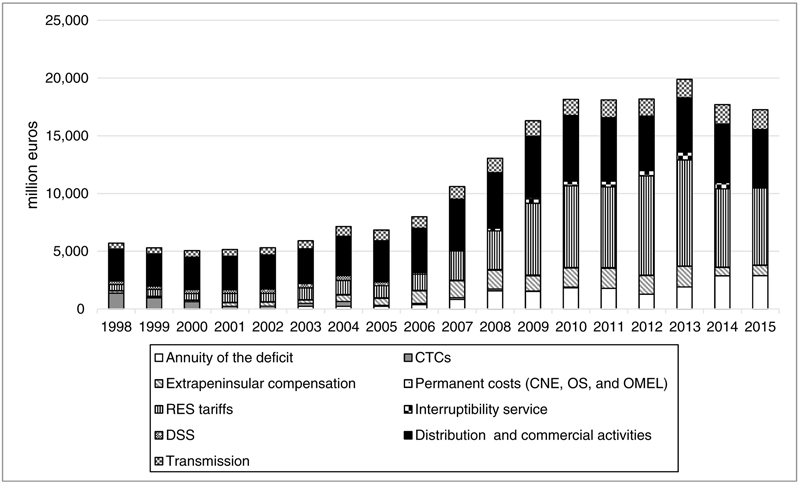
Figure 7.5 Regulated costs of the Spanish electricity system.
This graph does not include payments for capacity. Sum of feed-in tariffs for renewables (RES) tariffs include RES and cogenerations feed-in tariffs. DSS mainly includes costs of diversification and security of supply. Permanent costs include market and system operator costs and the National Energy Commission Costs (CNE, today CNMC). CTC, Costes de transición a la competencia. (Source: Corrales et al. (2016) from CNMC and CNE.)
This graph does not include payments for capacity. Sum of feed-in tariffs for renewables (RES) tariffs include RES and cogenerations feed-in tariffs. DSS mainly includes costs of diversification and security of supply. Permanent costs include market and system operator costs and the National Energy Commission Costs (CNE, today CNMC). CTC, Costes de transición a la competencia. (Source: Corrales et al. (2016) from CNMC and CNE.)
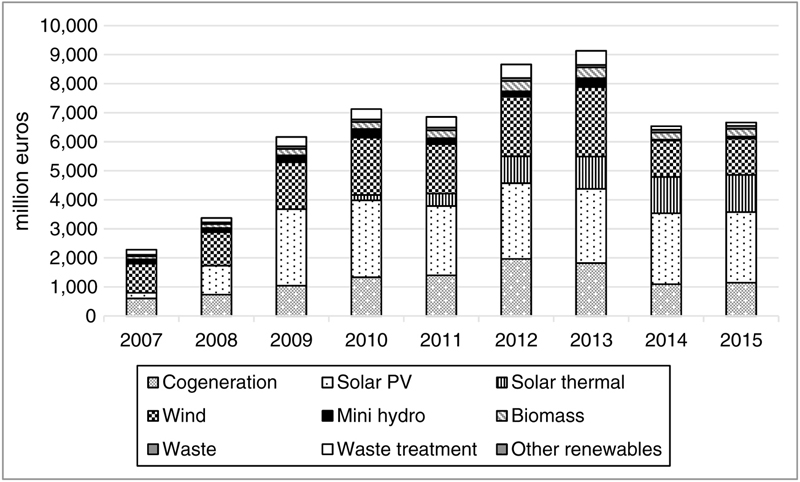
Figure 7.6 Development of payments for renewable power production, including cogeneration.
Figures for hydro refer to minihydro. (Source: Corrales et al. (2016) from Foro de la Industria Nuclear (2016) and CNMC.)
Figures for hydro refer to minihydro. (Source: Corrales et al. (2016) from Foro de la Industria Nuclear (2016) and CNMC.)
In 2007, special regime feed-in tariffs came to around €2.1 billion. Six years later, in 2013 they had soared to €9 billion. As a result, regulated costs, which in 2007 totaled around €5 billion, rose to €20 billion by 2013 (Álvarez Pelegry, 2015).
Despite the changing context, the amount of electricity produced from renewables has risen steadily, as Fig. 7.7 shows. In 2015, renewables9—mainly large hydro, wind, and solar—accounted for 46.4% of electricity demand, with 66.8% carbon-free, including nuclear.10
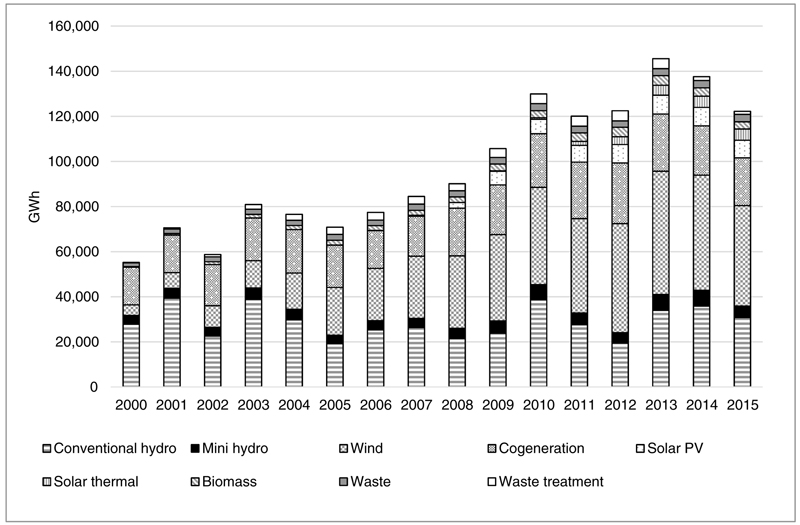
Figure 7.7 Renewable energy produced in the Spanish electricity system (GWh). (Source: Corrales et al. (2016) from REE, CNMC, and Eurostat.)
Although this description has focused mainly on renewable technologies in power production, renewable energies can also be found in final energy use, especially solar thermal, biomass, geothermal, and in transport.
Based on this review, one conclusion seems clear: the huge cost of developing renewables led to a real problem with the total cost of the system. To some extent, this has resulted in a sense of caution and a restrictive environment vis-à-vis new developments, which, if improperly managed, might lead to a recurrence of the same problems.
Electricity prices for domestic consumers increased dramatically. The cost per MWh for a domestic consumer using 2500–5000 kWh per year rose from €140 in 2007 to €218 per MWh in 2016 (Eurostat, 2016).
Higher prices are mainly a result of environmental, social, and industrial policies, with a very high percentage, in some years not far from 50%, of the final price related to costs and taxes in these areas. This situation needs to be corrected with intelligent regulation to avoid distortions for the effective development of prosumers. Increased costs for domestic consumers in turn promote measures of energy saving and efficiency and make PV prosumption more attractive in conjunction with a drop in the price of such installations.
5. DER: household prosumers and PV utility scale
This section discusses domestic self-consumption, another topic that has sparked debate, and some misunderstanding. To a great extent, this is an issue that depends on regulation, technological improvements, and economics. Our analysis focuses on small household PV installations, with a reference at the end of the section to self-consumption in small industrial factories and at a “utility scale.”
Aside from the Spanish regulation itself, it is important to note that the European Commission actively promotes “prosumption” (i.e., self-consumers, including residential prosumers, community/cooperative energy, and commercial and public prosumers) (Sajn, 2016).
RD 1699/2011 transposes European Directive 2009/28/EC and regulates grid connection by small facilities. However, it is Law 24/2013, governing the electricity sector, which makes a clear distinction between producers and consumers. The law includes the concept of self-consumption, which is defined in Article 9 as “the consumption of electricity from generating facilities connected within a consumer’s network or through a direct power line associated with a consumer.”11
RD 900/2015 regulates the administrative, technical, and economic conditions for self-consumption and production with self-consumption. The decree provides for two types of self-consumption, both defined in Law 24/2013. These are: Type 1, facilities of under 100 kW (Article 9.1 a); and Type 2 (Article 9.1 b and 9.1 c of the law). In Type 1 facilities, there is only one “legal” subject, namely the consumer; in Type 2 there are two: the producer and the consumer.
One controversial issue of the current regulation on self-consumption (RD 900/2015) is the payment of charges for the electricity produced from facilities in the 10–100 kW range. Installations with a capacity of under 10 kW are exempt from this charge.12
Under the RD, facilities of under 100 kW connected to a sub-1kV grid are exempt from the requirement to obtain prior administrative authorization and administrative authorization for construction (Additional Provision No. 5). Distribution companies are required to report to the National Markets and Competition Commission (CNMC) on the number of contracts for grid access and the volume of contracted power.
To conclude this section, it should be noted that there is no clear figure for installed capacity in small self-sufficiency facilities (households and small industrial facilities), with different sources estimating the figure at between 16 and 50 MW (Barrero, 2016).
5.1. Economic Assessment of a Domestic PV Installation
It is important to assess the economic feasibility of self-consumption. This requires calculating the investment and generating costs of own facilities and estimating some financial parameters to assess the attractiveness of the investment.
It may also be of interest to compare the production cost of the electricity generated by the facilities themselves and consumed by the owner of the facility with the price paid to the electricity supplier.
Larrea et al. (2016) made an analysis for two types of consumers (3000 and 5000 kWh per year) in two locations (north and south of Spain). In each case, they analyzed two scenarios: a consumer–producer with solar PV panels off-grid and grid connected. The off-grid facility requires electrical storage and, for economic reasons, a power generator set.
Depending on consumption demands (3000 or 5000 kWh per year) and location (north and south), the hypothetical consumers would have to invest between €17,000 and €34,000 to operate off-grid. The calculations showed that the Levelized Cost of Electricity (LCOE) ranged from €582 to €862 per MWh, rising to €1548 per MWh where the facilities incorporate batteries but not a diesel generator. These investments make little economic sense, given that the simple payback period would be more than 26 years, and there would be no positive Internal Rate of Return (IRR). If this consumer was connected to the grid, the cost for the consumer (price) would be around €215 per MWh.
For a grid-connected consumer with PV facilities, they examined two possible basic scenarios: 100% self-sufficiency and 30% self-sufficiency with no electrical storage.13
Fig. 7.8, intended for illustration purposes, shows a daily curve of PV production and domestic demand for 2 months of the year. The case displayed here is for 100% self-sufficiency, 3000 kWh per year demand, located in the north of Spain. As can be seen, the rate of self-consumption ranges from 35% to 58%.
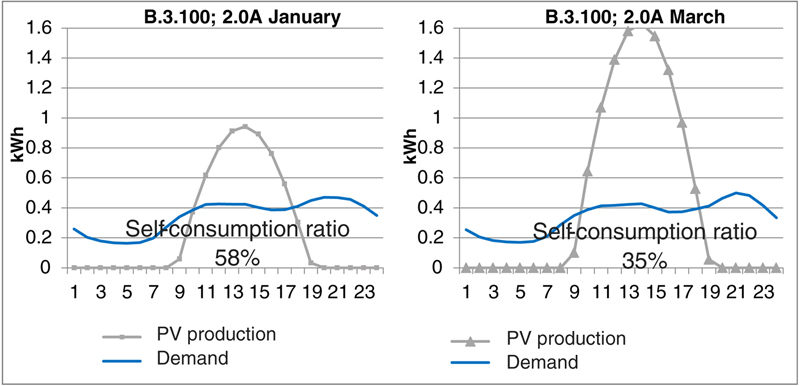
Figure 7.8 Average daily production and consumption (kWh) of a domestic consumer.
Grid-connected 2.88-kWp PV plant, with a self-sufficiency ratio of 100%. (Source: Larrea et al. (2016) from REE.)
Grid-connected 2.88-kWp PV plant, with a self-sufficiency ratio of 100%. (Source: Larrea et al. (2016) from REE.)
In economic terms, assuming a Weighted Average Cost of Capital (WACC), of 5.6%, the LCOE ranges from €101 to €141 per MWh and the investment required from around €1000–8000. The simple payback periods range from 10 years in the south to 15 years in the north for a demand of 3000 kWh per year and a self-sufficiency rate of 30%.14
In this case, however, the LCOE is not the best criterion for comparing electricity costs. Instead, a concept should be employed that is related to the cost of the electricity produced and consumed.15 As the household cannot benefit from the total production, but only from the kWh it can consume instantly—if it has no storage system—for a ratio of 30% self-sufficiency, the costs of electricity produced and consumed are practically the same. For 100% self-sufficiency, there is a difference in cost between the electricity produced and the electricity utilized and consumed, where the cost is less beneficial for the consumer.
If the electricity taken up to the grid is remunerated, at 30% self-sufficiency the LCOE is similar to a case in which electricity is not remunerated. However, when the self-sufficiency ratio is 100%, the LCOE decreases by between 19% and 27%, depending on the site (irradiance), yet the return on investment for the household is still very low or even “negative,” with a very long payback period.16
What conclusions can be drawn from these comparisons?
In the case of off-grid facilities, the grid and electricity system, if available, are a very attractive alternative for the consumer. Amongst grid-connected consumers, self-sufficiency may be attractive in terms of profitability and simple payback period, although potential barriers include the need for consumers to have the financial capability to invest and enough space on their roofs to house the facilities (from 6 to 46 m2, depending on installed power and location). In this case, the grid is of key importance, and necessary for receiving supply and taking up surplus electricity production, as illustrated in Fig. 7.8; a value therefore has to be assigned to the grid.
In this respect, a mechanism needs to be implemented to ensure that self-sufficient consumers contribute to the overall cost of the system. This mechanism should be designed on a technical basis and with political consensus. If this is done correctly, it is then very likely that self-sufficiency will cease to be a political issue, and its development will be mainly determined by a combination of economics, technology, and marketing.
Likewise to develop prosumption, it is also important to consider the process of administrative authorization, construction of the installation, and the space required. In these issues, specialized companies, financing instruments, and new business models might be of help.
In their chapter, Mountain & Harris analyze the economics of electricity supplied by the grid relative to the combination of grid and rooftop PV. They compare market offers and calculate capital cost for various PV sizes in Victoria, Australia, considering capital subsidies and a price for the excess production exported to the grid. These hypotheses and others—such as 2% real cost of capital—are different to the cases analyzed in this chapter. Among their conclusions, they find that payback17 periods are long with a median of 12 years in Victoria.
From a regulatory perspective and looking at the tariff structure, Haro et al. provide a detailed analysis of the structure of electricity tariffs for domestic consumers. They highlight the importance of the regulated component of the electricity price, which also includes “policy charges”. After examining the current make-up of the domestic tariff (PVPC), and taking into account that by 2019 smart meters will have been fully rolled out (thus providing for hourly measures) they advocate an “efficient tariff” to replace the current system of payment of “policy charges.” They propose specific methodology to compute hourly network tariffs to incentivize efficient self-generation, storage, and EV deployment.
5.2. Utility-Scale PVs
As mentioned at the beginning of this section, any discussion of this issue should also include the economic advantages of PVs in utility-scale facilities. Álvarez Pelegry and López Cardenete, (2016) report that the advantage of utility-scale solar power plants over rooftop installations has been demonstrated in a study by the Brattle Group, which concluded that a 300-MW solar PV plant has approximately half the cost per kWh of the same capacity divided among 5-kW home installations (in Xcel Energy Colorado System) and performed consistently better in cost terms in all the scenarios considered in the study (Tsuchida et al., 2015).
Low prices of utility-scale PV projects can also be seen in other regions, such as Latin America. In Argentina under the RenovAr program, 20-year Power Purchase Agreement (PPA) was awarded in 2016 to four PV projects of 100 MW each (La Puna and Cauchari 1, 2, and 3) with prices of $59/60 per MWh18 (Morrone, 2016).
Low prices are also being obtained in tenders in Chile—where prices fell from $128.90 per MWh in 2013 to $47.60 per MWh in 2016—and in recent tenders in Mexico, where average prices ranged from $44 to $32 per MWh (Relancio, 2016). The figures are corroborated by IEA PVPS (2016), which reports prices ranging from $29.10 per MWh in Latin America and the Caribbean to $67 per MWh in India.
Sadamori (2016) also reports long-term contract prices for new renewable power to be commissioned over 2016–2019 that range from $30 per MWh in Chile and the United Arab Emirates to $65–70 per MWh in the United States, $55–94 per MWh in India, and $87 per MWh in Germany.
The current reduction in costs is mainly due to a drop in the cost of PV modules from a total of around $2.7 per W in 2010 to $0.7–0.8 per W in 2016. The cost of the module represents 40% of the total in 2016, as compared to 70% in 2010, (Relancio, 2016). This trend can be explained not only with single figures, but with price ranges, hence the change for small-scale systems that went from $5.8–6.5 per W in 2006 to $1.8–3 per W in 2015 (IEA PVPS, 2016).
According to Sola González (2016), the drivers of low prices are: (1) large-scale projects, (2) low labor costs, (3) high irradiation, (4) access to low cost financing, (5) stable economy, and (6) long-term PPAs. Elecnor (2016) states that some prices and some projects are not sustainable or are not under construction. However, it recognizes that if the increase in PV volume continues, the “real” costs without dumping or subsidies may fall even further.
Given these developments in PV, it is not surprising that Masson (2016), predicts that global utility-scale capacity will increase from 54 GW in 2016 to 59 GW in 2020, and rooftop from 18 to 31 GW. Overall, therefore, the relative percentage penetration of rooftop PV will increase compared to utility scale, but in terms of actual capacity, utility scale will still be twice that of rooftop in 2020.
Based on this review, it is clear that distributed PV generation will play a more prominent role in the electricity system of the future, both in residential or commercial “prosumption” and at the utility-scale level, as described by Webb et al. Electricity storage will certainly represent a greater breakthrough and will probably have major impacts at the utility scale and at the residential level. Adequate and competitive storage may have a strong impact at the PV utility scale, affecting the electricity grid and also fossil fuel generation (including gas), which at medium/high oil prices, may prove uncompetitive in the future.
6. Electric Vehicles
Developments in EVs—in terms of both a potential increase in electricity demand and consumption patterns—could have significant implications for the electricity system.
There are three important issues that need to be addressed with regard to EVs. The first is the extent to which they can substitute conventional diesel and gasoline vehicles and how they will compete with alternative energies, that is, compressed natural gas, biofuels, liquefied petroleum gas, and, in a more distant future, hydrogen. The second issue is the effect of EV penetration on power demand and on the shape of the daily demand curve.
The third relevant issue is the impact of replacing diesel vehicles on the emission of greenhouse gases, such as CO2 and NOx, and on particle emissions.
With regard to the first point, the penetration of EVs will be mainly related to economic fundamentals, in terms of Total Cost of Ownership (TCO). This indicator is in turn closely related to the prices of vehicles and fuels, and in EVs, to the current and future price of batteries. However, TCO is not the only factor to be considered. Other items, such as subsides, incentives, the regulatory framework, as well as societal issues, also need to be taken into account. And last but not least, the recharging infrastructure is also a key factor.
Based on a hypothesis of specific consumption, prices of vehicles and fuels and cost of the recharging infrastructure, Álvarez Pelegry and Menéndez (2016) have performed a comparative analysis for Spain, focusing on the Basque region. The study calculated the following TCOs (in € per 100 km) for different energy types: gas oil, 18.5; battery electric vehicle, 24.7; compressed natural gas, 20.6; and liquefied petroleum products, 18.2.
In relation to the current and future prices of batteries, which clearly influence the TCO, elsewhere in this volume, Weber & Wilson discuss developments in automotive battery technology. They quote a number of sources, including Nykvist and Nilsson (2015), who give a wide range of prices per kWh (approximately $200–450 per kWh for 2010 and $150–250 per kWh for 2025–2030).19
Other assumptions about Li-ion batteries from the DOE indicate a target PHEV battery cost of $125 per kWh by 2020.20 McKinsey and Company (2014) place the figure at nearly $200 per kWh in 2020 and $163 per kWh in 2025. Others estimate a price of $215 per kWh in 203021 (Element Energy, 2012). Fraunhofer (2013) examines costs and energy density for 2020, finding a considerable range of prices (€100–300 per kWh) and energy densities (150–300 Wh per kg) (all approximate figures).
Álvarez Pelegry and Menéndez (2016) assume a price of $383 per kWh in 2015 and $197 per kWh in 2020 (McKinsey, 2014) and a 25% share of TCO in battery costs (Hensley et al., 2009). The TCO results for the different energy alternatives without incentives are quite similar for the period 2020–2025: in the range of €17–20 per 100 km. These figures are also similar to the TCO for current EVs, with incentives/subsides.
It can thus be concluded that assumptions on penetration based on the relative TCO “prices” of battery electric vehicle, gas oil, compressed natural gas, and liquefied petroleum products are not very robust. Other elements, therefore, need to be considered to make reliable assumptions on the future development of EVs.
In Spain, EVs enjoy considerable policy support at different levels. The central government’s MOVEA plan finances the implementation of fast and semifast recharging points on public roads. At the regional and local levels, as well as specific subsidies, a range of other measures has been implemented in cities. These include exemption from parking fees for EVs and priority use of dedicated bus lanes, as well as restrictions on the use of conventional fuels in downtown areas.22
Based on these data and considerations, the most conservative hypothesis would involve a continuation of the current rate of growth in new EVs to 2020 (around 5000 vehicles per year23), giving a total figure of around 40,000 in 2020. However, given the various promotional mechanisms (economic and others) and the expected decrease in the TCO, a more optimistic forecast, such as that used by the Gobierno de España (2016),24 would suggest a figure of around 150,000 in 2020. After 2025, the EV market is likely to develop faster, with stronger penetration, resulting in an S-shaped growth in EVs.
With regard to the second of these points, and based on the hypothesis established in CNMC (2015), the effect of EV penetration on electricity demand would be an increase of 1.5 TWh25 in projected electricity demand to 202026 [estimated at 273–285 TWh for that year (CNMC, 2015)]. This would mean an increase of 30 MW during demand trough hours and 300 MW at the winter peak.27
Álvarez Pelegry and Menéndez (2016), basing themselves on Gobierno de España (2016) assume the same growth rate for 2020–2025 as in the previous 5 years. This assumption is in part based on the fact that TCO is not expected to decrease significantly until 2025. However, it is important to note that this figure may change as a result of technological and/or economic developments. After 2025, TCOs of EVs may become more attractive than diesel or gasoline or even GNC and GLP, and thus an annual growth rate of 5% for the period 2025–2030 has been considered.
One element that will certainly aid EV penetration, and help avoid incremental power capacity is RD 647/2011, which establishes a supertrough tariff (between 1 and 7 a.m.) for EV electricity consumption. This currently stands at €0.886 per MWh for the variable term (IDAE, 2016). Considering an average of 23,400 km per year and a specific consumption of 20 kWh per 100 km, the electricity tariff would be €95.22 per MWh, including payment for a capacity of 3.7 KW. This tariff obviously incentivizes the use of EVs and helps avoid the need to build new capacity for peak demand.
With regard to the third relevant issue—the impact of replacing diesel vehicles with EVs—Álvarez Pelegry and Menéndez (2016) have calculated “savings” in fuel expenses and emissions reductions, basing themselves on figures for a number of journeys in the Basque Country. If the beneficial effects of clean air are taken into account, the introduction of EVs appears to make economic and environmental sense.
If governments and politicians take this factor into account, it is clear that the incorporation of EVs may be one of the key elements in transport innovation and an eventual transformation of power grids.
7. Conclusions
In Spain, generous regulatory support for renewables, introduced within the framework of the government that plans to encourage renewable energy, had grave economic ramifications. The result was an increase in electricity prices for consumers that made self-consumption attractive, while distorting the effective development of prosumption.
The increased costs to the electricity system caused by that situation have engendered wariness among legislators toward any new developments.
At the same time, technological and economic developments in the field of PVs have led to a faster growth in PV generation than initially expected. This trend is likely to continue, not only for self-consumption at the household and small business levels, but also at the utility scale.
Developments in the area of EVs, both technological (improvements in vehicle range) and economic (reduced battery cost) should help bring the total cost of EV ownership more in line with other alternatives. At this time, the main barriers to large-scale development of this form of transport are economic, including the lack of a sufficient charging infrastructure.
Prosumption and greater penetration of EVs will influence the makeup of the power grids and electricity industry of the future. Specific regulations already exist in Spain in both areas, providing a legal framework for further development. Intelligent and efficient regulation must take into account the total cost of the system, as well as provide technically and economically efficient solutions.
To sum up, the power industry and grids of the future will be different than those of the present model—a message that resonates throughout this volume—and economic policy and regulations are likely to play a decisive role in this transformation. However, it is singularly difficult to predict the exact pace of change, or whether it will be evolutionary or disruptive in nature, as this will depend on a combination of regulatory, economic, and technological factors.
..................Content has been hidden....................
You can't read the all page of ebook, please click here login for view all page.