
Chapter 6
Powering the Driverless Electric Car of the Future
Jeremy Webb
Clevo Wilson Queensland University of Technology, Brisbane, QLD, Australia
Abstract
The automotive industry is entering an era of transformative change, a key element of which, is the increasingly rapid uptake of electric vehicles (EVs). The prospect of battery-powered electric vehicles (BEVs) becoming both a major power consumer and part of a new distributed supply source is, therefore, a critically important planning issue for power utilities. This chapter describes the likely ongoing exponential increase in EV adoption as a product of a coincidence of powerful technological, social, commercial, environmental, and governmental forces. Explored is the way in which EVs will interface with power grids and the likely effect on demand and supply.
Keywords
autonomous vehicles
electric vehicles
distributed generation
car sharing
automotive batteries
1. Introduction
This book’s underlying theme is innovation and disruption in the power sector and their impact on the grid, particularly the distribution network. It is fair to say that of all technological innovations likely to impact the power sector, the rise of electric vehicles (EVs) and the evolution of the autonomous versions thereof are among the most noteworthy.
The automotive industry is entering an era of unprecedented transformative change, a key element of which, is the increasingly rapid uptake of electric cars (EVs).1 The annual doubling of EV sales (Fig. 6.1) has pushed the global population over the 1 million mark for the first time in 2016 (1.25 million). While this represents only 0.1% of the current global population of around 1 billion passenger cars, an ongoing exponential rise in sales and ultimately wholesale replacement of the internal combustion engine automobile (ICV) is being seen as increasingly inevitable.
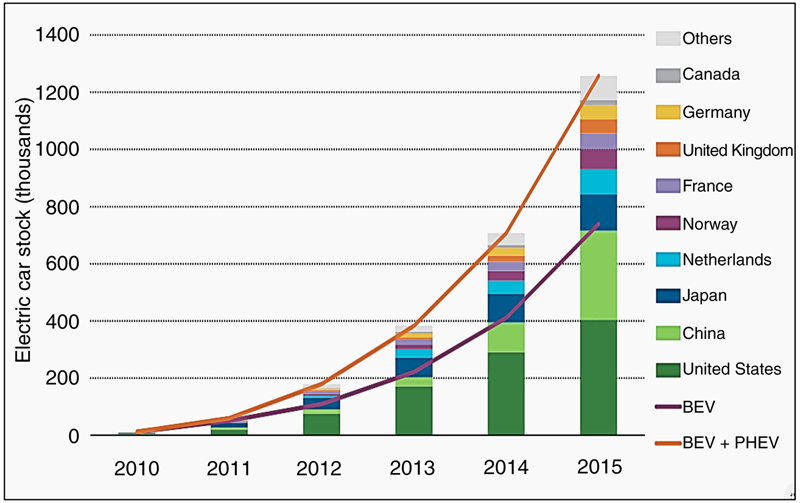
Figure 6.1 Global and country uptake of electric vehicles (EVs), 2010–15.
Note: The figure’s legend for different countries (bottom to top) is replicated in the same order on chart’s bars from bottom to top. The top graph line represents BEV and the bottom graph line BEV + PHEV. The EV stock shown here is primarily estimated on the basis of cumulative sales since 2005. (Source: International Energy Agency (2016a).)
Note: The figure’s legend for different countries (bottom to top) is replicated in the same order on chart’s bars from bottom to top. The top graph line represents BEV and the bottom graph line BEV + PHEV. The EV stock shown here is primarily estimated on the basis of cumulative sales since 2005. (Source: International Energy Agency (2016a).)
Given how radically technological and socioeconomic factors are changing, there can be no great precision in forecasts about EVs’ penetration of the ICV’s century-old overly long dominance—as is evidenced by widely ranging estimates. A Goldman Sachs (2016) report puts EV sales in 2025 at 25% of the light car market, while Bloomberg (2016) estimates the EV total at 41 million by 2040, representing 35% of new light vehicle sales and 90 times that sold in 2015. Orton et al. quote a projection of 22% EV penetration in Australia by 2030. The International Energy Agency (2016a) projects a global population of 60 million vehicles in 2025 and a more than doubling to 140 million by 2040. We consider this is the more likely scenario. These transformative changes are now becoming more visible with a rising uptake of EVs as their price falls—a product in turn of growing competition in the EV market. Accelerating EV ownership is equally a product of consumers becoming more aware of how much cheaper EVs are to run and maintain.
In concert with the uptake of EVs, the prospect is being created of battery-powered vehicles (BEVs) becoming an integral part of electricity grids in terms of both representing sources of demand and supply and thereby creating a new class of prosumers.
Of critical importance then for utilities is an understanding of the powerful technological, social, commercial, environmental, and governmental drivers of this uptake and of the certainty with which the uptake can be predicted.
Section 2 of this chapter describes the phenomenon of peak car and the likely progression toward shared electric autonomous cars. Section 3 investigates the scale of current and likely future EV cost reductions while Section 4 reviews developments in the deployment of EV fueling infrastructure. Section 5 examines the commercial drivers of rising EV sales and the role of multinationals in EV uptake. Section 6 looks at the current developments in battery technology and prices while Section 7 looks at the effect of the rollout of EV refueling infrastructure on power grids and whether a constraint on EV adoption will be created. Section 8 looks at new developments in battery technology and Section 9 describes the current and likely government role in incentivizing the adoption of EVs followed by the chapter’s conclusions.
2. Peak car and EVs
In a remarkably broad cross-section of cities in the United States, Western Europe, and Australia, the upward trend in automotive usage in urban areas now appears to be at an end and is now in decline. This phenomenon is being described in a number of studies as “peak car” (Metz, 2014; Webb et al., 2016; Briggs et al., 2015). It is generally defined as a leveling off and in many cases a decline in annual per capita kilometers traveled. In countries, such as the United States and Australia, the arrestation of the increase in kilometers traveled occurred in the late 1990s early 2000s. Its causes involve a complex of issues including:
• Urban reconfiguration: the recent trend to increasing densities in inner and CBD precincts
• Sociodemographic changes: a decreasing attachment to the automotive mode of transport particularly due to the rise of “digital natives”
• Cost and congestion: increasing aversion to the automotive mode of transport in dense urban environments and the rising cost of social and environmental negative externalities
• Internet-enabled car sharing and integrated public transport
What is clear from these trends is that the socioeconomic drivers of peak car are underpinning the integration and progression toward shared electric and autonomous cars. Thus a number of studies including Seba (2014); Tillemann (2014) are pointing to a process of transformative change with the simultaneous advent of shared cars (SVs), all EVs, autonomous vehicles (AVs), and their impending emergence as shared electric autonomous vehicles (SEAVs). Their collective arrival, is described by Jim McBride, technical leader in Ford’s autonomous vehicles team as “… a paradigm shift that’s not terribly dissimilar from [the shift from] horses and carriages going to cars. We’re going to have cars driving without you …. That’s a huge paradigm shift and it opens up a whole variety of new business models that weren’t previously available” (ZDnet, 2016).

Impression of an autonomous vehicle. (Source: Autonomousvehiclesymposium.com.)
Key elements of the new emerging business model are, first, the way this new form of individualized transport is to be powered. There are convincing reasons, explored in this chapter, why wholesale electrification of the car’s propulsion system is rapidly moving from a projection to a certainty. Such a development clearly has major flow-on consequences in terms of how this power is sourced, how it is stored, and how it is utilized.
The second major element is the prospect that EAVs as on-demand shared vehicles would become substantially cheaper than privately owned vehicles per km traveled and substantially cheaper than taxis. If the price differential is sufficient there will clearly be substitution of private ICVs for SEAVs with profound consequences for urban habitats. The current rule of thumb is that one SEAV can replace between 7 and 10 privately owned vehicles depending on the urban environment.
Autonomous substitution is also likely in public transport at first on bus routes where low patronage makes them currently uneconomic and therefore suitable for small autonomous public vehicles. Ultimately there is no reason why all buses should not be autonomous. Equally, AVs will enable hybrid systems, such as that of the Italian start-up Next Future Transport Inc. Being developed are autonomous modular public transport pods which can carry up to 10 people and which are interlinked as a single vehicle in high density routes in a city’s CBD. However, once it reaches lower density suburban regions they separate out on individual routes.
Thus while SVs and AVs are not a necessary element in the evolution of EVs there are strong synergies between all three technologies which indicate BEVs will be a natural complement to SVs and AVs and their increasing dominance of individualized automotive transport.

Hybrid SEAV modular transport system. (Source: NEXT Future Transportation Inc.)
Without a human driver, SEAVs’ design is set for a total reconfiguration. The far smaller and the far simpler EV power train (most importantly the absence of a gearbox) provides exceptional flexibility for such a redesign in which the motor can be positioned in a variety of positions given its size and the simplicity of connection to powering the car’s wheels.
3. EV cost advantages
A second major area of EV advantage lies in its running cost advantages. The US Department of Energy (2016) computes that even at the current historically low gas prices, EV power is 50% cheaper. That advantage does not change dramatically when, in the future, EVs become the dominant mode of transport given the current capacity of electricity grids (if charging is carefully managed) is estimated to be generally adequate to meet most of their power demand. Such a scenario is discussed later in this chapter.
It is also clear that nonrunning costs for electric cars are substantially less. The modern electric car does not have costly service intervals as is now necessary with IC engine cars. That is because the engine is far simpler mechanically, has no gearbox, drive shaft, and far fewer moving parts (an EV has around one-third of the moving parts of an ICV). The Rocky Mountain Institute (2016) estimates that within the pipeline are longer range lower cost EVs which will deliver in the next few years annual cost saving (EV over an ICV) in the United States of around $4000. For the country as a whole such savings could reach $200 billion annually once the EV population reached 50 million vehicles (Fig. 6.2).
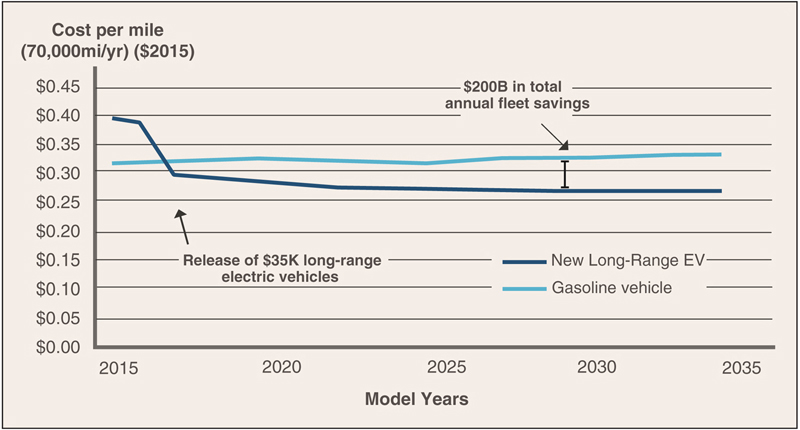
Figure 6.2 Comparative cost of electric and gasoline-powered vehicles. (Source: Rocky Mountain Institute (2016).)
Estimations by Tesla S model owners show that if their substantially lower fuel and maintenance costs are factored in together with government purchase subsidies, over a 5 year 100,000 km car life the cost is roughly the same as owning a similarly priced luxury model ICV (Transport Evolved, 2016). Such cost savings will become greatly magnified as EVs become the standard propulsion system for SVs, which have far higher utilization levels (current individually owned vehicles are idle around 95% of the time). Here the capital cost of an EV becomes less of a factor in per km costs with lower fuel and other running cost becoming an overwhelming advantage. Moreover, given the accepted convergence of EVs/SVs and AVs in their SEAV form, EVs will be considerably lighter structurally given such a design is compatible with its radically lower accident rate. Such weight reductions—possibly around 20%—translate into an equivalent increase in fuel efficiency and a lower vehicle cost. Of course according to the extent to which batteries increase a vehicle’s weight compared to that of an ICV the fuel saving would be commensurately reduced.
4. EV fueling infrastructure
While, as outlined, there are compelling reasons why SAVs will adopt all electric power trains, there are, nevertheless, major technological hurdles which will have to be overcome before there is a wholesale uptake of EVs.
In meeting these targets there are, as the International Energy Agency (2016b) admits, particular barriers to overcome where BEVs are concerned.2 This is important given there is an assumption that a fully fledged EV take-off will come only when BEVs are competitive in costs and have adequate range and a reasonably extensive refueling infrastructure. Hybrids (PEVs) and plug-in hybrids (PHEVs) are, for the major proportion of the automotive industry, recognized as a transitional technology, which will slide into obsolescence once the above hurdles are overcome. Prices of hybrids are already falling sharply, an indication that alternative technologies are “knocking on the door.”
It is generally accepted that EV power outlets have and will continue to grow roughly in line with the growth of the EV population (Fig. 6.3). Thus the average growth in the number of publicly available charging outlets has more than doubled on an annual basis in the past 5 years. In 2015, EV power outlet growth was 71% compared to EV stock growth of 78% with roughly equal numbers of public slow and fast chargers. Moreover, many governments are providing substantial subsidies for the rollout of charging outlets including home charging outlets (e.g., in Denmark and the United Kingdom). In the United States some 36,000 publicly accessible outlets installed by 2015 had received government subsidies. A number of governments have also mandated the inclusion of EV chargers in new residential and commercial buildings (e.g., France).
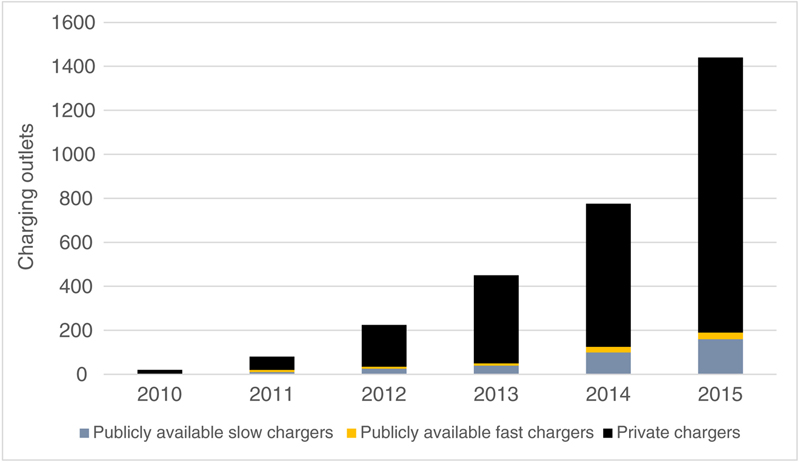
Figure 6.3 Global EV power outlets, 2010–15.
Note: The left to right order of the legend for types of power chargers is replicated in the figure’s bar charts from bottom to top. Private chargers are estimated assuming that each EV is coupled with a private charger. (Source: International Energy Agency (2016b).)
Note: The left to right order of the legend for types of power chargers is replicated in the figure’s bar charts from bottom to top. Private chargers are estimated assuming that each EV is coupled with a private charger. (Source: International Energy Agency (2016b).)
In line with commitments to increase EV fleets, governments are equally making forward commitments to EV power outlet rollouts. In July 2016, the Obama administration announced a $4.5 billion loan guarantee scheme to back its plan for a national rollout of EV changing stations. China plans to have 5 million more outlets by 2030 while the EU has recommended at least one outlet per 10 vehicles and 8 million charging points by 2020. The International Energy Agency (2016b) estimates that, globally, the number of slow chargers would have to reach between 1 and 2.5 million and fast chargers between 0.1 and 0.5 million in 2020. By 2030 these figures would need to rise to between 8.4–19 million and 0.8–3.7 million, respectively—an overall 10-fold rise between 2015 and 2020 and 80–120-fold by 2030.
5. Commercial drivers of EV uptake
Collectively then, these represent strong drivers of EV uptake notwithstanding the key remaining hurdles of EV range and battery cost. There is nevertheless evidence that the rate of technological progress in extending battery range and lowering costs will continue and create a fundamentally superior alternative to ICVs. Tesla has a market capitalization of over $US 30 billion (as of October 2016) not a great deal less than that of Ford’s $US 47 billion and GM’s $US 50 billion. Comparatively these are exceptional figures given the diminutive size and production volume of Tesla. As analysts are pointing out, the share price in large part reflects investors’ view that Tesla is the global leader in a highly disruptive form of technology and which has the potential to profitably transform the automotive industry.
As Max Warburton, a Sanford C. Bernstein & Co. analyst in Singapore says, Tesla’s shares are priced less on the company’s own financials and more on how it’s forcing competitors to boost spending on electric cars. “Tesla is massively disruptive…. It’s valuation reflects the $30 billion problem it’s created for the rest of the car industry” (Bloomberg, 2015)—a reference to the amount he says other automakers will spend chasing Tesla.
Uber as the leader in the booming sharing economy is equally a driver of the switch to EVs. With a market capitalization of $70 billion (making it by far the largest, globally of any start-up) its vision is of SEAVs taking over globally as the major form of individualized shared transport. The presence of some of the largest global companies, Google and Apple, in the domain of autonomous car also reinforces the conviction of the top end of the business community that SVs, EVs, and AVs will converge into a massively disruptive and profitable transport form—notwithstanding the evident need for further substantive technological progress to achieve an SEAV “killer app.”
It has not been lost on stock market analysts that just as with the iPhone and other disruptive technologies, EVs’ penetration of the automotive market is now very much a product of increasingly strong market forces. As Álvarez Pelegry notes in his chapter, Spanish EV numbers increased 20% in the year ending June 2016. That is, as expectations and competitive forces ramp up, so are resources directed into research which becomes more focused. Tesla’s extraordinary success and the prospect of new entrants into the automotive industry with extremely deep pockets has been a key driver of these competitive forces. This threat is clearly increasing the speed with which existing car companies are scheduling electrification of their car fleets. Nissan and Renault have revealed a $US 5.4 billion investment in electric cars. Ford has said it will pour $4.5 billion into developing electric cars through to 2020 when its aim is to have a fleet which is at least 40% electric. GM has been no less focused: reportedly some 8600 designers and engineers are working on electric and other alternative propulsion systems. Volkswagen’s plans to introduce 30 new electric models by 2025 carries with it the goal of producing at least 25% of its output with electric propulsion.
6. Developments in automotive battery technology
The range delivered by and cost of batteries are clearly the key factors in marking the point at which EVs become competitive with ICVs. A study by Nykvist and Nilsson (2015) shows the cost of automotive batteries by leading producers falling from around $1000 in 2007 to around $300—an annual reduction of around 6%–9% a year. Since 2011 they have further calculated that battery capacity has risen by an average of 100%. This exponential fall is, they point out, well in excess of most projections which had the current costs as only being realized by 2020.
Such reductions have been a product not only of R and D improvements, but also from economies of scale (given sales in this period have been doubling each year) and the sidelining of less efficient battery models. Moreover, there are good prospects for further R and D improvements for the industry standard lithium ion (Li-ion) battery in terms of anode and cathode materials, separator thickness and stability, and electrolyte composition. For these reasons, Nykvist and Nilsson (2015) project a continuing cost decline in automotive batteries being produced by leading manufacturers of around 9% annually which would bring costs down to around $230 kWh by 2017/2018 (Fig. 6.4). This represents a level significantly below projections in most peer reviewed studies and is on a par with more optimistic projections by nonacademic analysts, such as McKinsey.
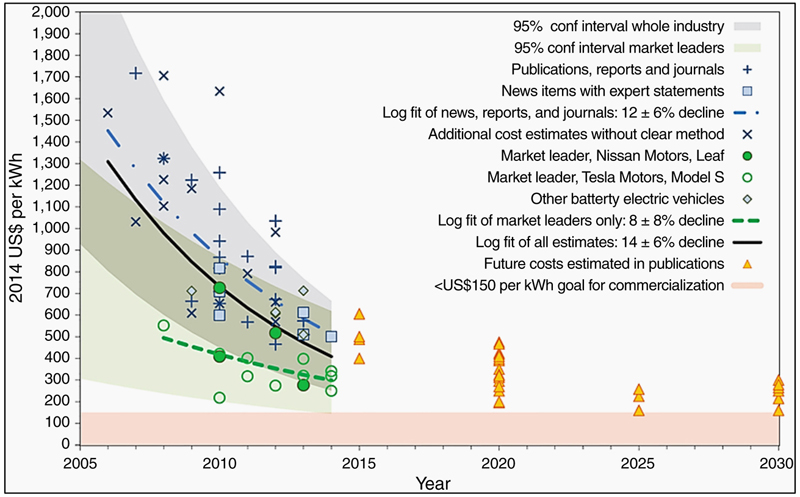
Figure 6.4 Projections for reduction in kWh costs of automotive battery. (Source: Nykvist and Nilsson (2015).)
There has been a general consensus that EV/ICV parity at the entry level/mass market auto sector will be reached when car batteries reach a cost level of $US 100–150 kWh. The International Energy Agency (2016a) and analysts such as Morgan Stanley (2015) have projected parity for Tesla level cars with comparable ICVs at $US 300 kWh (assuming a gasoline price of around $3.50 a gallon) over the lifespans of 10 years. At these levels the battery represents around 25% of the cost of an EV—a figure which applies to both the larger Tesla S and the compact Nissan Leaf.
Even such bullish projections were again shown to be conservative in mid-2016 when GM (Chevy Bolt), Nissan (Leaf), Renault (Zoe) announced compacts with almost double the previous range of over 200 miles (300 km). These Li-ion batteries boast only a very modest increase in weight and size for an almost doubling of output. GM has claimed a kWh cell price of around $150 although industry experts puts the price at closer to $US 200 kWh once packaged as a car battery while Tesla claims a packaged battery cost of around $190 kWh. Some industry experts suggest these figures are optimistic and put the cost at around $215 and $250 for GM and Tesla, respectively.
Even if these higher estimates are closer to reality, the further falls of 40%–60% needed to reach the gold standard of $100–150 kWh will clearly be reached if the current annual cost reductions of around 9% continue as projected. This assumes that the Li-ion battery remains the battery of choice for major manufacturers. Not everyone agrees, however. The Li-ion battery has been around since the 1990s and some experts feel that there is not a great deal of scope for further R and D based major increases in its density and cost reduction. These doubts were, however, expressed before LG Chem and before them Panasonic were able to dramatically increase the Li-ion’s power weight ratio.
Nevertheless, with the exponential growth increases of the global EV population (a stock of around 20 million BEVS and PHEVs is projected by 2020) (Fig. 6.5), battery megafactories are being created, such as those of Tesla, and of Korea’s LG Chem and Samsung. They promise substantial economies of scale which are projected to pull battery kWh costs down by as much as 30%. Some of the more bullish predictions have Tesla’s gigafactory, driving down auto battery costs by as much as 50% via economies of scale, supply chain optimization, increased automation, and production domestication (Cleantechnica, 2015).
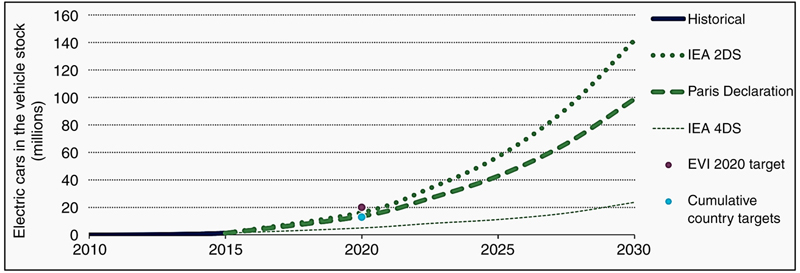
Figure 6.5 Projected uptake of HEV/PHEV and battery-powered electric vehicle (BEV). (Source: International Energy Agency (2016c).)
7. EV refueling infrastructure: interface with the grid
The closing in on the parity target is, of course, putting progressively greater focus on another crucial barrier to EV adoption, ease of refueling. In part this is being solved by cost parity in that the lowering of EV battery cost is being achieved by developing batteries with higher power density and range, but with only marginal increases in size, weight, and cost. Thus the new range extended ZOE/Leaf and GM Bolt means consumer concerns about both the time taken to refuel and the size of the refueling network will be commensurately diminished. This is particularly so in urban environments where trip lengths are modest and charging points more numerous.
US census data (US Department of Transportation, 2009) show that 95% of all trips by car are less than 30 miles (48 km) and 95% less than 70 miles (112 km) with a weighted average of 8.5 miles (13 km) in urban areas and 12.1 miles (19 km) in rural environments. Moreover, with considerably lower per trip distances traveled in Europe and Asia/Pacific cities, range anxiety would seem to be even less of an issue.
On the other hand, with price parity no longer the key hurdle for large-scale uptake of EVs, the real and perceived lack of charging infrastructure and the real and perceived issues surrounding charging time for Li-ion batteries is destined to become a central issue in consumer’s powertrain preference. This is being borne out by surveys of the public’s attitudes to purchasing EVs. The greatest concern shown by potential buyers (1/3) is range, while adequacy of charging networks ranked third after cost (27%) (Egbue and Long, 2012).
Indicated, therefore, is that over the next 3 years as the issue of EV price recedes as a disincentive to EV uptake, the interface with charging networks and the linked-in issue of charging time and duration will be at the forefront. As already noted, the current rollout is uneven although on average, keeping pace with EV sales. It is no secret, however, that as EV numbers gain critical mass, the charging infrastructure rollout will require substantial investment and regulation to ensure that the new EV interface does not disrupt conventional supply channels.
Depending on the structure of national grids, capacity and/or feedback issues will need to be addressed in a comprehensive national rollout of EV charging networks. Where constraints on grid capacity are created by large-scale EV uptake, the opportunity to use EVs as an ancillary grid storage instrument can present its own set of issues.
In a Spanish study (Fernandez et al., 2011) an assessment is made of the impact of plug-in EVs on distribution networks where EVs are used for grid backup. Their model takes three scenarios of EV penetration which correspond to 35% in 2035, 51% in 2030, and 62% in 2050. Also assumed is that 85% of cars charge in off-peak hours (midnight to 6:00 a.m.) and 45% during (Spanish) peak hours (1600–2100). At peak hours, it is assumed that 40% of EVs are connected, 90% in a fast charging mode, and 10% are injecting power into the grid.
Under the assumption 62% of cars are EVs, the required network reinforcement reaches 19% of total actual network costs for the high population density region surveyed (1800 people per sq. km and car ownership rate of 10%). However only around a 3% reinforcement is required for the rural region surveyed (15 per sq. km and a 50% car ownership rate). The required investment is higher in the urban area with high load density and high installation costs. But by the use of smart charging strategies it is shown that up to 60%–70% of the increased investment can be avoided. In addition, if strategies are deployed so that some of the PEVs that were charged at peak hours are charged at off-peak hours, up to 35% of the required investment is also avoided.
As battery storage capacity increases in concert with a rapid uptake of EVs, utilities, other enterprises and governments involved in the rollout of charging infrastructure are likely to find a commensurate increase in off-peak home charging from low-cost single-phase terminals. A commensurate decrease in the need to populate urban areas with higher cost fast charging points can equally be expected. Woodhouse and Bradbury (Chapter 2) provide estimates that in the United Kingdom, charging a 30 kWh EV battery from residential solar, can produce a saving—based on typical day-night tariffs—of €5 or more per charge. A further outcome to note is that as home charging uptake rises, public charging infrastructure resources can be refocused on decreasing the gap between long-distance charging points.
Rising use of home charging for EVs is firmly in the sights of Tesla’s Elon Musk in his meshing of rooftop solar (through the acquisition of PV installer Solarcity), the sale of home storage batteries and use of the storage capacity of electric cars. Such a package, if commercially successful, would greatly increase the capacity of EV owners to stay off the grid.
However, as Orton et al. observe in Chapter 16, charging an EV from a residence increases power uptake between 30% and 50% which means solar arrays will need to be substantial. One calculation (Energysage.com, 2016) is that an extra $2000 investment in solar panels (over and above that installed for household consumption) could provide sufficient power to meet a compact EV’s annual power needs. That is based on an average daily travel distance of 25 miles and a Tesla Model S fuel economy rating of 34 kWh/100 miles. On this basis it is calculated that homeowners could break even on their rooftop solar-for-EV investment in 7–10 years. There is however considerable debate about whether Tesla’s rooftop/EV package is indeed currently an economic proposition – an issue which is difficult to resolve without proper specification of the systems being used by Tesla.
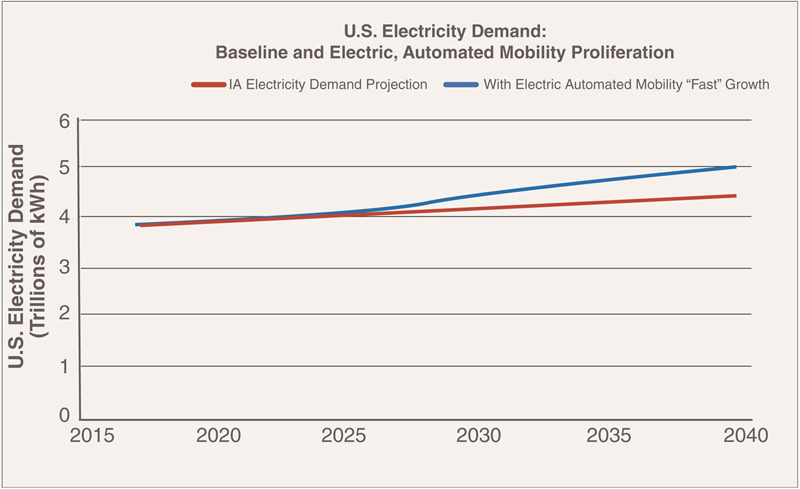
To the extent that greater battery power densities increase feedback into the grid (V2G), a great deal more attention will need to be paid to technical and regulatory infrastructures. US estimates of the effect of high levels of EV ownership indicate that the existing infrastructure can largely accommodate such an eventuality. The RMI estimates that by 2035, EV uptake could produce a 10% increase in electricity demand (Fig. 6.6). Orton et al. quote an Australian study which indicates even if EV penetration was substantial (over 20%) the effect on the national electricity market would be modest—about a 4% increase.
However, with smart charging, including the use of V2G, researchers at the US Department of Energy’s Pacific Northwest National Laboratory estimated that, overall, US power grids have sufficient excess capacity to support over 150 million battery-powered cars, or about 75% of all cars on the road. However, it is noted that, to the extent that homes will begin to install high voltage quick chargers, the capacity of residential substations to handle such an increase may become an area of concern.
As noted in a number of studies (Putrus et al., 2009; Daim et al., 2016), the significant increase in distributed supply and reverse power flow created by EVs can have deleterious effects on a grid’s voltage levels and fault currents, and thereby bring about malfunctions in the grid’s protection system, and generate phase imbalance. That issue has been showing up in Australian cities which have some of the highest residential solar panel ownership rates in the world. A number of utilities are citing problems of regulating grid voltage and associated power trip offs—where solar feedback to the grid is at a high level—as a reason for limiting power to grid feedback.
While smart grids have already been developed to handle these eventualities, in most cases they have not been implanted, given at the current level of distributed feedback, they do not warrant the investment. Moreover, as the recent International Energy Agency report (2016b) points out, as the demand for fast charging three-phase outlets rises, without adequate location and time signals in electricity pricing, this could become a real concern for distribution networks.
8. The future of EV battery technology
While kWh price parity between BEVs and ICVs is in sight, there remains the fact that in terms of power density, the Li-ion—the standard bearer for the EV world—is no match for gasoline (Table 6.1). But, given gasoline’s actual in-car efficiency is only around 15% against electric propulsion’s 70%, the Li-ion battery’s 450 Wh/g energy density is in effect competing against gasoline’s effective density of around 2500 Wh/kg.
Table 6.1
International Comparison of Policy Support for EV Infrastructure
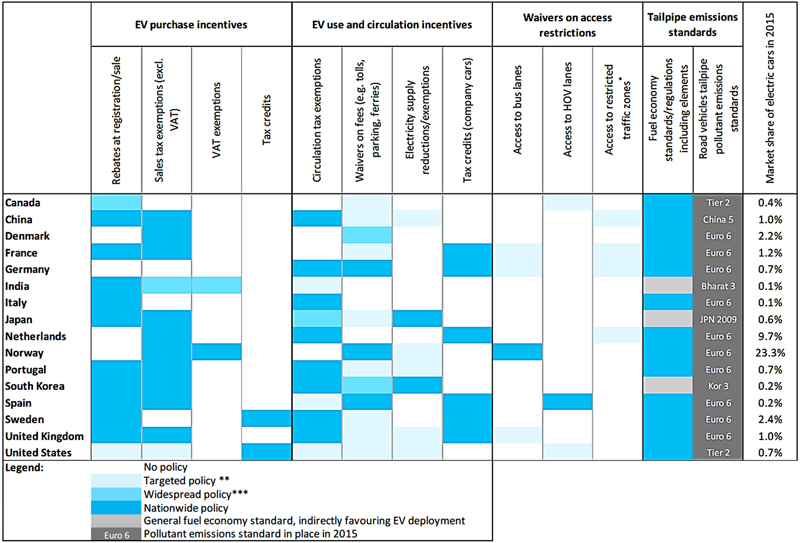
|
Source: International Energy Agency (2016d).
Notes: * Such as environmental/low emission zones; ** policy implemented in certain geographical areas (e.g., specific states/regions/municipalities), affecting less than 50% of the country’s inhabitants; *** policy implemented in certain geographical areas (e.g., specific states/regions/municipalities), affecting more than 50% of the country’s inhabitants.
On the other hand there are a number of other battery types which could well exceed gasoline’s effective energy density. These are largely populated with metal air and iron air. Thus Li-air and Al-air have theoretical energy densities of 11,140 and 800 Wh/kg, respectively although achieved densities are currently only 700 and 1,300 Wh/kg. Al-ion and Air-ion have theoretical densities of 1060 and 406 Wh/kg, respectively but which have so far achieved 40 and 110–175 Wh/kg (Energy without Carbon, 2016). Thus despite their exceptional theoretical potential, they pose still challenging problems for commercialization. As one commentator has observed:
Creating higher energy densities is easy. But mass producing batteries that won’t explode, suffer thermal runaway, are durable, don’t produce toxic byproducts during the charge/discharge cycle, and are inexpensive is extremely difficult. Many of these problems have held lithium-air batteries back from commercialization—such designs degrade rapidly when recharged, are damaged by the presence of water (a problem on planet Earth), or don’t hold up under multiple charge cycles. A battery that only retains 90% of its charge after 5 cycles and degrades to 50% charge after 10 cycles, again, isn’t very useful. (Putrus et al., 2009).
Some high technology solutions are, nevertheless, showing considerably promise—perhaps the most notable and exciting are the progressive improvement to supercapacitors. This form of storing energy depends not on a chemical reaction but on an electrostatic means of storing electrons. In this field graphene supercapacitors hold particular promise (Notarianni et al., 2014). Their notable characteristic is the capability to provide power and be recharged extremely rapidly. Their drawback is that, until recently at least, they have been poor in power density and considerably less so than the Li-ion battery. However, given graphene supercapacitors involve the use of layers of ultrathin (atom thick) graphene plates which have no electrolyte, they can be placed in a variety of configurations within a car.
Research carried out by a team based at the Queensland University of Technology (QUT) (Zhao et al., 2015; Liu et al., 2015) provides an illustration of the potential for cars to be partly or eventually wholly powered by such supercapacitors. Research team member Dr. Jinzhang Liu says, that while graphene based storage can be used as a power booster for cars, ultimately, he speculates:
…. the supercapacitor will be developed to store more energy than a Li-Ion battery while retaining the ability to release its energy up to 10 times faster—meaning the car could be entirely powered by the supercapacitors in its body panels. After one full charge this car should be able to run up to 500 km—similar to a petrol-powered car and more than double the current limit of an electric car.
That vision may be already backed up by some recent research reports from the Gwangju Institute of Science and Technology in South Korea (Zhong et al., 2016) which claims an energy density for graphene supercapacitors of a remarkable 131 watt-hours per kilogram (Wh/kg)—nearly 4 times that previously achieved and on par with Li-ion batteries. If achieved, this would open the way for cars to be charged within several minutes.
Another particular advantage of graphene supercapacitors is cost. As QUT’s Professor Motta points out:
We are using cheap carbon materials to make supercapacitors and the price of industry scale production will be low. The price of Li-ionon batteries cannot decrease a lot because the price of Lithium remains high. This technique does not rely on metals and other toxic materials either, so it is environmentally friendly if it needs to be disposed of. (Motta, 2014).
The critical issue remains, however, the expected length of the research to commercialization pathway. ULCA Professor Richard Kaner who is affiliated with Nanotech Energy—a startup working to commercialize graphene-based batteries—puts the time frame at 3–5 years (EEnergy Informer, October 2016). As a rule of thumb, development paths are invariably longer than predicted, particularly for radically new technology. This view would seem to be that of the major global EV battery producers—Tesla/Panasonic LG Chem and Samsung—who collectively have initiated a multibillion dollar investment plunge in large-scale Li-ion manufacturing facilities.
There is an added significance to this research in that it appears to signal that other forms of alternative power for low-carbon vehicles are not being viewed as commercially viable. In particular hydrogen-powered cars—the only type of car being currently produced albeit in very small numbers—presents a range of problems in terms of generation, transporting, distribution, and ultimately energy efficiency. For some time, studies of the relative energy efficiency of fuel cell and battery EVs (Eaves and Eaves, 2004), have shown the former to be far less efficient. They indicate that if the relatively power inefficient process of electrolysis is used to produce hydrogen and the not insubstantial losses involved in compression, storage, and distribution are taken into account (given it is a power carrier not a power source as such) fuel cells are no competitor with electricity. Moreover while the electricity grid is at least a largely readymade distribution system for EVs, hydrogen needs a whole new and very costly infrastructure.
Seba (2014) is quoted as saying: “Assuming that at some point fuel-cells will be cheap and hydrogen production will reach critical mass, it will still be at least three times more expensive to power a hydrogen-powered car than an EV.” (The Green Optimist, 2015)
9. Government and regulatory drives of EV uptake
It needs to be accepted that the uptake of EVs will not be driven simply by the extraordinary commercial opportunities they present. There are good reasons for governments and regulatory authorities to continue their already widespread incentivization of the use of electric cars (Table 6.1), although, it is argued, in an evolving form. Thus as the expected running and outlay costs of EVs fall, direct subsidization of EV car purchases are likely to be correspondingly reduced. However, internationally, sustaining a rapid uptake of EVs is still very much a government priority if the tough GHG emission targets flowing from the Paris agreement on climate are to be met (Table 6.1). For example, they require the United States and Australia to reduce GHG emissions between 26% and 28% by 2025, while the EU is committed to a more ambitious target of 80%–85% by 2050 (over 1990 levels). This will require the current annual rate of emission reduction in the United States and Australia to be more than double.
With approximately 23% of GHG emissions coming from transport in developed countries, a switch from gasoline to electricity has the potential to make a substantial contribution to achieving such reductions for governments seeking cost effective socially acceptable means.
With low hanging fruit already being harvested, it is acknowledged that these targets will largely have to come from the power generation and transport sectors. For governments, transport is particularly appealing given electrification of the automotive fleet carries with it the longer term prospect of substantially reducing the costs of this mode.
The Paris agreement has set out targets for GHG reductions within the transport sector in the form of a global EV fleet of 100 million in 2030. A European Environmental Agency (2016) report estimates that if 80% of EU cars were EVs in 2050, a 10% reduction in total emissions would occur taking into account emissions produced by the increased generation of electricity to meet EV demand.
For its part, the IEA says transport should account for approximately one fifth of the overall targeted global reductions which could be achieved if the global EV population reaches 140 million by 2030 and 900 million by 2050 (Fig. 6.7) This would be equivalent to 10 and 40% of light-duty passenger vehicles’ stock in 2030 and 2050 respectively and 20 and 40% of sales, respectively. This means an annual increase in sales of over 25% by 2025 and a 7%–10% increase between 2003 and 2005.
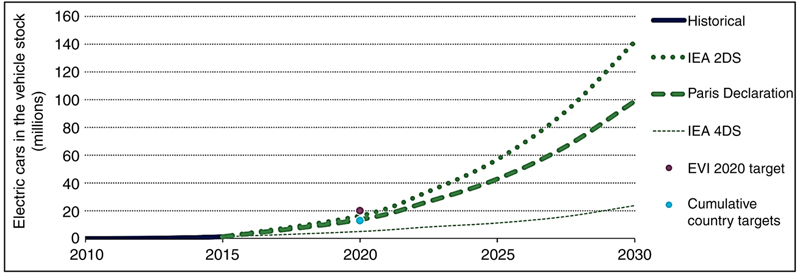
Figure 6.7 COP21 and IEA EV deployment targets.
Note: 2DS = 2°C Scenario; 4DS = 4°C Scenario. (Source: International Energy Agency (2016c).)
Note: 2DS = 2°C Scenario; 4DS = 4°C Scenario. (Source: International Energy Agency (2016c).)
The IEA argues that such a growth is achievable notwithstanding cost, range, and infrastructure issues associated with EVs. Indeed a group of 16 governments the countries of which account for 80% of all EVs currently sold and which includes the United States, China, Norway, and major EU members, have committed to a collective fleet of 20 million EVs by 2020. Key members3 have committed to specific growth rates which represent an average annual EV growth rate of 60% between 2015 and 2025 and a total EV population of 13 million vehicles.
Government regulatory regimes particularly where they tighten fuel economy and pollution standards are also powerful drivers of electrification of the private transport mode. Thus in all major EV markets, governments are legislating increasingly stringent standards. By 2021, the fleet average to be achieved by all new cars is 95g of CO2 per kilometer. This translates to a fuel consumption of around 4.1 L/100 km. Thus the 2021 targets represent a reduction of 40% over the 2007 fleet average of 158.7 g/km. In the United States, the 34.1 miles per gallon (mpg) for 2016 model year passenger cars rises to 54.5 mpg in 2025. In China car fleet average economy has to improve from 6.9 to 5.1/100 km between 2016 and 2020, a 26% improvement.
The push for a rapid replacement of ICVs with EVs has become a particular priority of the Chinese Government where, far more than any other major automotive producer/consumer nation, it has been legislating and incentivizing industry to substantially and rapidly electrify both private and public transport. As a result China is now the world’s largest and fastest growing market for EVs (Fig. 6.8). The Government’s strategy—as ably outlined in Levi Tillemann’s study (2014)—is, not immodestly, to leapfrog into the EV era, and thereby become a world leader in EV manufacturing while simultaneously effecting a radical reduction in GHG and associated automotive pollution levels. While China has so far demonstrably failed to develop a sufficient home-grown technological base to effect such a transformation with the degree of autonomy it badly wants, the linking of the powerful forces of government and industry indicates the growth of EV sales are likely to continue to rise at an exponential rate.
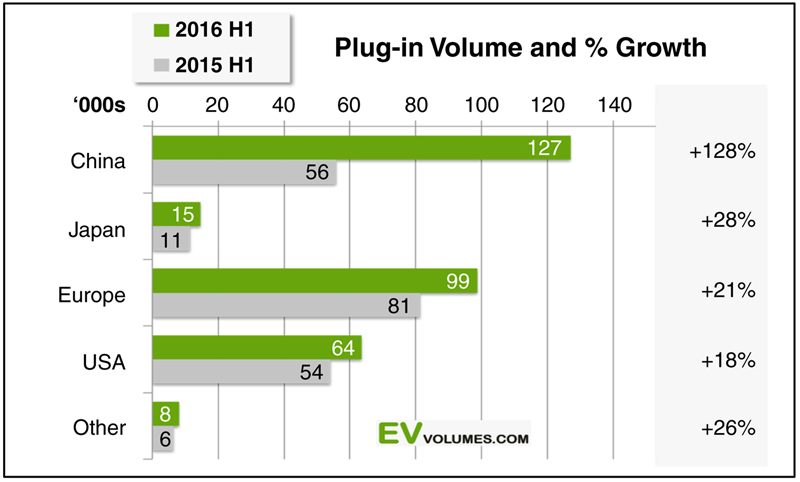
Figure 6.8 Geographical distribution of EV uptake. (Source: Electrical Vehicles World Sales Data Base (2016).)
10. Conclusions
Given the highly unpredictable rate of change in technology and equally problematic estimations of commercialization times, any projections of EV uptake is subject to a high probability of error. Nevertheless, this review of developments does indicate a high degree of certainty that there will be a very rapid uptake of EVs in the next few decades. This assumption is based first, on the recent and radical improvement to EVs’ range for entry-level vehicles (such as the LEAF, Zoe, and Bolt), and secondly a concurrent substantial fall in kWh costs—both key issues for prospective EV buyers. Equally, there is, among industry and academic analysts, a reasonable degree of consensus that the past rate of improvement to the industry standard Li-ion battery will continue to the point where, in the early 2020s, energy parity with the ICV will be achieved if not earlier. In the medium to long term, environmental issues are also likely to drive both consumers and governments toward EVs. Thus governments can be expected to play an important role in legislating and providing the necessary incentives for a rapid replacement of ICVs with EVs.
That is particularly the case for the Chinese government which has the unique capacity to partner the private sector into an ongoing and accelerated EV uptake in what is now the world’s largest market. In this sense projections and targets may merge.
Now that range and, to some extent, price are lesser issues, charging facilities, charging time and power supply issues will inevitably become the focus of attention. While there is a high level of confidence in industry and government that smart charging can go a long way to facilitate a smooth transition to an EV-dominated transport system—careful regulatory and substantial financial investment will be needed to realize this potential. Thus not only will the balance of peak and off-peak charging need to be closely managed, but the investment needed to roll out adequate high voltage fast charging stations on a national scale will need to be carefully scheduled and, if needed, incentivized.
The extent to which there will be V2G integration of EVs into power grids is dependent on some complex cost benefit calculations. While there may be scope for V2G to become an alternative to increasing grid peak capacity, the accelerated depreciation of car batteries when used in this way needs to be taken into account.
In the longer term it must be assumed that the markets being opened up for batteries as power for cars and as a means for storage of residential PV solar power, means investment in battery R and D will undergo a further radical expansion. The sheer range of new battery developments and the evident potential to effect major increases in storage and decreases in cost, indicates the potential for EV uptake to be part of a radical spread of distributed power generation and storage. For utilities, there is in these projections, an encouraging scenario of increased demand for grid power from EVs, which if properly managed, can be sourced during nonpeak hours.
On the other hand if EV battery prices continue to fall as predicted so will (as is already the case) the cost of home storage batteries. In the longer term then there is a not so encouraging (Tesla promoted) scenario for utilities of households not only generating for their own use but partly or wholly for their automotive use. For the authors that seems a natural progression as costs of batteries and solar PV continue to decline and their efficiency rises. As Sioshansi (2015) notes such a PV/battery driven move off grid could reduce utility power from a necessity to a “nice to have” category.
But as Orton et al. note, it is still unclear whether car batteries will play a dual role with household batteries in storing rooftop solar. Elon Musk’s vision (currently at least) is for householders to store and feed power from home batteries perhaps in part to ensure greater longevity of car batteries.
Clearly in store then is a complex and if not well managed, messy transition to such an off-grid environment for both cars and residences. Both utilities and network companies will need to develop quite new business models to survive in such a highly distributed environment. As noted in other chapters of this book they will need to become increasingly a service-oriented enabler of such a complex intermesh of on and off-grid power generation with a great deal of the capital investment in power generation shifting to battery manufacturers—and as projected in Chapter 19—PV solar manufacturers. For utilities one encouraging technology-driven scenario could be realized through eventual adoption of rapid charge graphene supercapacitors in EVs. That could open up the opportunity for competitive grid supplied power to a network of rapid charge stations.
..................Content has been hidden....................
You can't read the all page of ebook, please click here login for view all page.