Russell Harris** * Carbon and Energy Markets (CME), Melbourne, VIC, Australia ** Wollemi Consulting, Melbourne, VIC, Australia
Abstract
The economics of installing solar photovoltaics (PV) is significantly affected by the customer’s offer for grid-supplied electricity. In the deregulated retail electricity market in Victoria, Australia, these offers vary widely. This analysis finds median payback periods for PV installation in Victoria of 12 years, using current PV costs and the median of all retail offers. But the payback period ranges between 6 and 19 years on different offers. Median payback periods reduce to 8 years if feed-in rates are increased by 5 cents per kWh and reduce further to 7 years if fixed daily charges in retail tariffs are converted into variable charges.
Keywords
solar PV
distributed generation
payback period
Victoria
Australia
retail competition
1. Introduction
There is an active debate in Australia and in many other countries on the economics of distributed solar photovoltaics (PV) relative to grid-supplied electricity. The term “grid parity” in this context refers to the point at which distributed electricity is as expensive—to the user—as grid-supplied electricity.
The calculations are complex. They need to take account of capital and/or production subsidies, the amount of grid-supplied electricity displaced by PV, and the price of grid-supplied electricity (which often has at least two components to the charge and in many retail offers more than two).
The debate on the economics of PV relative to grid-only is an important discussion. It encompasses the wisdom of customers’ investment in distributed resources; and the knock-on effect of their choices that is, the volume of electricity sold on the grid, future expenditure on network investment, and the residual demand for centrally dispatched electricity production.
This chapter explores the economics of electricity supplied by the grid, relative to the combination of grid and rooftop PV for households in Melbourne, Australia, in November 2016.
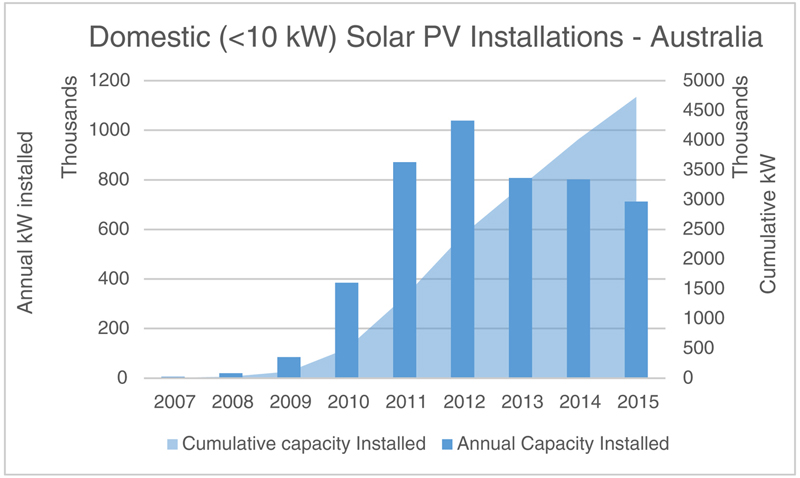
In comparison to other countries, Australia has experienced rapid expansion in household solar PV installations, with relatively little commercial or utility scale activity. Total solar PV capacity installed in Australia has recently exceeded 5000 kW as shown in Fig. 5.1. More than 80% of this capacity, equivalent to around 9% of Australia’s total grid-connected generating capacity, is on domestic rooftops.1 Rapid rooftop PV expansion was driven by the combination of declining PV costs, policy to promote renewables, and rapid increases in electricity prices (Mountain and Szuster, 2014).
Figure 5.1Rooftop photovoltaics (PV) installations in Australia.
This chapter examines the economics of installing rooftop PV in Melbourne, the capital of the state of Victoria. Victoria is one of five regions in the National Electricity Market covering the south and eastern states of Australia.2 The Victorian residential electricity market has been opened to competition since the late 1990s and all retail price controls were withdrawn in 2009. There are currently 22 retailers that in October 2016 offered 2017 different retail offers to a little over 2.4 million households in the 5 distribution areas in Victoria. Of these 2.4 million homes, some 298,000 (12.5%) have installed 957 MW of solar PV generation capacity since the start of 2010.3
In Australia, as elsewhere, the contest between PV and grid-supplied electricity is actively debated by consumers, regulators, and the industry. The Victorian Government recently announced that it intends to increase the minimum retailer feed-in rates for electricity that is exported from rooftop PV to the grid. And, following advice from the Victorian Essential Services Commission, temporally and spatially differentiated regulated minimum feed-in rates will be introduced (Essential Services Commission, 2017).
In this book, Biggar and Dimasi point to the significance of tariff structures for efficient investment in distributed generation and express concern that the growth of distributed generation in Australia reflects distortions in tariffs and feed-in rates.
Analysts and scholars debate issues of tariff design and investment incentives but often in the absence of good quality information on the existing situation. This chapter seeks to address that and, using the retail market data, assess the extent to which rooftop PV investment incentives will be affected by changes in the feed-in rates for solar exports, or changes in tariff structures by increasing or reducing the fixed component of retail offers.
The chapter starts with a description of the retail and rooftop solar markets and then explains the methodology used. This is followed by the results of the analysis, a discussion of those results, and finally, conclusions.
2. Victoria’s electricity market
Victoria’s 22 electricity retailers have an obligation to publish electricity price fact sheets setting out the terms of all generally available retail offers. The MarkIntell database (www.markintell.com.au) records and analyzes the data in all these fact sheets. It shows that in November 2016 the 22 electricity retailers together made 2017 different retails offers to households in 5 distribution zones that cover Melbourne. A count of the number of offers, by retailer, in each of the five distribution areas is shown in Table 5.1.
Table 5.1
Count of Retail Offers, by Distribution Zone, in Victoria
Retail offers are classified as either “Standing” or “Market.” Standing Offers are regulated offers that retailers are required to make and they have prices that are almost always higher than Market Offers. Around 12% of all customers remain on Standing offers. Market Offers often include conditional discounts (such as for paying bills on time or using direct-debit to pay bills) that can result in bill reductions by as much as 20% relative to Standing offers.
A remarkable range of electricity tariffs are offered by retailers in Victoria including:
• two-part (cents per day plus single variable charge);
• two-part seasonal (summer and nonsummer differentiation of variable charges);
• time-of-use (peak and off-peak variable charges plus a daily charge) in which the peak period may be weekdays only or the full weak;
• flexible time-of-use (peak, shoulder, and off-peak variable charges plus a daily charge);
• block tariffs (block sizes vary and blocks may be measured in days, months, or quarters); and combinations of block and time-of-use rates or block and flexible tariffs; and
• combinations of time of use and demand charges (calculated as cents per kW or kVA per day where demand is measured during defined summer and nonsummer periods).
Almost all Melbourne households have half-hourly interval kWh meters with remote read capability following a government-mandated installation of these meters by the five regulated network service providers. Despite this, 92% of all households remain on two-part or block tariffs whose rates do not vary by the time of use.
Following recent legislation, retailers are not allowed to discriminate between customers that have installed PV and those that have not. In other words, the same offers must be available to both cohorts.
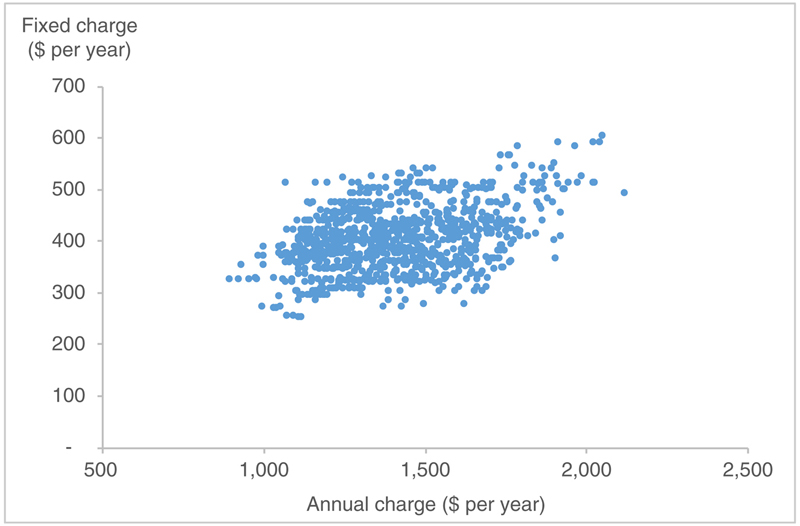
The various retail offers can result in significantly different bills. It is also notable that fixed charges make up a large proportion of customer bills. This is shown in Fig. 5.3 which plots the annual bill (on the X-axis) against the fixed charge (the fixed part of the bill) for all 2017 residential offers open to new customers in the market on October 25, 2016 assuming a customer with annual consumption of 4.8 MWh.4
Summary statistics on the data shown in Fig. 5.2 is shown in Table 5.2.
Figure 5.2Annual charges and fixed charges, all Market Offers, October 2016.(Source: MarkIntell[Insight], authors’ analysis.)
Table 5.2
Summary Statistics: Annual Charges and Fixed Charges, All Market Offers, October 2016
Annual bill ($ per year)
Fixed charge ($ per year)
Average annual price (cents per kWh)
Highest
1987
583
41.4
Lowest
713
252
14.9
Average
1313
386
27.4
Median
1294
377
26.9
Source: MarkIntell[Insight], authors’ analysis.
To be precise, only market offers open to new customers are considered. Hence Climate Saver tariffs in Powercor area have been excluded. All monetary values are in Australian Dollars (AUD). In November 2016, $1 AUD = $0.72 USD.
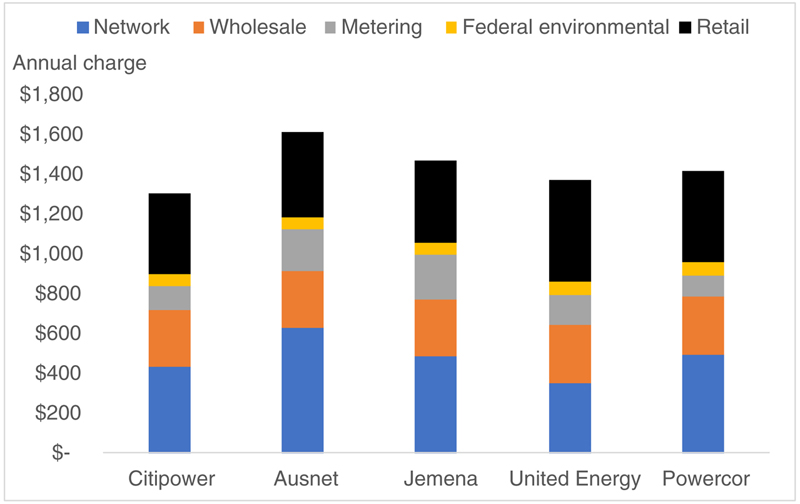
Residential electricity offers bundle all network and nonnetwork charges. The network charges vary significantly in the five distribution areas so it is necessary to strip out these costs when comparing offers. Fig. 5.3 is indicative of the relativity of the components of the residential electricity bill5 based on the simple average of the relevant charges in all Market Offers6 in each of the five distribution areas.
Figure 5.3Residential electricity bill components, all Market Offers, November 2016.(Source: MarkIntell[Insight], authors’ analysis.)
To promote the installation of domestic PV systems, various state governments including Victoria instituted feed-in tariffs at a range of rates. While these are now closed to new participants, a significant number of consumers have benefited from the schemes.
In Victoria around 88,000 homes7 receive a premium feed-in tariff of 60 cents per kWh plus retailer feed-in rate, approximately 20,0008 receive a rate of 25 cents per kWh which will expire at the end of 2016. Around 205,0009 houses—two-thirds of the total number of households with rooftop PV—only receive a retailer feed-in rate for their exports. The retailer feed-in rate has a regulated floor price that is currently 5 cents per kWh. Although a few retailers offer more the profile of an average daily consumption and solar rooftop production for various sizes of solar installation is shown in Fig. 5.4.
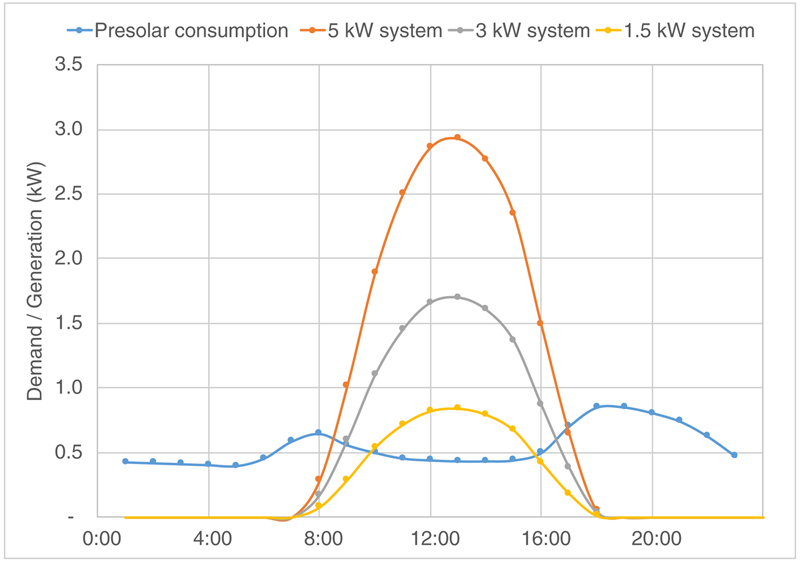
Figure 5.4Typical daily load profile before and after PV.(Source: SAM [System Advisor Model (2016:3:14), National Renewable Energy Laboratory], authors’ analysis.)
Table 5.3 presents information on the capital cost of PV before and after federal capital subsidies. The installed cost per watt in Australia seems to lower than we have observed in many other countries. This seems to reflect the very competitive market for PV supply and installation. In addition, as we discuss later, the subsidies in Australia, per watt, are now much lower than we observed in other countries.
Table 5.3
Capital Costs for PV Systems of Various Sizes, Victoria
System size (kW)
1.5
2
3
4
5
10
Installed cost presubsidy ($)
4,394
5,309
6,904
8,397
9,933
20,539
Capital subsidy ($)
1,014
1,365
2,067
2,769
3,432
6,903
Installed cost after capital subsidy ($)
3,380
3,944
4,837
5,628
6,501
13,636
Installed cost per Watt presubsidy ($ per watt)
2.93
2.65
2.30
2.10
1.99
2.05
Installed cost per Watt postsubsidy ($ per watt)
2.25
1.97
1.61
1.41
1.30
1.36
Source: Solar Choice, Renewable Energy Regulator, authors’ analysis.
Table 5.4 translates these capital costs into annual average prices per kWh produced over the life of the PV system.10
Table 5.4
Capital Costs and Average Prices, PV Systems of Various Systems, Victoria
System size (kW)
1.5
2
3
4
5
10
Installed cost per Watt postsubsidy ($ per watt)
2.25
1.97
1.61
1.41
1.30
1.36
Average cost (cents per kWh)
13.8
12.2
9.9
8.6
8
8.3
Source: Solar Choice (www.solarchoice.com.au), Renewable Energy Regulator, authors’ analysis.
Table 5.4 shows quite significant scale economy so that the average cost of electricity from a 5 kW system being about half the average cost of a 1.5 kW PV system.
The installed costs of PV systems vary widely. For example, the Solar Choice website PV price data shows that installed price of a 3 kW system ranges from $1.18 per watt to $2.14 per watt with a median price of $1.56 and an average of $1.61 per watt. This variance reflects differences in the cost of competing systems and differences in the cost of installing systems on houses of different types.
Although installed system prices continue to fall across all segments, it is difficult to understand the reasons for the variance between highest and lowest prices.
The higher prices may reflect customer preferences for local, trusted installers using higher quality components. Lack of consumer knowledge is also a factor.
3. Analytical methodology
The analysis in this chapter compares annual bills before and after the installation of PV assuming that customers remain on the same retail offer before and after installing PV. By installing rooftop PV households can reduce the amount of electricity they buy from the grid, and earn revenue from the excess production that is exported to the grid. Whether they benefit, financially, from installing PV will depend on the price they pay for PV, the amount they pay for electricity from the grid before and after installing the PV, and the income they obtain from the surplus electricity they sell back to the grid.
The retail offer dataset used in this analysis is a subset of all retail offers. Specifically, since 88% of households in Victoria are on Market Offers, only Market Offers (1602 offers out of a total of 2400 offers) are included. In addition, it is assumed that in those Market Offers, consumers always meet the conditions of the conditional discounts in those offers. This reduces bills, typically, by 10%–20% per year.
For the purpose of this comparison, the cost of rooftop PV, typically paid by households on installation, is converted into an annual charge (annuity).11
The algebra of the calculation is expressed mathematically in Eq. (5.1) for retail offers, i, and solar systems, s.
where Bill before solari = Consumption before solar * tariffi –, Bill after solari,s = Consumption after solars * tariffi – Solar exports * feed-in-tariffi, Solar annuitys is the annual charge for solar systems of 1.5, 3, and 5 kW.
The analysis consists of a Base Case which uses the actual feed-in tariffs paid by retailers, and two sensitivities. The sensitivities focus on the effect, in terms of payback periods, to households that install PV. The sensitivities examine the impact of fixed charges in retail offers, and higher feed-in rates on payback periods. Views in Victoria differ on these issues (the size of fixed charges) and feed-in rates. The chapter does not argue the level of these charges and rates, but rather quantifies the impact of changes in fixed charges and feed-in rates on the viability of rooftop PV to households that install them.
3.1. Sensitivity One: Increase Feed-In Tariff by 5 Cents Per kWh
This sensitivity raises the feed-in tariff by 5 cents per kWh. This makes solar more valuable since it increases the value of the electricity exported to the grid. This is expressed mathematically in Eq. (5.2) below:
3.2. Sensitivity Two: Convert Fixed Charges Into Variable Charges and Increase Feed-In Tariffs by 5 Cents Per kWh
This sensitivity assumes that the daily charges in retail tariffs are substituted by variable charges that provide the same annual revenue to the retailer before solar, assuming 4973 kWh annual consumption. This results in the same annual bills (before solar) but the tariffs have higher variable charges to offset the elimination of fixed charges. Eliminating fixed charges makes solar more valuable since it will be displacing higher priced consumption from the grid. This sensitivity is expressed mathematically in Eq. (5.3) below:
where Additional variable charge is the annual fixed charge divided by 4973 kWh; Consumption displaced by solar is the annual residential consumption that has been displaced by solar production.
In this analysis, the typical household consumption before solar is 4973 kWh per year, based on information provided by the Australian Energy Regulator’s “Energy Made Easy” online benchmark tool.12 An hourly annual consumption profile based on the annual and seasonal benchmarks for a four-person household in Melbourne was synthesized. Production by PV for the 1.5, 3, and 5 kW cases is based on The ASHRAE International Weather for Energy Calculations Version 1.1 (IWEC) TMY (20 year) dataset for Melbourne with output calculated using SAM.13Fig. 5.5 shows the profile of demand and PV production used in this analysis.
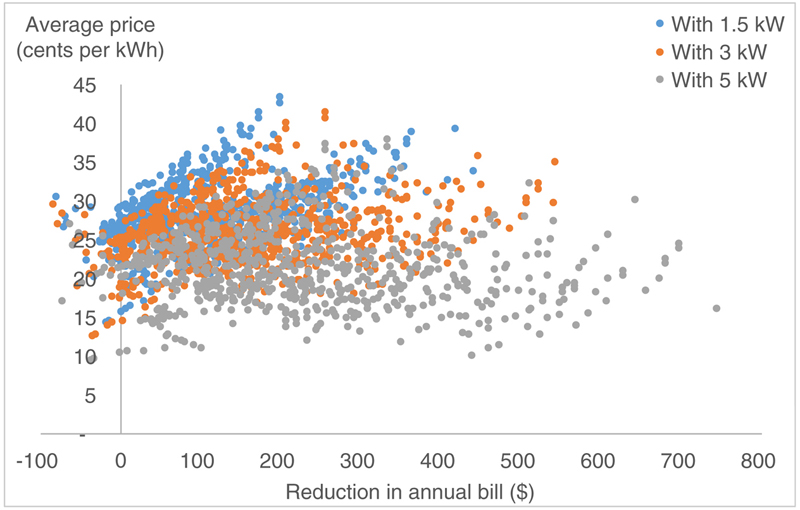
Figure 5.5Reduction in annual bill versus average price before and after 1.5, 3, and 5 kW PV.
The chart shows that for the typical daily profile, a 5 kW PV system (on a north-facing roof) produces more electricity than a household consumes for most daylight hours. The consumption and load profile data before and after PV used to calculate all retail offers in this analysis is shown in Table 5.4. The most significant impact from the installation of a 5 kW system, compared to a 1.5 kW system, is that excess solar production increases from 0.69 to 5.4 MWh per year. By contrast, the grid consumption with a 5 kW rather than 1.5 kW system shows a much smaller change (2.98–3.48 MWh per year) (Table 5.5).
Table 5.5
Consumption, Export, and Load Profile Data Pre- and Post-PV Installation
Presolar
Postsolar (1.5 kW)
Postsolar (3 kW)
Postsolar (5 kW)
Grid consumption (MWh)
4.974
3.482
3.233
2.984
Solar export (MWh)
0.692
2.524
5.426
Flex. Peak (%)
26.1
22
21
21
Flex. Shoulder (%)
10.4
9
8
8
Flex. Off-peak (%)
13.5
19
20
21
Peak (7-day) (%)
73
53
59
58
Off-peak (7-day) (%)
27
47
41
42
Peak (5-day) (%)
52
38
43
41
Off-peak (5-day) (%)
48
62
57
59
Source: SAM [All monetary values are in Australian Dollars (AUD). In November 2016, $1 AUD = $0.72 USD.], authors’ analysis.
4. Results
The purpose of the analysis is to assess the viability of rooftop solar to households. This is quantified as the reduction in annual bills and consequential payback periods.
Fig. 5.5 plots the reduction in the annual bill (on the x-axis) against the annual average price of electricity, after accounting for the annual amortization of the investment in the PV. The scatter shows the effect of different retail offers. Consistent with the diversity of retail offers, it shows that installing PV can lead to a wide range of bill reductions (actually increases in some cases) depending on the households’ offer. This is visible in the breadth of the scatter plot.
Table 5.6 identifies the highest, lowest, and median bill reductions. The size of the bill reduction rises with larger systems, indicating that the saving from displaced consumption and higher grid export more than off-sets the higher cost of the larger systems. This is consistent with the information in Table 5.4 which shows large economies of scale between 1.5 and 5 kW systems. This explains the greater popularity of larger PV systems in contemporary installations in Victoria.
Table 5.6
Summary Statistics on Difference in Bills After PV Installation
Statistic
1.5 kW
3 kW
5 kW
Highest ($)
441
544
744
Lowest ($)
−78
−83
−71
Median ($)
92
118
171
Viability of PV installation can be quantified in terms of the payback period—how long it takes for the cumulative savings to exceed the capital outlays needed to deliver those savings.
Table 5.7 examines the payback period, that is, the relationship between bill reductions and the outlays needed to deliver those reductions.14 It shows that the fastest and median payback period is similar regardless of system size. In other words, the higher cost of the larger PV size is almost exactly offset by the combination of lower grid purchases (when PV production is less than household demand) and higher exports to the grid (when PV production exceeds household demand).
Table 5.7
Summary Statistics on Payback Period (Years)
Statistic
1.5 kW
3 kW
5 kW
Slowest
33
28
19
Fastest
6
7
6
Median
14
14
12
Table 5.8 sets out the results of the sensitivity analysis. It shows the slowest, fastest, and median payback periods in the base case. This is then compared to the first case that the fixed charges in network tariffs is converted into a variable charge; the second case that the feed-in tariff is 5 cents per kWh higher; and the third case that combines higher feed-in rates and the conversion of fixed to variable charges.
Table 5.8
Summary Statistics on Payback Period (Years)
Base case
Fixed converted to variable
FiT 5 cents higher
Fixed absorbed in variable and FiT 5 cents higher
Slowest
19
18
12
11
Fastest
6
6
5
5
Median
12
10
8
7
5. Is rooftop PV a good investment in Victoria?
The structure of electricity tariffs and the level of feed-in rates for grid exports from distributed generation has received considerable attention in Australia (and elsewhere) corresponding to the rise of PV. In Victoria, the Essential Services Commission of Victoria (Essential Services Commission, 2017) suggests that distributed generators do not provide benefits to the distribution networks since there is already excess capacity on those networks. However, in the time-of-use tariffs used by Victoria’s network service providers, the variable charge for network services during peak (day time) periods is around 4 times the rate that applies in off-peak periods. In other words, the network tariffs provide powerful incentives for households (and small businesses) to shift demand to off-peak periods.
Presumably this reflects the network providers’ view that consumption during peak periods when networks are more likely to be congested should attract higher charges. Yet PV that exports energy to the grid during those peak periods and, by superposition, effectively expands network capacity during those peak periods, is not estimated, by the Commission, to provide a valuable service to the distributors and their other captive customers. This view is not universally shared as reflected in some of the accompanying chapters in this volume.
Economic theory on these issues often provides inconclusive advice. Specifically, normative and positive theories of regulation offer quite different perspectives on the appropriate structure of electricity tariffs. For example, contrast the arguments in set out in Hotelling (1938), Littlechild (1975), and Coase (1970). Even normative approaches are inconclusive, for example, contrast Boiteux (1960), Houthakker (1951), and Bonbright (1961) with Vickrey (1985), Laffont and Tirole (1993), and Joskow and Noll (1981). Similarly, in relation to feed-in rates, plausible theoretical approaches can justify a wide range of feed-in rates.
In the context of contentious theoretical approaches to electricity pricing, this analysis has sought to draw out relevant empirical evidence on how profitable PV is to households that invest in it, in the context of the current capacity subsidy, retail electricity prices (and the structure of those prices), and feed-in rates for PV electricity exported to the grid.
The analysis shows that the payback periods vary quite widely depending on the retail electricity offer that the customer has selected. The median payback period is 12 years in the Base Case. The payback period reflects several factors:
• Existing feed-in rates for exported electricity are typically inferior to the average cost of PV. This means exported PV electricity receives a price that is typically below its average PV costs. The value that PV delivers is therefore dominated by its ability to replace much more expensive grid-delivered electricity.15
• Although the marginal price of grid-supplied electricity is much higher than average PV costs, PV only displaces around a third of the typical household’s annual electricity consumption. Therefore though the price difference between average PV costs and variable grid charges is large, the limited volume of displaced consumption undermines the financial benefits that households gain from installing PV. Note also that time-of-use weekend (off-peak) grid prices are much cheaper than prices in peak periods, so that the benefit of displaced electricity on 2 days of the week is lower.
• High fixed charges in retail plans undermine the savings that households accrue from installing solar. Fixed charges are a larger proportion of customer bills in Victoria than in the other retail markets in Australia. They are also higher than appears to be the case in other countries and most states of the United States, which often have small or no fixed charges.
The combination of these factors means that though the average price of solar is significantly lower than the marginal or average price of grid supply, on the median offer, the expected payback period in Victoria is around 12 years.
The sensitivity analysis (on 5 kW solar) quantified the effect of fixed charges and different feed-in rates on payback periods. The analysis found that both of these factors had a reasonably significant impact on payback periods. Raising feed-in rates by 5 cents per kWh reduced payback periods from 12 year on the median offer to 8 years. Converting fixed charges into variable charges in addition to raising feed-in rates by 5 cents per kWh reduces the payback period on the median offer to 7 years.
There are several caveats to this analysis:
• First, the dataset of retail offers included only Market Offers and in addition assumed that in these offers all conditional discounts are received. Market Offers in Victoria often promise large conditional discounts but customers often do not satisfy these conditions. Furthermore the term of those discounts are limited and so after having attracted customers with discounted offers, those discounts are often progressively reduced or eliminated. If we had selected a dataset that included the higher priced Standing Offers or Market Offers in which conditional discounts had not been received, payback periods would be shorter than those reported.
• Second, the dataset of retail offers covers those offers available to new customers or existing customers that specifically request them (and are not prevented from doing so under the terms of their current offers). The actual prices that customers pay will reflect their historic offers. We surmise that in many and probably most cases these prices will likely be higher than the offers the retailers make to attract new customers. In such cases, payback periods will be shorter than reported.
• Third, tracking of retail offers over time shows that many retailers frequently change their offers, sometimes by large amounts.
• Fourth, the approach here assumes that the customer remains on the same offer before and after the installation of PV. Customers that are able to survey the market and select the best offer for them after the installation of PV may be able to reduce payback periods further.
• Finally, as noted, some PV systems are more expensive than others. Had the cheapest rather than the median offer been selected, payback periods would be about 30% quicker, or had he most expensive been selected, payback periods would be about 40% slower.
For these reasons, analysis in this chapter should be updated frequently to track the variation in payback periods as a function not just of the rapid changes in PV costs but also the changing retail offers. We suggest that in all retail markets in which there is a diversity of offers, analysis, such as here will be valuable in properly assessing the relative economics of PV to grid.
Finally, in understanding the situation in Victoria relative to that in other countries, it is interesting to contrast the subsidies paid to households that install rooftop PV in Victoria, with those paid to households for the installation of rooftop PV in the United States. In a recent report prepared for the Consumer Energy Alliance, Borlick Associates (2016) calculates the total subsidy paid to rooftop solar for installations between 3.9 and 6 kW in 15 states in the United States. For 3.9 kW systems, Borlik Associates calculates that these subsidies range between a low of US$ 2.06 per watt (in Georgia) to US$ 9.39 per watt (in California). In Victoria, the total subsidy paid to rooftop PV systems is US$ 0.50 per watt—in other words about one-quarter of the amount per watt in Georgia and about 1/20th of the amount in California.
6. Conclusions
This chapter has examined tariff structures and feed-in rates and their impact on PV payback periods based on the situation in the Victorian electricity market today. It finds that there is a large variance in the payback period for the installation of rooftop PV depending on the retail electricity offer that the customer has selected. The payback period on the median offer is 12 years.
Households can significantly reduce the price they pay for electricity—and affect the viability of their investment in PV—by selecting electricity tariff offers that are most suitable to them. The analysis also found that payback periods are sensitive to retail tariff structures and feed-in rates:
• On the level of the feed-in tariff, the study found that raising these by 5 cents per kWh reduces payback periods on the median offer from 12 to 8 years.
• Converting fixed charges in retail offers into variable charges reduces payback periods from 12 to 7 years.
But a key point that can be taken from this study is that to ensure a comprehensive and meaningful analysis of the economics of PV, it is essential that the range of retail offers is examined. Victoria shows that these vary widely. Similarly wide retail offer variation is seen in other parts of the Australia.
The apparently long payback period in Victoria (12 years on the median offer) and the evidence of continued robust demand for PV installation in Victorian households challenges the conception that short payback periods are needed to ensure demand for rooftop PV in residential applications.
The apparently long payback period also challenges the notion, expressed by some commentators in Australia, that residential solar uptake is providing windfall gains for households that install solar. Mountain and Szuster (2014) dispelled this notion during the period in which rooftop solar received generous policy support. This analysis suggests that the conclusion remains valid in the period since policy support has substantially diminished.
Since the average price (measured as the Levelized Cost of Electricity) of electricity produced by rooftop PV is approximately comparable to the typical feed-in rate, but significantly below the variable price of grid-supply, there are powerful incentives for households with PV to maximize consumption when the sun shines, or to invest in storage capacity that will allow them to shift production and thereby extend their gains from PV production. This explains the high levels of interest in battery storage in Australia.
This study has not attempted to examine the economics of distributed battery storage for new customers (with or without PV) or for the addition of storage for those households that have installed PV. An initial examination of this in South Australia (Mountain, 2016) suggests that the combination of PV plus storage will reduce electricity bills even for households that are able to access the cheapest grid-supplied electricity. It will be valuable to extend this analysis to Victoria.


 (5.3)
(5.3)