New technological developments have rendered traditional tariff structures obsolete and may induce socially undesirable decision-making. On the other hand, they also bring their own solution, in the guise of advanced tariff structures made possible by smart meters. The main goal of this chapter is to propose such a dynamic, “real-time” access tariff methodology. It is motivated by recent developments of Spanish regulations, although the issues are relevant for other systems. The proposal efficiently incentivizes distributed generation and storage deployment, as well as Demand-Side Response.
Keywords
access tariffs
smart meters
distributed generation
prosumers
demand-side response
Spanish tariffs
1. Introduction
Since its inception more than one century ago, the electricity supply industry has undergone quite dramatic changes. New generation technologies have been developed, higher and higher voltage transmission lines built, and regional power systems have grown and merged to become national and, of late, transnational ones.
However, there are aspects in which the industry has been markedly conservative, namely, how consumption is measured and how consumers are charged. For one century, consumption meters have overwhelmingly been disk induction ones. They are cheap, reliable, and robust. Customers charging have consequently been based on the energy metered by the device at regular intervals, usually 1 or 2 months. Other simple load characteristics, such as the contracted power, have been used as well.
Historically, such techniques worked well, and it is important to understand why. Lack of sophisticated technology (smart meters) explains why flat, volumetric tariffs have been the norm, even if it has been always known that supply costs were different for different times of the day and of the year. On the other hand, it has also been rightly assumed that generally customers response was quite limited. Moreover, customers belonging to specific categories (e.g., residential urban consumers) displayed quite similar consumption profiles. As a consequence, volumetric charging did not induce inefficient behavior, and it allowed reasonable cost allocation. Management cost was also low. In any case, some customers that might exhibit significant flexibility or peculiar load profiles (e.g., some large industries) might also enjoy more complex meters and more sophisticated tariffs.
Technological advancements have put an end to this world. Distributed generation, storage, and automatic demand response means that customers response might be significant, and that they can shape their consumption profile, possibly becoming very different of the typical in their consumers’ category (Perez-Arriaga and Bharatkumar, 2014). These new technologies offer opportunities to the power sector, as consumers’ investments may advantageously substitute network or generation investments. This is particularly relevant as massive energy restructuring efforts are being made to decarbonize the economy.
Increasing tension between these new technologies and traditional tariffs is already evident, as described in a number of chapters in this volume. Quite often it arises because of the mismatch of volumetric tariffs and the network capacity-driven costs. Network costs do depend on the energy transportation capacity (kW) they have. The costs do not depend very much on the energy (kWh) that the network actually carries. If all, or at least most of the customers have similar consumption patterns, consumed energy can be a good proxy of the capacity demands put on the network (double the energy, double the required capacity). On the other hand, if consumption profiles are very different, consumed energy is no longer a good proxy. For instance, a constant load of 3 kW during all the day long amounts to an energy consumption of 3 * 24 = 72 kWh/day. The network capacity it requires is the maximum demand, namely 3 kW. Another load of 6 kW from 4:00 to 10:00 p.m. and nothing during the remaining hours requires 6 kW of network capacity but only consumes 6 * 6 = 36 kWh/day. Under volumetric tariffs the latter would pay half as much for network access as the former, being the actual network use twice as higher.1
In some jurisdictions, network costs have been met by charging the customer maximum capacity. This has been easy, as consumers are usually endowed not only with an energy meter, but also with a switch that opens the feeding circuit whenever the energy flow (power, kW) surpasses the switch rating. In the example above, the first customer would ask for a switch rated slightly above 3 kW, whereas the second one will need one above 6 kW. By charging customer maximum capacity, as provided by the switch-rated power, both customers would pay their fair share of network costs.
The problem with this approach has to do, again, with different load profiles. For instance, compare the previous customer demanding 6 kWh from 4:00 to 10:00 p.m. with another one that also demands 6 kWh for just 6 h, the difference being that the demand is now shifted from 1:00 to 7:00 a.m. Switch-rated power should be the same one, and both customers would pay the same amount under a maximum capacity tariff (incidentally, also in a volumetric or mixed tariff). But the new customer only imposes her load during a period when the network is largely unused. The load shifted to the small hours will not require new network investments, neither explains former network investments aimed at meeting peak load. Therefore it is neither efficient nor fair to charge the valley hours consumer so much as the peak hours one.
The moral is that time is of the essence. In order that consumers behave in a socially efficient manner, they must receive time varying signals reflecting actual network use. As explained below, failing to do so not only wastes a wonderful opportunity but it can paradoxically lead to an energy transition more expensive than the one if distributed technologies were not available.
Many, if not most, of this chapter’s themes and conclusions are by no means unique (see, in particular, MIT, 2016). The authors’ position has grown out from their work dealing with Spanish regulations. Therefore, the chapter focuses very much on the Spanish system. However, the matters it deals with are of interest for systems other than Spain. One reason is that Spain (a sunny and windy nation) is already acutely facing problems that will shortly become widespread in Europe and the world. Serious regulatory mistakes have been made, but there are also some success stories, as explained in chapter by E. Álvarez Pelegry in this volume. The study of both failures and successes might be useful in other jurisdictions.
The balance of chapter is organized as follows. In Section 2 the structure and amount of end prices for residential consumers is described. Section 3 describes in detail the hourly energy tariff already enacted in Spain, the so-called PVPC tariff. Section 4 proposes a general methodology to extend the hourly PVPC energy tariff to the regulated domain, yielding an hourly network tariff. Next, Section 5 is a case study based on actual Spanish data to get a feeling of the outcome of the proposed methodology, although it is not intended as an actual proposal to be implemented. Section 6 discusses the advantages of the new tariff from the point of view of the energy transformation, followed by the chapter’s conclusion.
2. How much and what for residential consumers pay?
Spanish residential electricity bills include both market and regulated terms. The market term comprises the cost of the energy purchased by the suppliers in the wholesale markets and sold to the final consumers, as well as other system services acquired in the wholesale markets (balancing and ancillary services). Energy at the connection point should be hourly metered. In case that no hourly metering is available, profiling is used.2 This is a transient solution, as smart metering deployment should be finished by 2019. The supplier has the duty to purchase the metered energy, as corrected by loss factors computed by the System Operator, in the wholesale markets. The contractual conditions between suppliers and customers for the energy and energy services provided can be freely established. However the regulation establishes a fall-back, “PVPC tariff,” that residential consumers are entitled to request. The PVPC tariff3 is a pass-through of hourly energy prices plus regulated terms, as described below.
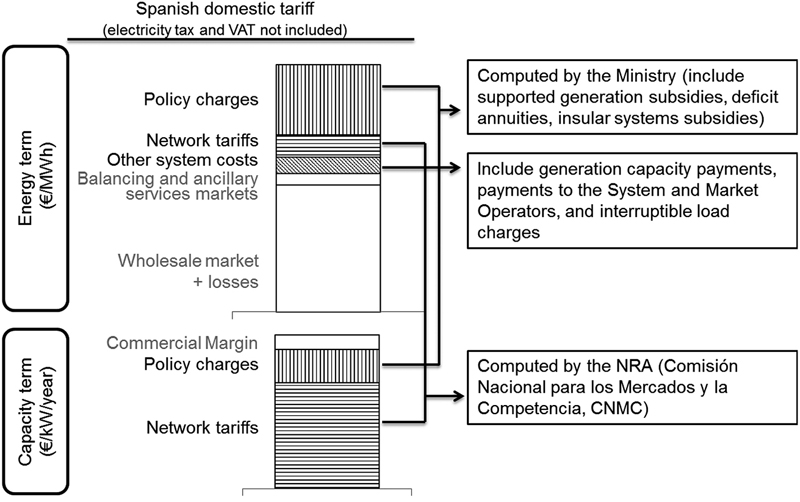
The regulated term is also known as the access tariff. It includes network tariffs, intended to cover the network, a plethora of smaller regulated charges (mainly generation capacity payments, the cost of the Regulatory Agency and the System Operator, and others), and policy charges (mainly, but not only, renewable support charges and tariff deficit annuities4). The tariff structure is binomial: there are an energy term (€/kWh) and a capacity term (€/kW) with values conditional to the voltage connection level. Inconsistently, these terms are not hourly ones. The energy to be used is the aggregated monthly consumption. The power to be used is the contracted power that the consumer cannot exceed. There is the possibility of time-of-use tariffs up to three periods, conditional to the energy consumption and other characteristics.
The National Regulatory Authority5 computes the network tariff. It is mostly paid through a capacity €/kW term, being the rational that network costs are mainly driven by the peak load to be served, and not by aggregated energy consumption. On the other hand the policy charges are established directly by the Spanish government. Most of them are charged as energy €/kWh payments, although the capacity €/kW term is also significant.
Fig. 12.1 shows the electricity bill for an average consumer who has requested the PVPC tariff. The size of the bars is proportional to the monthly euro payments. The market terms are hollow and the regulated terms dashed. Horizontally stripped bars are used for the network tariff (mainly network costs) and vertically stripped bars for policy charges (mainly subsidies). The diagonally stripped bar includes a number of additional regulated supply costs. In the sequel they will be ignored.
Figure 12.1Residential electricity bill breakdown.(Source: Ministry of Industry, own elaboration.)
3. Hourly payments: the fall-back tariff (PVPC)
Residential consumers can freely contract with their suppliers the terms under which the energy and ancillary services are acquired. However they are entitled to the specific regulated PVPC tariff that acts as a reference. Supply under the PVPC tariff must be provided by a small number of “reference retailers” (comercializadores de referencia).6
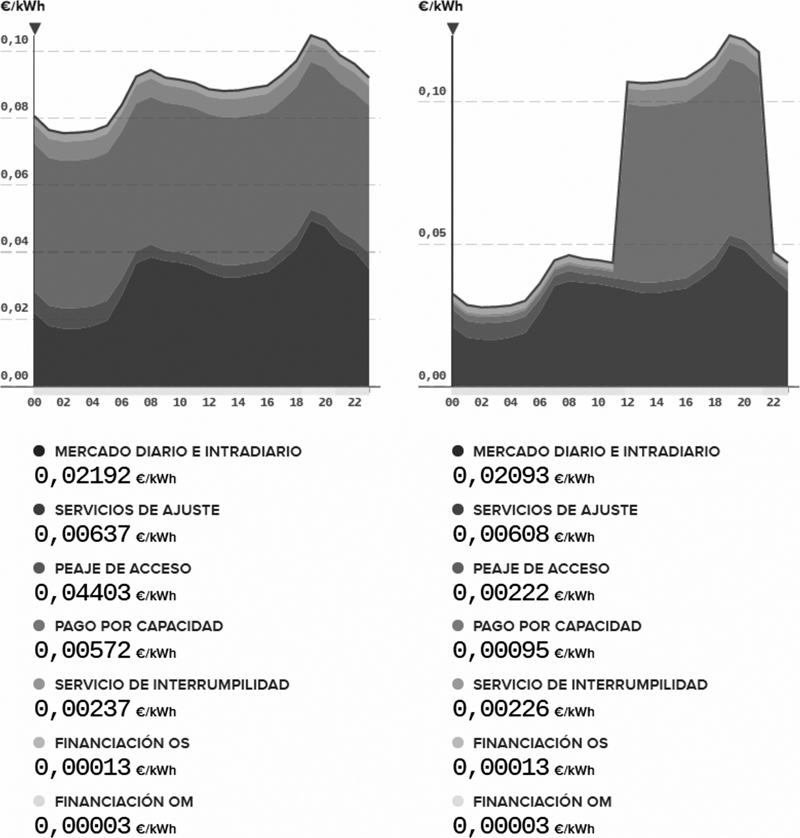
Since January 2014 the reference suppliers pass-through the hourly energy price as computed by the Spanish TSO, Red Eléctrica de España.7 To the time-changing energy price, a regulated commercial margin, network tariffs, and policy charges are added up. The resulting price is the PVPC. The PVPC is published the day before, after the closing of the day-ahead market, but before that intraday prices and ancillary services prices are known. Therefore, these last components must be estimated by the TSO. The different prices are weighted according to the value of the energy or services traded in different markets. As most of the liquidity is in the day-ahead market, deviations from the “legal” estimated PVPC from the “optimal” real PVPC are quite small. Fig. 12.2, a snapshot taken from the TSO website, shows the PVPC on a specific day, namely February 10th, 2016.
Figure 12.2PVPC (fall-back tariff), February 10th, 2016. Translation: Mercado diario e intradiario, daily and intraday markets; Servicios de ajuste, ancillary services; Peaje de acceso, access tariff; Servicio de interrumpibilidad, payments to interruptible loads; Financiación OS, payments to the SO; Financiación OM, payments to the MO. Numbers are average prices. Note the different vertical scales.(Source: Red Eléctrica de España (Spanish TSO) esios system, https://www.esios.ree.es/es/pvpc?date=10-02-2016.)
The curve at the left is the one of the standard PVPC 2.0A tariff, whereas the one at the right corresponds to a two-period time-of-use PVPC 2.0DHA tariff. Note that the energy and ancillary services prices are the same ones for both tariffs, being the difference the way that the regulated charges are added: constant along the day or in two periods. For each hour a number of market prices must be added: the day-ahead price, up to six intraday market prices, and several ancillary prices. Therefore, the monthly price results from an average of thousands of prices. It should be stressed that even if some information technologies concerns were aroused in the past, this kind of billing is perfectly feasible and actually carried out on a regular basis.
Obviously this scheme is dependent on the feasibility of hourly metering. Smart meters rollout in Spain is well advanced and should be completed by the end of 2018.8 Official statistics state that 14.49 million out of 28.09 (51%) had already been deployed by December 2015 (CNMC, 2016).
4. Toward an efficient access tariff
The PVPC market energy term conveys hourly wholesale prices that reflect time-varying generation costs. Therefore this term incentivizes efficient behavior of the system users; not so the regulated terms. There are issues both with policy as well as with network charges.
Regarding the policy charges, there are several matters to consider (Newbery, 2015; Batlle, 2011). First it must be decided which part, if any, of these policy charges should be paid by the electricity consumer. For instance, presently about half of the insular systems subsidies are paid out from the State budget as they are considered to be State territorial policy. It is arguable if other subsidies, especially those to RES and CHP, should be paid in the same way as they arise from industrial or climate policies. On the other hand, the proceedings from the auctioning of carbon emission allowances are kept in the State budget. There is a case to share policy charges with other energy carriers, such as transportation or heating and cooling, if only to avoid economic distortions and implicit incentives to less efficient and dirtier alternatives (e.g., diesel vs. electric cars, or fuel-oil boilers vs. heat pumps heating).
In any case it seems very likely that a great deal of policy charges will continue finding their place in the electricity bill. These costs are unrelated to consumption patterns. A fixed monthly customer charge (€/month) seems the better way to reflect the underlying economics. The recourse to this kind of charges to pay for small supply costs (e.g., billing or metering) is usual in many US jurisdictions. However they are unknown in the Spanish context and unusual in the European one. Therefore, a power charge (€/kW) might be a preferable second-best, although it may induce inefficient storage investments.
On the other hand, network tariffs are the main regulated procurement costs. They are intended to pay for capital-intensive assets: variable cost is indeed comparatively very low. As a consequence, economic theory establishes that optimal signals are provided by low prices when network capacity is not binding and higher prices when it is.
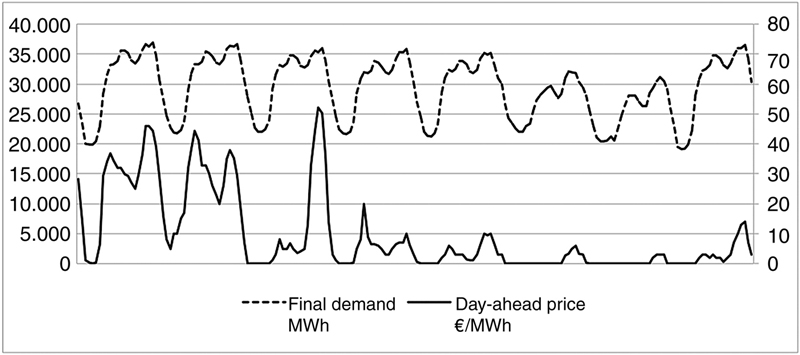
Energy prices are not a good proxy of network use. Moreover, they will be increasingly bad as intermittent RES penetration does increase. Total demand can be considered as a much better proxy for the use of the network, as flows are roughly proportional to it. Fig. 12.3 below shows demand and day-ahead market prices during the week from February 3rd to 10th, 2014. It is noteworthy that during this period peak load was almost attained and, consequently, network use was arguably close to or at its peak value. On the other hand market prices were very low, as wind generation was extremely high.
Figure 12.3Hourly final demand (MWh, upper line, left hand scale) and day-ahead market prices (€/MWh, bottom line, right hand scale) from February 3rd to 10th, 2014.(Source: Red Eléctrica de España, own elaboration.)
All of these, points out that network fee methodologies need to be updated to faithfully reflect actual network use in a world with massive intermittent renewable and distributed resources deployment. Some of the most relevant issues are addressed in “Bringing DERS into the mainstream …” by J. Baak and “Access rights and consumer protections …” by F. Orton et al., both in this volume.
In any case, it can be argued that the marginal cost of the network is a good starting point to discuss what the optimal price signal should be. It seems sensible to focus in the long-term marginal cost. Under idealized circumstances in equilibrium short- and long-term marginal costs should be equal. However, that requires, among other things, taking fully into account reliability constraints, which is already a daunting task. Moreover, room must be made for assets indivisibility and other issues.
However, there are two serious drawbacks with marginal cost use, even if long-term:
• First, long-range marginal costs are notoriously difficult to compute. Their estimation requires very complex and not very transparent network expansion models (Mateo Domingo et al., 2011; Jamasb and Pollitt, 2008), difficult to check. Among other effects, that makes the tariffs derived from these models vulnerable to judicial or regulatory challenges.
• Second, and arguably more importantly, long-range marginal cost tariffs do not guarantee cost recovery. Total proceedings may be above or below acknowledged costs, even if only because of unavoidable errors in the planning procedures. In any case it is a rising concern as investments in new technologies of uncertain costs and impacts increase.
However, long-term marginal cost figures carry out two important messages: they sharply increase when the network capacity is approached, and the main variable that explains them in each moment is the power flowing through the network.
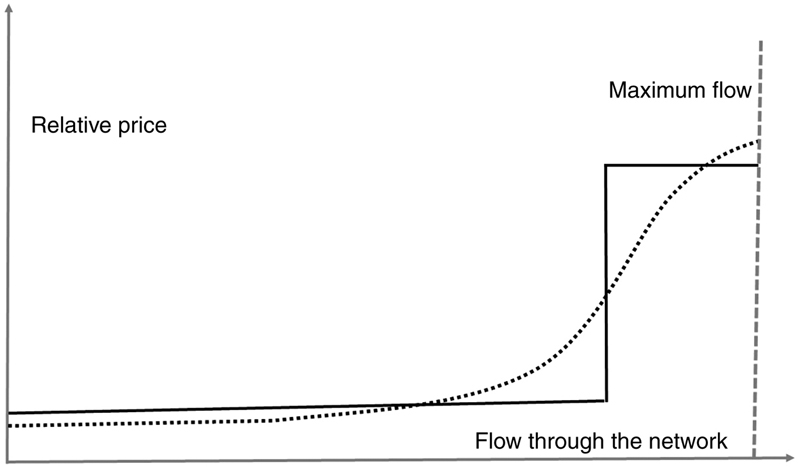
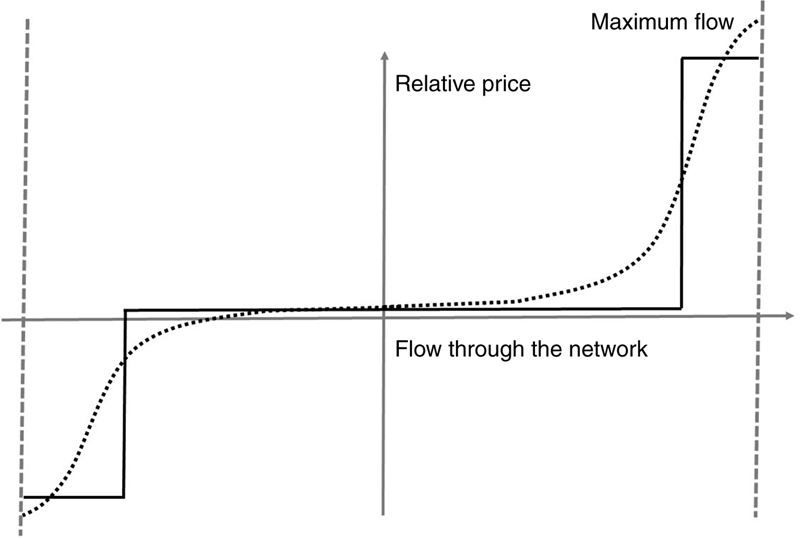
The proposed approach is, in a nutshell, that the Regulator will provide, after consultation, a formula or curve to the System Operator to compute hourly network charges from the flow through the network (Fig. 12.4). The curve shape will approach as best as possible long-term marginal costs, as it guaranties cost recovery.
Figure 12.4Shape of an ideal network tariff curve based on long-term marginal costs (dotted) and a stepwise approximation (solid).
In particular, the proposed network tariff will sharply increase when network capacity is approached. The network tariff is time-changing, but not in a preset manner (e.g., higher on all working days from 5:00 to 10:00 p.m.). It rather fluctuates, as the wholesale market energy prices, according to the system operating conditions.
A specific consumer possibly makes use of several networks. For instance, a residential customer makes use of her low-voltage local distribution network, the medium-voltage regional network, and the transmission network. It is proposed to apply the approach to each network separately, and then add up the tariffs for all the networks the consumer makes use of.
The curve relates energy flow, that is power (kW), to a price. Ideally, every moment, every second, consumed power should be metered and charged. This is clearly not feasible, neither needed nor useful. It is not feasible because of obvious equipment limitations. It is not needed because network flows do not change dramatically from second to second. And it is not useful because consumers response from second to second is not to be expected. Rather, a convenient time granularity should be used. In most places, including Spain, current market arrangements strongly suggest hourly aggregation. In this case, network tariffs do refer to average energy flow or power during each different hour. Numerically this happens to be the same figure as the energy consumed during that hour (if average power from 1:00 to 2:00 p.m. was 2 kW, this implies that energy consumption from 1:00 to 2:00 p.m. has been 2 kWh). This is why network tariffs are quoted below as €/kWh and can be aggregated to hourly energy prices. However it should not be forgotten that conceptually network charges are not an energy charge.
Rather than providing a complex curve derived from long-term marginal estimations, it might be more practical, and possibly no more inexact, to use a simplified curve, for example, a stepwise function. This has been actually the case in the case study described in the next section. In any case, as the curve reflects long-term costs, it includes the impact of future distributed resources if rightly forecasted. Of course, forecasts are rarely accurate. This is a reason why the Regulator must update periodically the curve (e.g., every 3 years). The approach can be extended to deal with disruptive levels of distributed generation and complex network topologies, and is explained below.
5. A Spanish case study
The goal of the case study is to provide a feeling of the outcome of the methodology sketched above in a real case, that of the Spanish system.9 The starting point is the acknowledged network costs as published by the Ministry of Industry.10 Network acknowledged costs are provided by voltage level. This information as well as yearly total energy flows are shown in Table 12.1.
Table 12.1
Acknowledged Network Costs and Flows by Voltage Level
Voltage level
Millions of €
Power flow (TWh)
NT4 V > 145 kV
2499
233.58
NT3 72.5 kV < V < 145 kV
454
206.51
NT2 36 kV < V < 72.5 kV
477
190.88
NT1 1 kV < V < 36 kV
2243
175.57
NT0 V < 1 kV
1769
100.52
Total
7342
Source: Spanish Ministry of Industry (see footnote 10).
Ideally, networks should be geographically differentiated. For instance, network use patterns in tourist areas, such as the Costa del Sol is very different from those in industrial areas, such as the Barcelona metropolitan zone. However such data were unavailable from the Regulator, so the aggregated data by voltage level were used instead. Even so, at the end of the day, there is a much improved price signal as shown below. Power flow through a network comes from the final net consumption (consumption minus self-generation) of the customers connected at the network plus the net demand of users connected to lower voltage networks, as corrected by suitable loss factors.
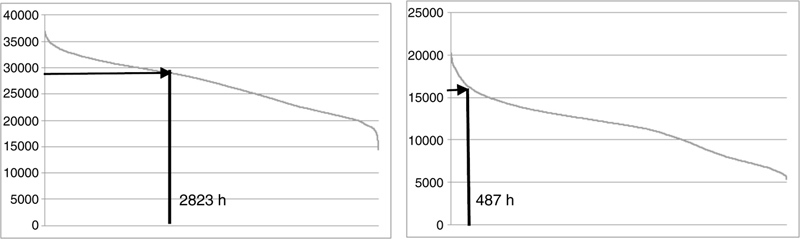
There are also official data on electricity consumptions. Monotonic curves of power flowing through low (NT0) and high (NT4) voltage level networks are represented in Fig. 12.5. Note that the high-voltage curve is flatter than the low-voltage one. Intermediate voltage levels (not shown) take also intermediate positions.
A two stepwise approximation to the long-range marginal cost is used (Fig. 12.4). Derivation of this curve is a very complex task that would require developing new tools and methodologies. However it was felt that setting a demand threshold of 80% of the peak load could result in a sensible approximation. The threshold is represented in Fig. 12.5. In the high-voltage network, flow during 2823 h was above the 80% demand threshold. In the more peaky low-voltage one only 487 h were above.
To fix the relative height of the two periods, it was decided that 90% of the network costs should be recovered during the peak hours, as this is roughly the proportion of expenditures required to serve peak demand over total expenditures. So, for the low-voltage network, 90% of €1769 million (Table 12.1) must be recovered during the 487 h of peak network flow. Total flow during these peak hours happens to be 8.53 TWh, about 8% of total low-voltage demand. As a consequence, to recover all the network costs, a price of 1.76 €/MWh must be charged during valley hours, and a much higher price of 186.75 €/MWh during peak hours. For the flatter high-voltage network the figures are 1.07 and 24.57 €/MWh. Note that a flatter curve translates in a smaller peak/valley price ratio.
Each network user must pay for all the networks he makes use of. The charges should take into account T&D losses. So, a consumer connected to the high voltage only pays 1.07 €/MWh in valley hours and 24.57 €/MWh during peak hours. On the other hand, a consumer connected to the low-voltage network NT0 must also pay for the NT1–NT4 voltage networks, as consumed power flows also through this networks. The average loss factor from high to voltage level is 12.07%. So, a NT0 customer will be charged 1.07 * (1 + 0.1207) = 1.20 €/MWh for the high-voltage network during valley hours and 24.57 * (1 + 0.1207) = 27.54 €/MWh during peak hours. Similar figures should be derived for intermediate voltage levels. These computations should be performed for each hour, taking into account that a specific hour might be a peak hour for the high-voltage level but a valley hour for the low-voltage network or the other way around.
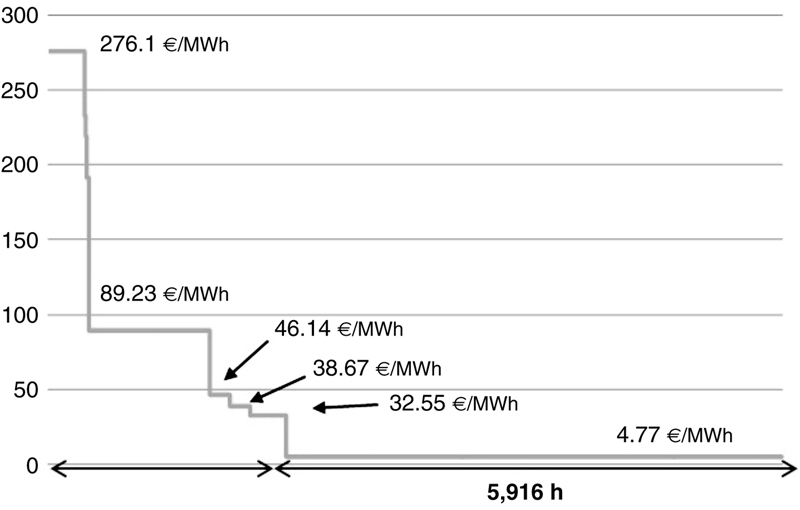
Fig. 12.6 shows the network tariff—duration monotonic curve for a user connected to the low-voltage network. Note the high network tariff of 276.1 €/MWh that results from simultaneous peak charges in all network levels. Incidentally, it also illustrates the high correlation among peak hours of all networks. Note also the very low valley network tariff (4.77 €/MWh) that prevails during 5916 h.
Figure 12.6Monotonic network tariff curve.
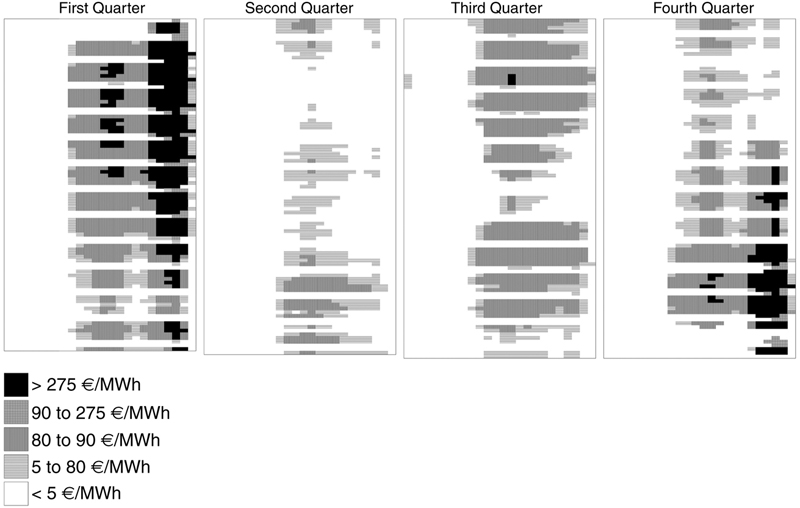
As said above, the network tariffs are hourly ones. Fig. 12.7 shows a heat map of the low-voltage tariffs along a year. Note the high network tariffs during winter weekdays evening hours, and the low values prevalent during the small hours and the more template seasons.
There are no great technical barriers to implement these tariffs. The regulator might periodically (e.g., every year) publish the different network tariff curves computed according to a publicly known methodology. The curves relate flow through a network with the network tariff. At the time of publishing the PVPC tariff, the TSO not only knows the day-ahead market price and has accurate forecasts on the intraday and ancillary services prices, but also has accurate forecasts of the network flows. Consequently the TSO would be able to publish a new “PVPC tariff” by using hourly network tariffs. It is important to point out that no additional investments or equipment beyond those required by today’s PVPC tariff are required; it is just a matter of regulatory reform.
Both the Regulator and the TSO forecasts are likely to be mistaken at some degree, and as consequence there will be a mismatch between the income of the network tariffs and the acknowledged network costs. However this problem also arises presently; there is no reason to assume that it is going to be more serious, and in any case can be addressed by the same mechanism (namely, by rolling out deficits or surpluses to the acknowledged costs of the following period).
6. Is it worth? Network tariffs and decarbonization
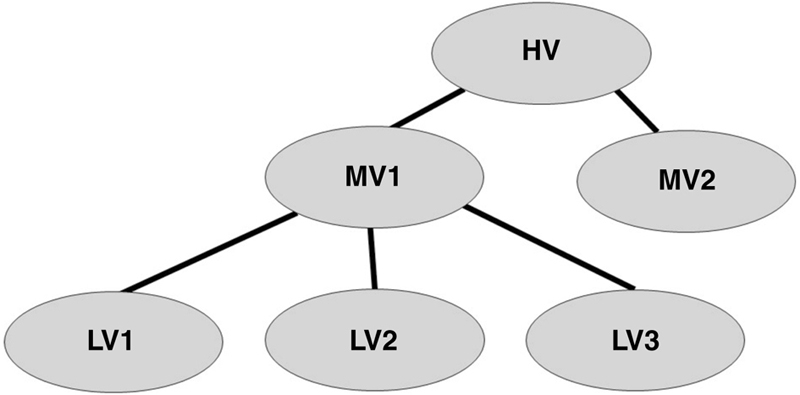
Note that there is nothing special about the “cascaded” structure considered in the example (a low-voltage network feeding from a medium-voltage one and so on). For instance, in the system in Fig. 12.8, a low-voltage LV1 consumer would pay the network tariffs computed for networks LV1, MV1, and HV, that is, the networks she makes use of. Network tariffs must naturally take into account proper loss factors. Solutions can be devised even for meshed, nontree networks. It is only required to define a proper metric of network use, such as the average participation method. However this sophistication does not seem needed.
Figure 12.8Different networks of a power system.
The tariff network above described solves a number of relevant problems and can actually efficiently promote low-carbon generation penetration as well as other technologies. The remaining of this section deals with some of the issues.
• Self-consumption
Badly designed self-consumption regulation can induce cross-subsidization because of two reasons:
1. It may be a way to avoid policy charges. By just charging on the basis of net consumed energy, policy charges are avoided on gross consumption. As policy charges do not reflect supply costs but they rather are quasitaxes to be levied from the system users, policy charges are shifted from prosumers to the remaining consumers.
2. It may provide a way to effectively sell energy at a price higher than its value. By exchanging possibly low-cost energy (both in terms of energy proper as well as network use) generated during sunny hours for high-priced energy in evening hours prosumers may obtain higher benefits than the value they provide.
In some jurisdictions, as in the United States, the second effect seems to be the dominant one as explained in chapters by Sioshansi, Jones et al., and Baak. In the high policy charges Spanish system the first effect is the most important.
Being more specific, in Spain, network costs are mostly paid through capacity (kW) charges.11 Therefore investment in residential PV facilities does not affect very much the network payments, as prosumers’ peak load is not much affected (it usually takes place after sunset). Besides, the prosumer pays the net hourly consumed energy at wholesale prices (see PVPC description above). In other words, from the point of view of energy and network charges, the customer can be thought as a sort of “black box.” Only net hourly energy consumption (consumption minus self-generation) and peak demand are relevant here. No significant cross-subsidization is likely to arise.
However, a serious policy charges problem do remain. They are mostly volumetric (monthly kWh). For traditional consumers, the charges can be thought of as a quasitax on volumetric consumption. To ensure that prosumers also fully pay this quasitax, net energy consumption must be separated in consumption proper and self-generation. Otherwise self-generation benefits from a fiscal opportunity benefit (namely, quasitax avoidance because of substitution of taxed energy supplied by the system with self-generation of quasitax-free energy). This requires, in turn, metering of load proper or of self-generation (load can be estimated as net energy consumption plus self-generation). Therefore, setting meters inside the customers’ premises is required. This is problematic from a legal or commercial viewpoint. In any case small residential prosumers are not currently required to fully pay the load policy charges.
Most of the Spanish PV developments are industrial-scale ones. This seems intuitively right, as industrial scale PV is typically significantly cheaper than small residential one. It also suggests that in some jurisdictions where residential PV is fast growing, the reason may lie in volumetric network or policy charges, that artificially enhance distributed PV attractiveness and have the potential to create significant cross-subsidization.
In any case, the use of the hourly energy and network tariff provides the right economic signals. This is very important if massive distributed PV deployment is expected. On one hand end prices should incentivize preferential deployment in sunny places. The energy term in the end prices address this issue. On the other hand, to excessively load networks in sunny places should be avoided, to defer or to avert expensive reinforcements. The network charges are to take care of that. Obviously the whole network must be divided into suitable regional ones: a single national distribution network price is clearly unable to provide optimal signals. As stated above, the proposed methodology can easily accommodate this requirement. Final outcome should be a cheaper and more efficient PV generation deployment.
Ultimately, it might be the case that for certain areas and periods distributed generation outstrips consumption. These areas would become net power exporters. The proposed methodology can easily accommodate these developments. For instance, let us consider the admittedly extreme long-range marginal cost curve depicted in Fig. 12.9, analogous to Fig. 12.4.
Figure 12.9Shape of the long-term marginal network cost (dotted) and a stepwise approximation (solid).
Positive flow denotes net consumption and negative flow denotes net generation. Marginal costs are negative when the region is exporting power, as additional generation (that is a decrease in the flow through the network) entails additional cost. As a consequence, network tariffs should be negative in this regime. Revenues will be positive, as they are the product of negative prices times consumption, that is also negative (more generation than load). Among other effects, these tariffs should incentivize local demand, aligning it with local distributed generation.
• Storage and joint consumption
Massive intermittent RES deployment will be greatly facilitated by storage deployment as further described in a few chapters in this volume. As in other technologies, there is a choice to be made between centralized and distributed storage. Centralized storage benefits from scale economies and possibly better control. Decentralized storage can reduce network investment costs and losses, although it can also increase them if deployed in the wrong places and operates under wrong price signals. Possibly more than any other technology, storage requires time-varying prices to properly operate (i.e., to store energy during low-price periods and to release it during high-price ones). The network component of the hourly price embodies the implied network savings, and it is therefore the main signal that bias investment toward centralized or decentralized solutions.
In addition to the network tariffs, policy charges are also quite relevant when discussing storage, as suggested above. If policy charges are paid through energy (€/MWh) there is an undue incentive toward self-generation, as self-generation might save a prosumer part of these charges without contributing any social good (other consumer will pick up the charge). If policy charges are paid through capacity (€/MW) there is a parallel undue incentive to install batteries or other storage facilities to decrease contracted power beyond the point justified by network savings.
There is an additional problem related to capacity tariffs. Maximum power demanded by two or more consumers jointly will be typically less than the sum of the maximum power demanded by each one, as simultaneous maximum consumption is unlikely. Therefore, if policy charges are paid through capacity prices (€/MW) there is an incentive to jointly contract the supply. This is plainly inefficient, as revenues are reduced without a change in consumption patterns. Customer charges (€/month) to pay for policy charges, on the other hand, can be set in such a way to avoid these aggregation issues (e.g., by making them proportional to the served properties’ values).
• Demand-side response and electric vehicles
Intermittent RES deployment implies that there will be periods when energy and network costs are likely to be very low. In these periods electricity consumption is economically sound even if electricity conversion efficiency is low. For instance, in a cold windy night, network use might be low and marginal cost of electricity very low as well. Therefore electric heating by low-cost heating rods is to be preferred to natural gas heating, especially if wind energy spillage is likely. Just this kind of switching may save significant amounts of carbon (Heinen et al., 2016). Presently there is no private incentive to procure this kind of equipment, as constant and relatively high network tariffs do not render electricity competitive along the day. Of course more efficient electric equipment, such as heating pumps might be considered and be found competitive, especially if policy charges are reduced.
Electric vehicles offer a way toward transportation decarbonization, so far as the implied power system is not coal dominated. They also bring important benefits related to local pollution in cities (specially NOX, SO2, and particulate matter emissions). From the power system viewpoint, the most significant integration costs are not the energy ones but the distribution network ones. This is because electricity cars’ energy consumption is much lower than that of petrol cars, but their widespread use can significantly increase flows in the owners’ distribution networks (see “Powering the driverless electric car of the future” by J. Webb and C. Wilson in this volume).
In that sense, electric vehicles’ smart charging is just another demand-side management measure (Eid et al., 2016). In order not to overload distribution networks, cars’ battery charging during peak residential consumption must be avoided. It can be seen from Fig. 12.7 that network tariffs are very low during night hours, so a natural incentive to defer loading up to the small hours is already present. Whether the incentive is enough to further invest in vehicle to grid equipment can be also assessed from the hourly changing energy prices and network tariffs.
7. Conclusions
Smart meters rollout is already a reality in Spain. Presently they are used to confront the customers with the hourly changing energy prices of the wholesale market. Moreover information and billing systems are able to handle hourly changing network prices as well. Hourly network tariffs barriers are, in short, no longer technical ones.
This chapter proposes a specific methodology to compute hourly network tariffs. It is further argued that by approving such tariffs, efficient self-generation, storage, and electric cars deployment are incentivized.
There are other issues that are possibly relevant. First, the proposed approach allows the Regulator to focus in his traditional role of assessing the cost of the regulated assets and make sure that the distributors recover their cost and a fair return. In other words, it frees him from the duty to establish the social value of facilities indoors the consumers’ premises and to compare with the value of regulated or even market assets. Computation of network costs and tariffs does not and should not require such information.
Policy charges, either subsidies to be granted to specific technologies, territorial compensation measures, or whatever, should be established by a different process, possibly also by a different agency. They should be clearly charged as such, either to the electricity or energy consumers or to the taxpayers. Charging should interfere as little as possible with efficient energy and network use signals.
Fair cost allocation is also an important matter of increasing social saliency. As discussed above, inefficient network tariffs can create cross-subsidies from traditional consumers to prosumers, who often are more affluent customers who live in properties spacious enough to set PV facilities and have the financial resources of doing it. Similar issues might arise as electric cars, batteries, and other distributed equipment are deployed. Efficient network tariffs are usually much fairer than the alternatives, as cross-subsidization is avoided. They also generally empower all consumers, who can see as changes in their behavior translate into billing savings.