Chapter 14. Debugging LightSwitch Applications
Debugging enables you to look for errors and analyze the application execution flow over the state of objects. Therefore, it is one of the most important activities for every developer. Debugging is the step of the development process that ensures the application contains and causes no errors and precedes the deployment of the application to production. The goal of the LightSwitch development environment is to avoid any errors with all the “coding optional” and design-time features; so, every time you make a change, all the related code and screens are automatically updated for you.
In LightSwitch, you write the business logic code, such as custom validation, custom queries, and so on. So, when writing code, you might make mistakes or you might encounter problems that must be solved. With regard to this, Microsoft Visual Studio LightSwitch inherits from Visual Studio 2010 most of the powerful debugging tools available. Therefore, if you have experience in debugging with Visual Studio 2010, you will find the tools in LightSwitch to be familiar.
In this chapter, you learn about the debugging instrumentation in LightSwitch in detail, and you also learn how to make your code better interact with the debugger. Upon completion of this chapter, you will be able to solve any errors in your code and to produce high-quality applications.
If you run Visual Studio 2010 Professional or higher with LightSwitch available as an add-on, you have a few more debugging features. For the sake of consistency between this scenario and the one in which Visual Studio LightSwitch runs as a standalone environment, only tools from this IDE are explained.
Debugging Applications
What you can debug when developing LightSwitch applications is the code you write. In other words, you cannot debug the autogenerated code. This makes sense, because you cannot generally access such code or modify it. So, this chapter explains how to debug your code by taking advantage of the most powerful tools offered by the IDE.
To start debugging LightSwitch applications, you simply press F5. At this point, Visual Studio LightSwitch runs your application and attaches to it an instance of the debugger. Generally speaking, a debugger is specialized software that analyzes another program and provides information about errors occurring in the analyzed application at runtime. Debuggers usually show error information and the source code referring to the error. Visual Studio LightSwitch (and Visual Studio 2010) ships with its own debugger, which is invoked for analyzing applications and displaying detailed information about the source code. As you learn throughout this chapter, LightSwitch provides a deep level of interaction between the code and the debugger. The instance of this debugger detaches when you shut down your application. As mentioned earlier in this book, in contrast to Visual Studio 2010, in LightSwitch an application launched from the IDE always runs in Debug mode, which means with an instance of the debugger attached.
As an alternative to pressing F5, you can click the Start Debugging button on the Visual Studio LightSwitch standard toolbar.
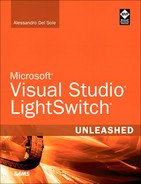
The debugger monitors your code’s execution and notifies you of any runtime errors; it allows you to take control over the execution flow, as well. Figure 14.1 shows the Invoice Management application running with the Visual Studio debugger attached. In the bottom area of the IDE, notice the availability of some windows, such as Locals, Watch 1, Watch 2, Call Stack, Breakpoints, Command Window, Immediate Window, and Output.
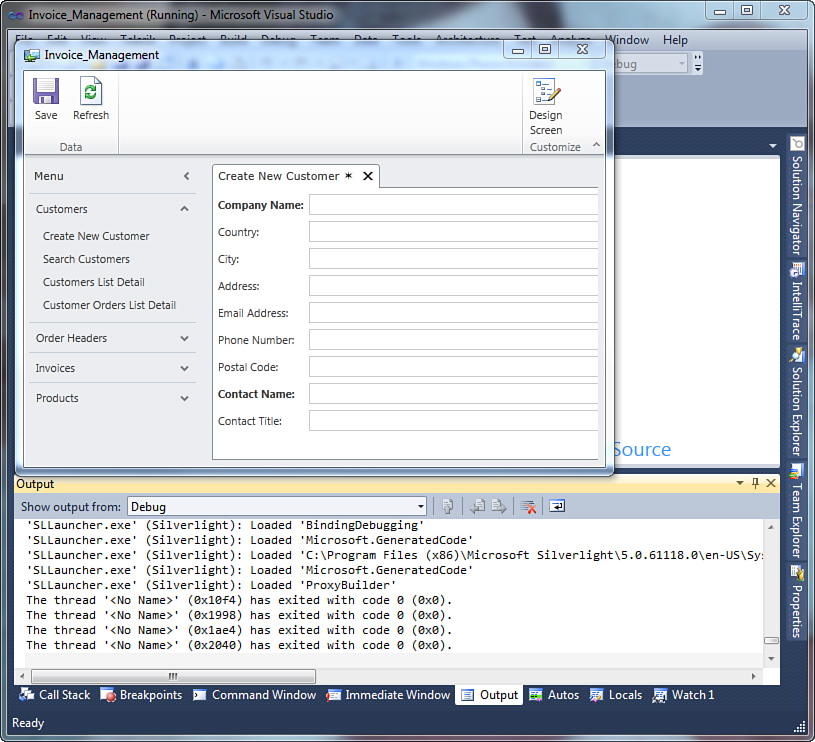
Figure 14.1. The sample application running with an attached instance of the Visual Studio debugger.
Before explaining the tooling, it is a good idea to modify the source code of our test application so that we can cause some errors and see the debugger in action. We could rewrite the Product_Validate method’s code, as shown in Listing 14.1. (To reach the code, just right-click the OrderDetails element in Solution Explorer and select View Table Code.)
Listing 14.1. Modifying the Code for Debugging Purposes
Private Sub Product_Validate(ByVal results As _
Microsoft.LightSwitch.EntityValidationResultsBuilder)
Dim duplicatesQuery = From detail In Me.OrderHeader.OrderDetails
Where detail.Product IsNot Nothing AndAlso
detail.Product.Id = Me.Product.Id AndAlso
detail IsNot Me
If duplicatesQuery.Any Then
results.
AddPropertyError("Cannot add the same product twice (" & _
Product.ProductName & ")")
End If
End Sub
The edited code no longer contains the following conditional code block:
If Me.Product IsNot Nothing Then
...
End If
This was used to ensure that a valid Product instance was attached to the current OrderDetail, but now the code will throw an error when creating a new order detail. This is useful for understanding breakpoints and other features in the code editor, because we need to understand how the debugger catches errors at runtime, together with the Edit and Continue feature.
The Error List Tool Window
When you request to start an application for the first time or when you edit the application in any way, Visual Studio LightSwitch compiles the project before attaching the debugger. If the compilation process fails for any reason, the Error List window lists all errors messages coming from the compiler. Error messages are of the following types:
• Errors, which prevent the application from being executed and that must be fixed.
• Warnings, which do not prevent the application from being executed. In most cases, warning messages should not be ignored, and the error that they point out should be checked even if the application’s execution is not compromised.
• Messages, which are not errors but simple informative messages sent by the compiler.
Figure 14.2 shows an Error List window.
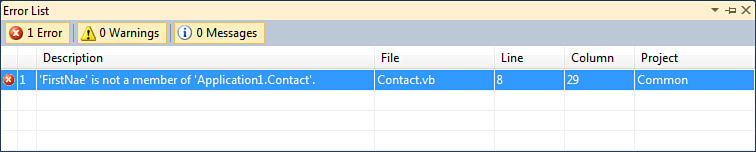
Figure 14.2. The Error List window.
The Error List window provides information about the file that contains the error and the line/column where the error was raised, including the project name (in case of a solution with more than one project). Generally, you just double-click the error message and are redirected to the place where the selected error was raised (typically the bad line of code) so that you can quickly analyze it and fix it.
Breakpoints and Data Tips
Breakpoints enable you to control the execution flow of your code. Basically, a breakpoint breaks the execution of the code at the point where the breakpoint itself is placed so that you can take required actions (a situation known as break mode). You can then resume the application execution by pressing F5 or F11 (as described momentarily). To place a breakpoint on a specific line of code, just place the cursor on the line of code you want to debug and press F9.
To add a breakpoint, you can also right-click the line of code you want to debug and select Breakpoint, Insert Breakpoint from the pop-up menu or just click the leftmost column in the code window.
A breakpoint is easily recognizable; it highlights in red the selected line of code (see Figure 14.3).
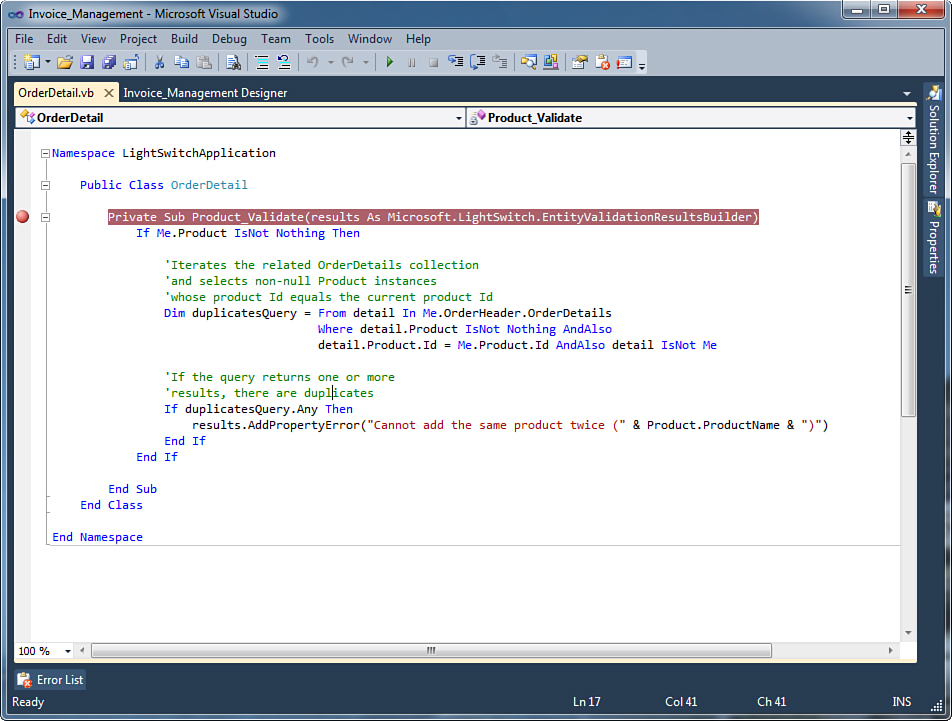
Figure 14.3. Placing a breakpoint in the code editor.
To see how breakpoints work, we can run the sample application by pressing F5. When the debugger encounters a breakpoint, it breaks the execution and highlights in yellow the line of code that is being debugged, as shown in Figure 14.4, before the code is executed.
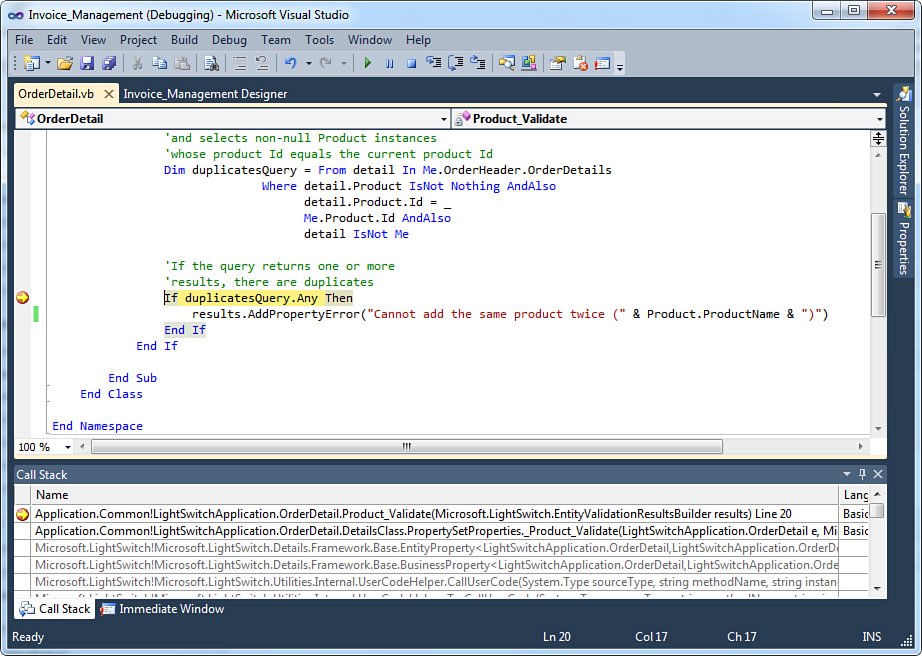
Figure 14.4. When encountering a breakpoint, Visual Studio highlights the line of code that is currently debugged.
In Figure 14.5, notice a couple of amazing things. First, if you pass over a variable with the mouse pointer, IntelliSense shows the content of the variable itself, if any; if not, it is set to Nothing. This feature is known as Data Tips and is useful if you need to know the content of a variable or of another object in a particular moment of the code execution. You can then execute just one line of code at a time, by using several different commands, as explained in the next subsection.
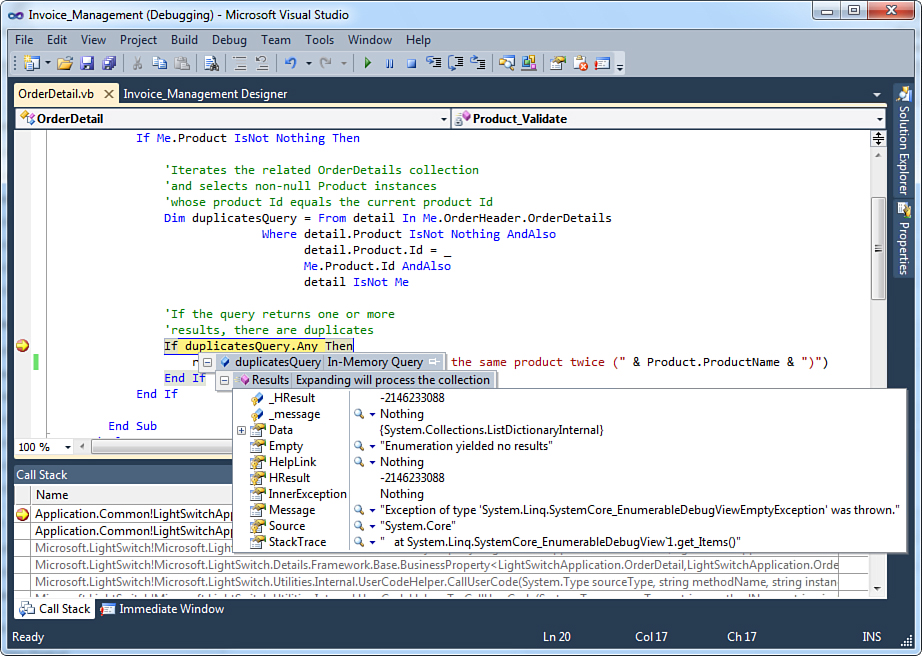
Figure 14.5. The Step Into command enables you to check whether the variable has been assigned correctly.
Depending on your configuration, it might happen that breakpoints will be represented with a white circle and a warning symbol, with advice that they will not be hit. This is a problem because you will not be able to use breakpoints and other debugging tools. If this is your situation, solve the problem by going to Tools, Options. When the Options dialog is shown, ensure that the Show All Settings options is enabled, and then go to Debugging, General. At this point, uncheck the Enable Just My Code check box. Visual Studio LightSwitch will then be able to hit breakpoints.
Debugging in Steps
When the code execution breaks (for example, when the debugger finds a breakpoint), you can usually continue to execute the application by running just one line of code at a time or a small set of lines of code at a time. There are several options available for executing code in steps, as explained next.
How Can I Execute These Techniques?
Debugging techniques described in this section can be accomplished by invoking commands available in the Debug menu of Visual Studio LightSwitch. Shortcuts (mentioned here when discussing each command) are also available for invoking the same commands using the keyboard.
Step Into
The Step Into command executes one instruction at a time. Its main feature is that if the instruction to be executed is a method, the IDE enters into the method’s body and executes it by running one instruction at a time. When finished, the execution goes back to the caller. You can invoke Step Into by pressing F11. For example, suppose we want to check whether the duplicatesQuery variable is correctly initialized at runtime; we could press F11. The line of code where the breakpoint is placed will now be executed, and Visual Studio will highlight the next line of code. At that point, you can still pass the mouse pointer over the variable to see the assignment result, as shown in Figure 14.5.
When you finish checking the assignments, you can resume the execution by simply pressing F5. At this point, the execution of the application continues until another breakpoint or runtime error is encountered.
The keyboard shortcuts in this chapter assume that you are using the Visual Studio default keyboard layout and may vary depending on the IDE configuration settings. The Debug menu shows the appropriate keyboard shortcuts for your active configuration.
Step Over
Similar to Step Into, Step Over also executes one instruction at a time. The difference is that if the instruction to be executed is a method, the debugger does not enter the method and completes its execution before going back to the caller. You can invoke Step Over by pressing F10. This can be useful when you need to debug a portion of code that invokes several methods that you have already tested and that you do not need to delve into each time.
Step Out
Step Out works only within methods and enables executing all lines of code next to the current one, until the method completes. If you consider the code shown in Listing 14.1 and place a breakpoint on the If statement, invoking Step Out will cause the debugger to execute all the lines of code next to the If, completing the execution of the method. You can invoke Step Out by pressing Shift+F11.
Run to Cursor
You can place the cursor on a line of code, right-click the line of code, and tell the debugger to execute all the code until the selected line. This can be accomplished by selecting the Run to Cursor command on the appearing pop-up menu. The related shortcut is Ctrl+F10.
Set Next Statement
Within a code block, you can set the next statement to be executed when resuming the code execution after a breakpoint or a stop. Continuing the previous code example, if you place a breakpoint on the If statement, the application stops the execution at that point. Now suppose you want the debugger to resume debugging from the End If statement (therefore skipping the debugging of the If body), executing the lines of code before. You can just right-click the End If statement and select the Set Next Statement from the pop-up menu, and this line will be the first that you can step through.
Show Next Statement
This command moves the cursor to the next executable statement. This can be useful if you have long code files and breakpoints are not immediately visible. You can invoke it simply by right-clicking the code editor and choosing the Show Next Statement command from the pop-up menu.
About Runtime Errors
Runtime errors are particular situations in which an error occurs during the application execution (unpredictable by the developer or the result of programming errors not visible at compile time). Typical examples of runtime errors are when you create an application and enable users to specify a filename but the file is not found on disk, or when you need to access an object that has not been instantiated yet.
Obviously, in real-life applications, you should predict such possibilities and implement the appropriate checks. For our learning purposes about the debugger, we need some code that we know will cause an error. For example, because of the lack of checks about null products, when you attempt to create a new order detail this will fail. When the error is raised, Visual Studio LightSwitch breaks the execution, as shown in Figure 14.6.
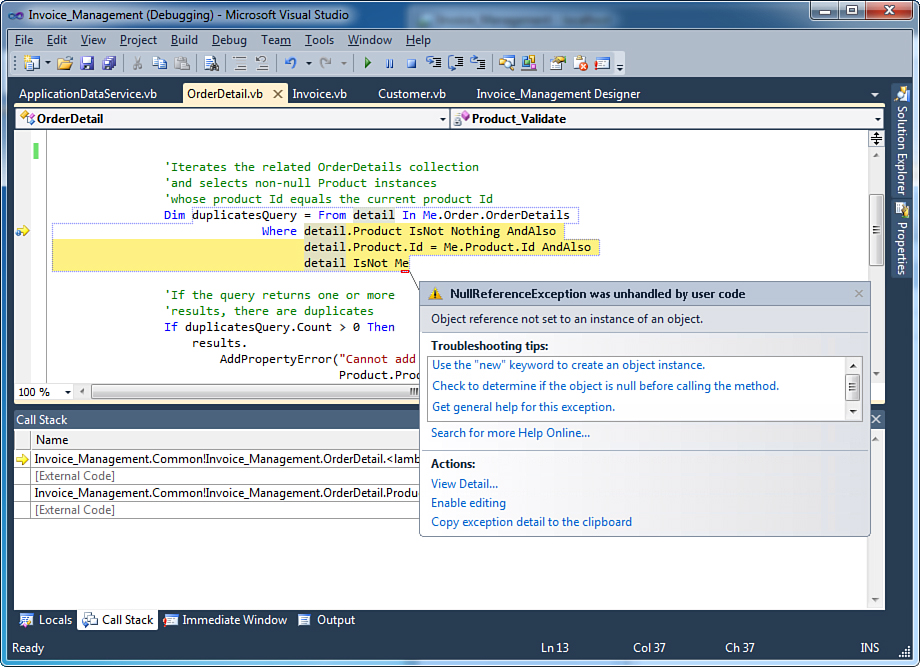
Figure 14.6. The LightSwitch debugger encounters a runtime error.
As you can see, the line of code that caused the error is highlighted. You also can see a pop-up window that shows some information about the error. In our example, the code attempts to evaluate a null object, so a NullReferenceException is thrown; therefore, the execution of the application is broken. Visual Studio also shows a description of the error message and some suggestions. For example, the Troubleshooting Tips box suggests some tasks that you could perform at this point, such as creating an instance of the object by using the New keyword or getting general help about the error. By clicking such a tip, you are redirected to the MSDN documentation about the error. This can be useful when you do not know exactly what an error message means. There are other options within the Actions group. The most important is the one named View Detail. This enables you to open the View Detail window, which is shown in Figure 14.7.
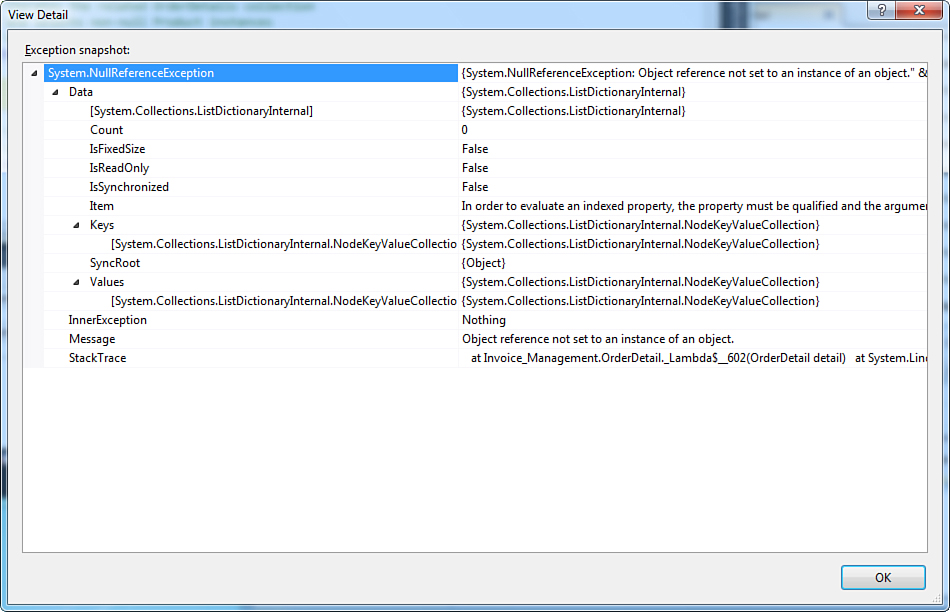
Figure 14.7. The View Detail window enables developers to examine in detail what caused an exception.
Notice how the StackTrace item shows the hierarchy of calls to classes and methods that effectively produced the error. Another interesting item is the InnerException. In this example, it is set to Nothing, but it is not unusual for this item to show a kind of exception tree that enables you to better understand what actually caused an error. For example, think of working with data. You might want to connect to SQL Server and fetch data from a database. You might not have sufficient rights to access the database, and the runtime might return a data access exception that does not allow you to immediately understand what the problem is. Browsing the InnerException can help you understand that the problem was caused by insufficient rights. Going back to the code, this is the point where you can fix it and where the Edit and Continue features comes in.
The Edit and Continue Feature
The Edit and Continue feature enables you to fix bad code and resume the application execution from the point where it was broken, without having to restart the application. Basically, you just need to run the application by pressing F5. Then you can break its execution by pressing Ctrl+Alt+Break or selecting the Break All command in the Debug menu.
Availability of Edit and Continue
You can usually use the Edit and Continue feature, but sometimes you can’t. For example, if fixing your code influences the general application behavior, you must stop the application, make your edits, and then restart the application. In addition, this feature is not available if Visual Studio 2010 is targeting 64-bit operating systems.
In our example, we need to fix the code that attempts to work with null Products. This is one of those situations in which Edit and Continue is not available, because edits require reprocessing the object and, consequently, restarting the application. You can try to edit the code yourself to understand how this feature works. However, fixing the error simply requires restoring it at its original state, which is the following:
If Me.Product IsNot Nothing Then
'Iterates the related OrderDetails collection
'and selects non-null Product instances
'whose product Id equals the current product Id
Dim duplicatesQuery = From detail In Me.OrderHeader.OrderDetails
Where detail.Product IsNot Nothing AndAlso
detail.Product.Id = Me.Product.Id AndAlso
detail IsNot Me
'If the query returns one or more
'results, there are duplicates
If duplicatesQuery.Any Then
results.
AddPropertyError("Cannot add the same product twice (" &
Product.ProductName & ")")
End If
End If
Advanced Debugging Instrumentation
The IDE offers additional powerful tools for deeply debugging applications. Such tools are part of the development environment instrumentation and are discussed in this section.
Breakpoints and Trace Points Unleashed
Earlier in this chapter, you learned about breakpoints and saw how to break the application execution before some statements are executed. Breakpoints combined with trace points are much more powerful, and this combination offers interesting features that make your debugging experience more thorough.
The Breakpoints Window
Using the Breakpoints window, you can manage all breakpoints in your solution. You can open a Breakpoints window by pressing Ctrl+Alt+B. Figure 14.8 shows what the Breakpoints window looks like with three breakpoints in the code.
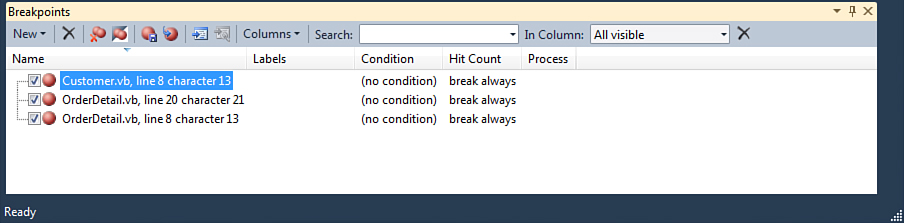
Figure 14.8. The Breakpoints window.
In the Breakpoints window, you can easily manage your breakpoints. For example, you could delete, temporarily disable, or enable again breakpoints. You can also specify the behavior for each breakpoint, such as Hit Count and other functionalities that we describe next. You also have an important opportunity to export and import breakpoints; Visual Studio LightSwitch (and Visual Studio 2010) can export to XML files the list of breakpoints or import a list from an XML file. If you have lots of breakpoints, you can search breakpoints according to specific criteria using the Label feature that we focus on next. Basically, the Breakpoints window provides a graphical unified instrument for performing operations on breakpoints.
Editing Breakpoints Labels
Visual Studio LightSwitch enables you to add labels to breakpoints. Labels are identifiers that can identify more than one breakpoint, and their purpose is to categorize breakpoints so that you can easily find and manage them within the Edit Breakpoint Label window. You can add a label to a breakpoint from the Edit Breakpoint Label window or by right-clicking the red ball on the left of the desired breakpoint in the code editor and then selecting the Edit Labels command from the pop-up menu. The Edit Breakpoint Labels window is shown in Figure 14.9.
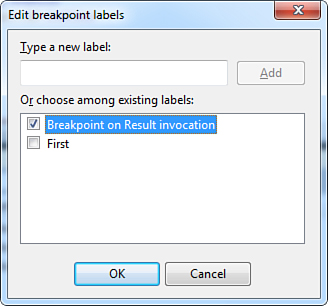
Figure 14.9. The Edit Breakpoint Labels window enables you to categorize breakpoints.
You simply need to specify labels and click Add. When you finish, select the label you want from the list and click OK so that the label is assigned to the breakpoint. You can assign the same label to multiple breakpoints, performing the same steps, or you can assign multiple labels to a single breakpoint. When you assign labels to breakpoints, such assignments are also visible in the Breakpoints window. This means you can easily search for breakpoints by typing labels in the search box.
Location
You can change the position of a breakpoint by right-clicking the breakpoint and selecting Location from the pop-up menu. In the dialog that appears, specify the line of code and character position into which you want the breakpoint to be moved. This is useful because you can move a breakpoint without losing breakpoint settings.
Hit Count
You can control a hit’s behavior. (The word hit here means that each time a breakpoint is encountered, the application execution should stop.) For example, suppose you have cyclic code that contains a breakpoint, but you need to break the execution only when the cycle arrives at a particular point. By using the Hit Count command, you can specify when the debugger must break the application. For example, consider the following code snippet:
For i As Integer = 0 To 3
ShowMessageBox("Breakpoint test")
Next
Suppose you place a breakpoint on the ShowMessageBox statement and that you want the debugger to break only starting from the second iteration. You can specify this condition by right-clicking the breakpoint and selecting Hit Count. In the Breakpoint Hit Count dialog, you need to specify the condition. The default setting is Always Break, which means that the debugger breaks the execution each time a breakpoint is encountered. For this example, set the condition as Break When the Hit Count Is Greater Than or Equal To with value 2. Figure 14.10 shows the Breakpoint Hit Count window.
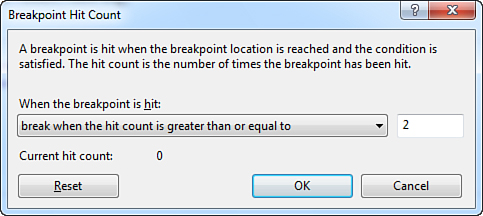
Figure 14.10. The Breakpoint Hit Count window enables you to customize breakpoint behavior.
With this setting, the previous code breaks on the second iteration. It can be convenient when you need to debug your code only from a certain point.
When Hit
When Hit enables specifying a trace point. The difference between a breakpoint and a trace point is that in the second case, the debugger will not break the execution of the application and writes the information that you specify in the Output window. To set a hit condition, right-click a breakpoint and select When Hit from the pop-up menu. This opens the When Breakpoint Is Hit window, as shown in Figure 14.11.
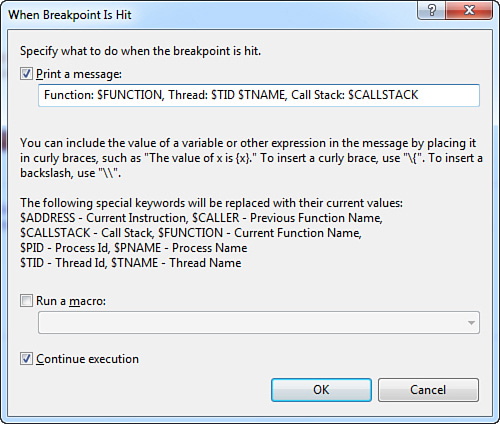
Figure 14.11. Specifying trace point conditions.
You can set one of the special expressions indicated in the window to build a kind of log message that will be written to the Output window. A trace point is highly customizable, so you can also specify a Visual Basic macro and decide whether the execution needs to continue. This feature is useful when you prefer getting a log message about the application state instead of breaking the execution.
Condition Commands
Condition commands enable you to specify whether a breakpoint must be hit depending on whether the supplied expressions are evaluated to True or get changed. You can find information about conditions in the MSDN Library: http://msdn.microsoft.com/en-us/library/za56x861(VS.100).aspx. When a condition is set, the debugger then steps into the Hit Count tool.
Showing a Variables Value in the Locals Window
The Locals window shows the active local variables and their values. Considering the example in Listing 14.1, when stepping into the Product_Validate method, the Locals window shows information about the Product object, as shown in Figure 14.12.
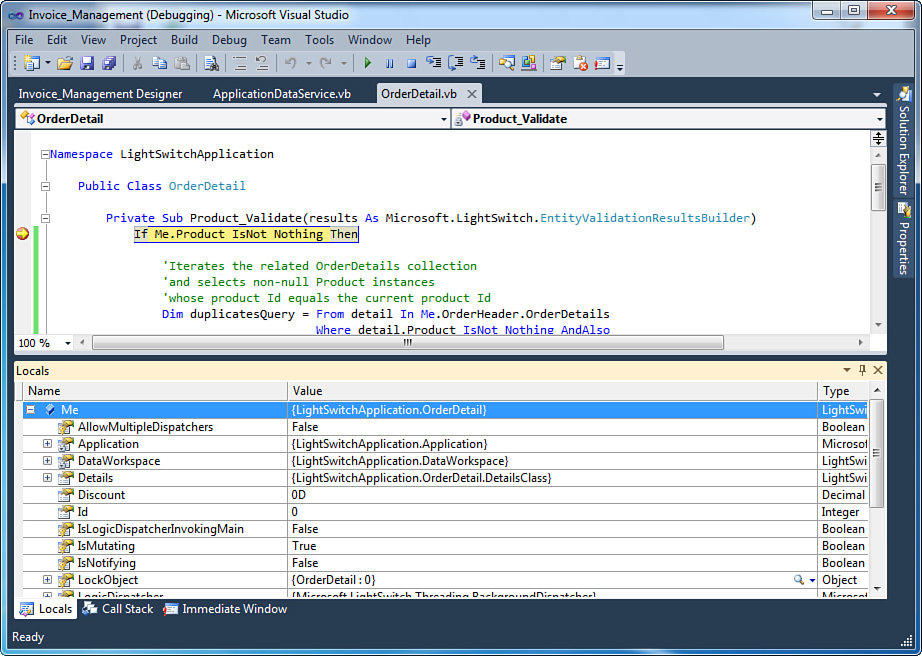
Figure 14.12. The Locals window shows information about local variables.
As you can see by expanding the window and variables listed there, it shows names of the local variables, their type (in our example Boolean and String), and their actual value. When a variable is not initialized yet, the window shows their default value (for example, Nothing for reference types and 0 for Integers). Moreover, if a variable represents an object such as a class or a collection, the variable can be expanded to show members and their values. You can also change variables’ values by double-clicking each one. Be aware, however, that some variables cannot be viewed without executing code, such as in-memory queries (although they can be still viewed, but the IDE will run the code in memory so that it can display the results).
Evaluating Expressions in the Command Window
The Command window enables you to evaluate expressions or run functions without running the application or continuing the debug. Figure 14.13 shows the Command window evaluating an Integer.Parse statement and an invocation to a fictitious method named Test.
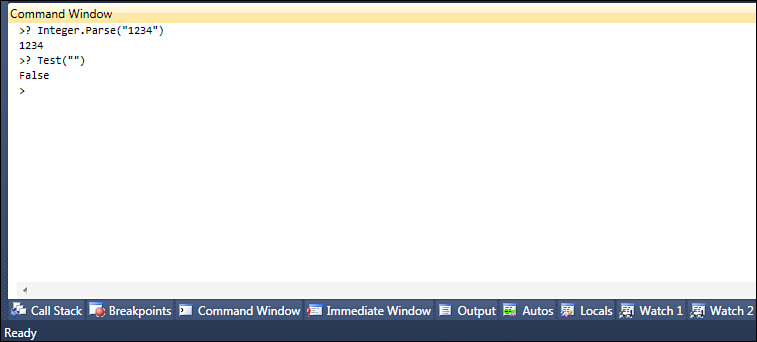
Figure 14.13. The Command window enables you to evaluate expressions and functions.
This is useful because we do not need to run our application to see whether a method works, and we can also evaluate complex expressions before writing code. Just remember that only functions (that is, Function statements) are allowed; procedures are not supported (meaning Sub statements). Expressions can consist of several .NET objects and Visual Basic or C# keywords, but not all of them are supported. You can get a complete list of supported keywords and expressions from the related MSDN web page at http://msdn.microsoft.com/en-us/library/za56x861.aspx.
To evaluate an expression or test a function, you must first write a question mark symbol. Using a double question mark causes the debugger to open a Quick Watch window, which is discussed later in this chapter. It is worth mentioning that the ? symbol works regardless of whether you are in Debug mode, but the ?? symbol requires the IDE to be already in Debug mode.
Understanding the Method Calls Flow in the Call Stack Window
The Call Stack window shows the stack frame of the method calls. In other words, you can see the list of method calls and the call sequence. The window can show the programming language that the method is written with and can also display calls to external code. To understand method calls, press F11 to step into the code. Figure 14.14 shows the Call Stack window related to Listing 14.1.
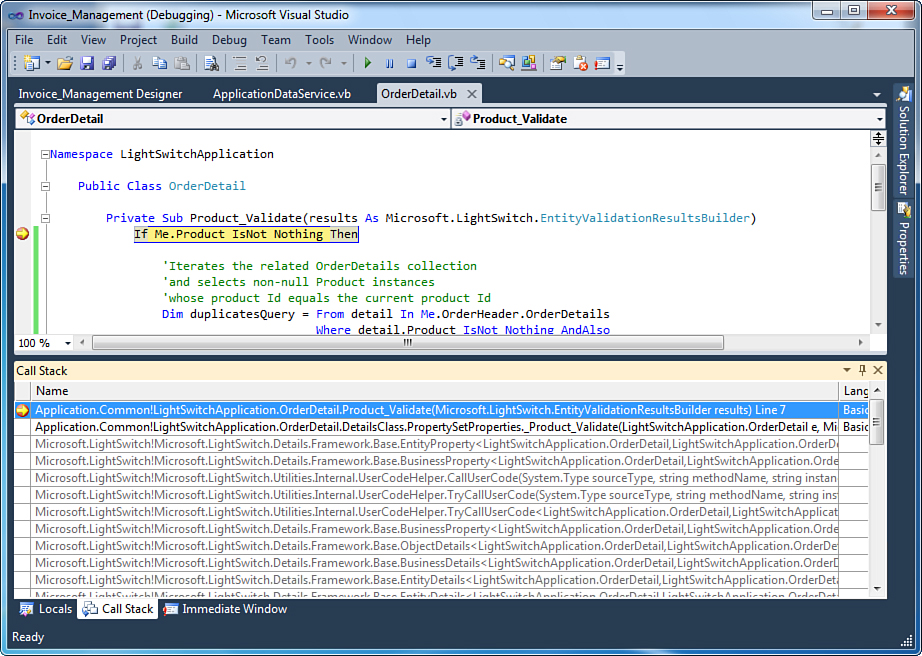
Figure 14.14. The Call Stack window shows method calls in the stack.
As you can see, the window shows names of methods being executed and the programming language they were written with. Moreover, calls to .NET Framework system methods are shown. You can also invoke the Call Stack window by pressing Ctrl+Alt+C.
The Call Stack window can show information only on the current thread. Therefore, method calls on other threads are ignored by the window.
Watch Windows
Watch windows enable you to monitor object variables or expressions so that you can track what a variable is doing. Multiple Watch windows are available so that you can track different objects or expressions. To add items to a Watch window, in Break mode right-click the object in the code editor and select Add Watch from the pop-up menu.
Continuing the example of Listing 14.1, suppose you want to keep track of the Product object state. Run the application and try to add a new product. This assumes you previously placed a breakpoint on the If statement. When the debugger breaks the code execution, right-click the Me.Product object, and then click Add Watch. The Product object is considered an expression. The first available Watch window displays and contains the Product item, as shown in Figure 14.15. When you step into the code, you notice that the Watch window displays the expression evaluation, which in this case means showing values from the object.
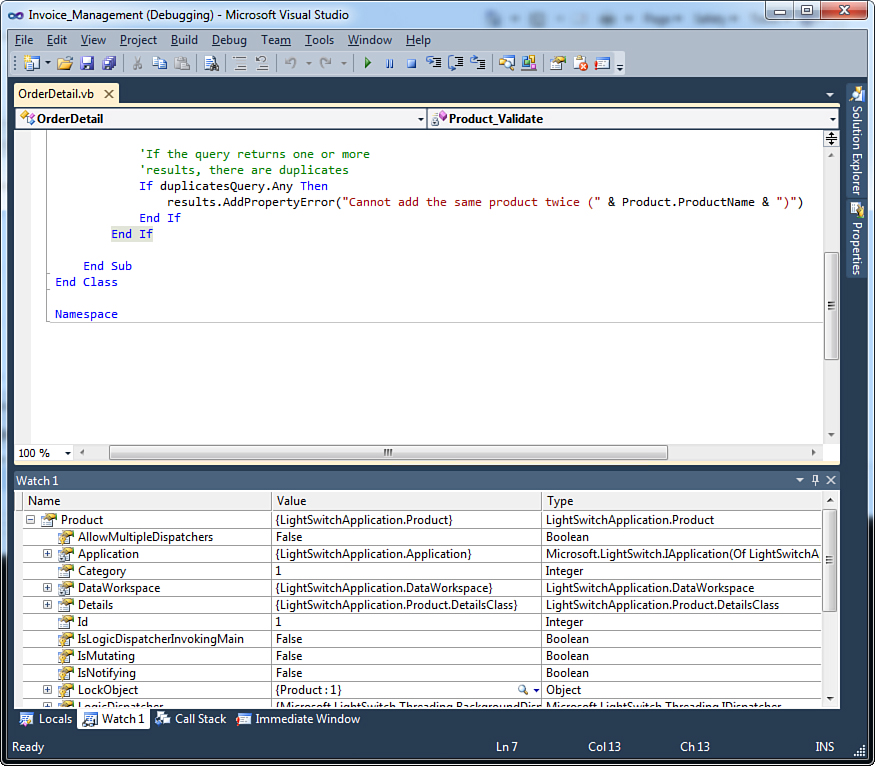
Figure 14.15. Evaluation of the expression is completed within the Watch window.
When applied to methods, Watch windows enable you to check whether the evaluation performs as expected. In this way, you can control if your variables or methods are correctly executed.
Quick Watch Window
The Quick Watch window is an additional Watch window that enables you to quickly evaluate one expression or variable at a time, by choosing between items you previously added to Watch windows or by right-clicking an object in the code editor and then selecting Quick Watch. In this scenario, the expression or variable is evaluated, considering its state at the moment that you request the Quick Watch to appear. Figure 14.16 shows the Quick Watch window.
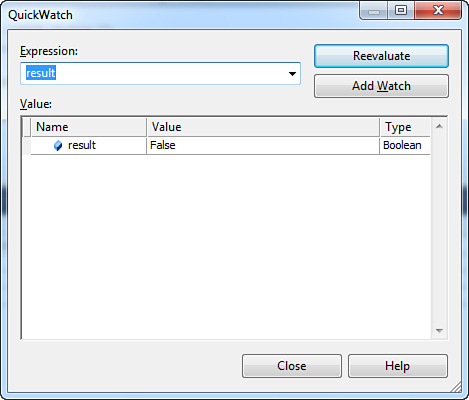
Figure 14.16. The Quick Watch window.
You can pick an expression from the Expression combo box. When you choose the expression, you can click Reevaluate to run the evaluation. Just remember that this dialog is a modal dialog, and therefore you need to close it before you can go back to Visual Studio LightSwitch.
Analyzing Threads with the Threads Window
.NET applications can run multiple threads. This happens also with LightSwitch applications. You can get a view of the running threads and debugging threads within the Threads window, which you can enable by pressing Ctrl+Alt+H. Figure 14.17 shows the Threads window open when the sample application is in Break mode.
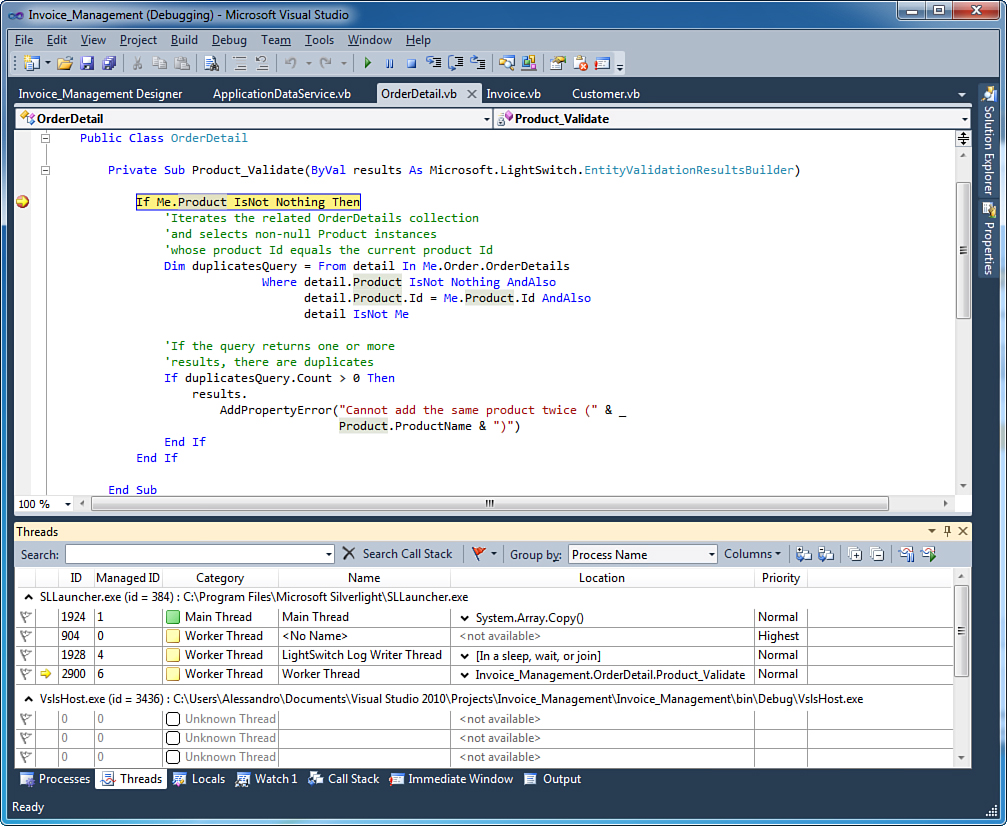
Figure 14.17. The Threads window.
The window shows a list of running threads and enables you to step into the call stack for the various threads. If the source code is available for threads different from the current one, you can step into this code. In our example, the main thread is the SLLauncher.exe application (marked in green); this is the engine that runs Silverlight applications as desktop clients. You can also organize and filter the view, search within the call stack, and get information about the thread’s priority.
Understanding Debugger Visualizers
Debugger visualizers are built-in tools that enable you to view information about objects, controls, members, and variables (generally complex data) in a particular format. For example, locate the ContactName_Validate method in the Customer entity definition, and then place a breakpoint on the If statement of the following block:
If Me.ContactName IsNot Nothing
AndAlso Not System.Text.RegularExpressions.
Regex.IsMatch(Me.ContactName,
"^D*[a-zA-Z]+$") Then
results.AddPropertyError("Contact name has invalid characters.")
End If
You can then open the Locals window and select the Me.ContactName variable. In the Value column, notice the presence of a small magnifying glass that you can click. From there, you can choose how you want to visualize information on the ContactName variable, such as Text format, XML format, and HTML format. Of course, trying to view the content of plain text as XML content will not provide any benefits. If you have a string representing XML data or HTML code, however, you could get an appropriate representation to understand what is happening. Visualizers are also useful when you have a large multiline string and you need to see how it is formatted. In our example, Figure 14.18 shows the Text Visualizer for the Product variable.
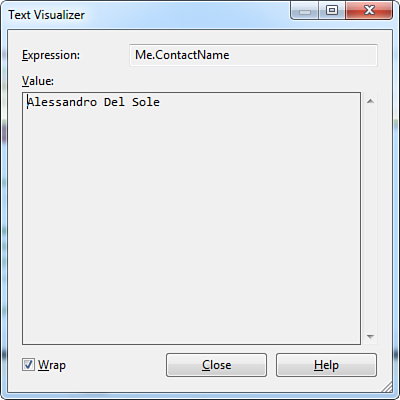
Figure 14.18. Viewing information with debugger visualizers.
Put simply, visualizers provide a graphical tool to analyze what is happening on expressions.
Debugging in Code
The .NET Framework enables you to interact with the debugger via managed code. You can use two classes, System.Diagnostics.Debug and System.Diagnostics.Trace, to verify conditions and evaluations that can be useful to provide feedback about your code if it is working correctly. Information generated by these classes can eventually be added to the application.
Both Debug and Trace classes are single-instance, shared classes and therefore expose only shared members.
The Debug Class
The Debug class, exposed by the System.Diagnostics namespace, provides interaction with the Visual Studio debugger and enables you to understand whether your code is working correctly via instrumentation that evaluates conditions at a certain point in your code. Basically, the Debug class exposes only shared methods and can display content in the Output window so that you can programmatically interact with the debugger without having to set breakpoints. It is important to mention that in LightSwitch applications, you have the option of using only two methods: WriteLine and Assert (in contrast to what you can do in other kinds of .NET applications, where the Debug class offers lots of interesting methods). The reason is that LightSwitch applications run in the Silverlight context, which applies some limitations to the .NET Framework, including the System.Diagnostics namespace. The WriteLine method writes the specified message to the Output window and adds a line terminator; Assert checks for a condition and shows a message if the specified condition is evaluated as False.
That the Debug class can display content to the Output window is true only in part. Developers can use other built-in outputs known as trace listeners to redirect the output. Later in this chapter, you learn about these trace listeners.
Continuing the code example in Listing 14.1, try to add the following line of code before the second End If statement:
System.Diagnostics.Debug.
WriteLine("Value of Product Name is: {0}", Me.Product.ProductName)
If you have previous experience with .NET programming languages, you will notice how WriteLine supports string formatting. Now run the application and enter a new product for a new or existing order detail. Figure 14.19 shows what the Output window looks like when the runtime encounters the Debug.WriteLine method.
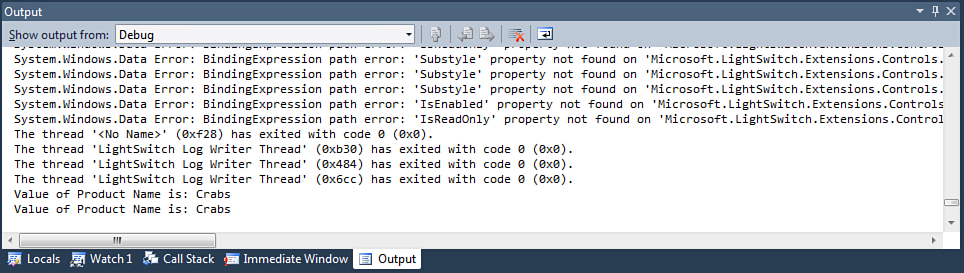
Figure 14.19. Writing debug information to the Output window.
The WriteLine method can prove useful if you need to monitor objects’ values without breaking the application. This method also adds a line terminator so that a new line can begin. The other mentioned method is Assert. This method causes the runtime to show a message box containing the specified message that is shown only if the specified expression is evaluated as False. For example, add the following line of code as the first line in the Product_Validate method body:
System.Diagnostics.Debug.Assert(Me.Product IsNot Nothing, "Invalid product")
According to this, if you enter a new order detail without specifying a product, the expression is evaluated as False, and therefore the runtime shows the given message via the dialog shown in Figure 14.20.
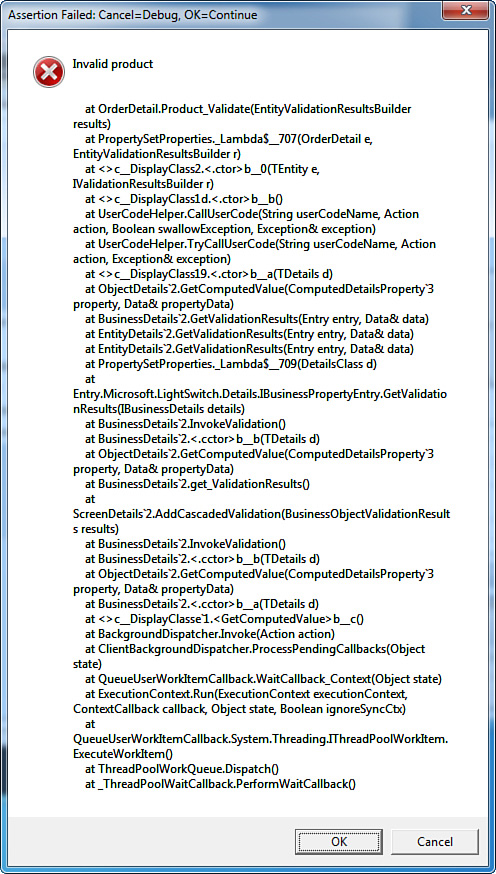
Figure 14.20. The Assertion dialog.
Assertions are typically useful if you want to check for conditions and investigate the stack trace of method calls.
Using Debugger Attributes in Code
Autogenerated code influences the debugger’s behavior via the specification of some .NET special built-in attributes. In addition, you can influence the debugger’s behavior against your code by specifying the same attributes.
Attributes are the way the .NET Framework enables you to extend object definitions with additional metadata. Attributes are typically used to describe code or to affect the runtime behavior of the code itself. You can find further information about attributes in .NET programming in the MSDN documentation at http://msdn.microsoft.com/en-us/library/5x6cd29c(v=VS.100).aspx.
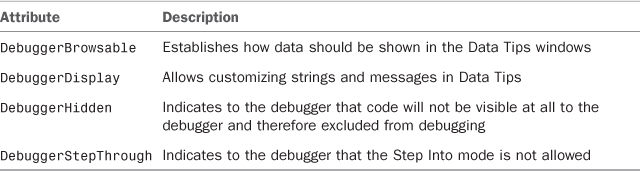
Custom code in LightSwitch applications can take advantage of just a subset of available attributes in the .NET Framework; the reason for this is that you can use only a limited set of attributes in Silverlight because of its special context. Table 14.1 lists available attributes.
You will seldom need to use debugger attributes in your code. LightSwitch knows how to apply attributes in the most appropriate way possible, and your code will usually not need them. They are described here for the sake of completeness.
DebuggerBrowsable
You use the DebuggerBrowsable attribute to establish how an item should be visualized in Data Tips or windows related to variable monitoring, specifying one of the following arguments exposed by the System.Diagnostics.DebuggerBrowsableState enumeration:
• Collapsed, which establishes that an item is collapsed and that you have to click the + symbol to expand it and see its children elements
• Never, which causes the specified item to be never visible in the Locals window
• RootHidden, which forces the debugger to show just the children elements of the specified item
For example, rewrite the LINQ query shown in Listing 14.1 by moving the declaration of the duplicatesQuery at the class level, marked with the DebuggerBrowsable attribute, as follows:
<DebuggerBrowsable(DebuggerBrowsableState.Never)>
Private duplicatesQuery As IEnumerable(Of OrderDetail)
...
...
Me.duplicatesQuery = From detail In Me.Order.OrderDetails
Where detail.Product IsNot Nothing AndAlso
detail.Product.Id = Me.Product.Id AndAlso
detail IsNot Me
The preceding code causes the debugger to prevent the duplicatesQuery from being visible in the debug windows.
DebuggerDisplay
The DebuggerDisplay attribute enables you to establish how an item should be shown inside Data Tips. With such an attribute, you can replace the Visual Studio LightSwitch default strings and customize the description for an object within Data Tips. For example, suppose you want to display the name and the units in stock of products when the debugger is in Break mode and you investigate the contents of each Product entity instance. In Solution Explorer, right-click the Products element and select View Table Code. When the code editor shows the definition for the Product class, add the following attribute to the class declaration:
<DebuggerDisplay
("{UnitsInStock} units in stock are available for product {ProductName}")>
Public Class Product
By adding this attribute, each time you display Data Tips for a Product entity, you will see the value of both ProductName and UnitsInStock properties. Basically, with DebuggerDisplay, you provide a custom Data Tip description, where you can show values from desired properties by enclosing property names within brackets. To demonstrate how this works, place a breakpoint on the If prod.ProductName = Me.ProductName Then statement, and then run the application to work with some products. When the debugger enters Break mode, if you pass the mouse pointer over the p object, Data Tips for this object are activated. The debugger then displays data that is formatted how it was specified when the DebuggerDisplay attribute was applied. Figure 14.21 shows the result of this customization.
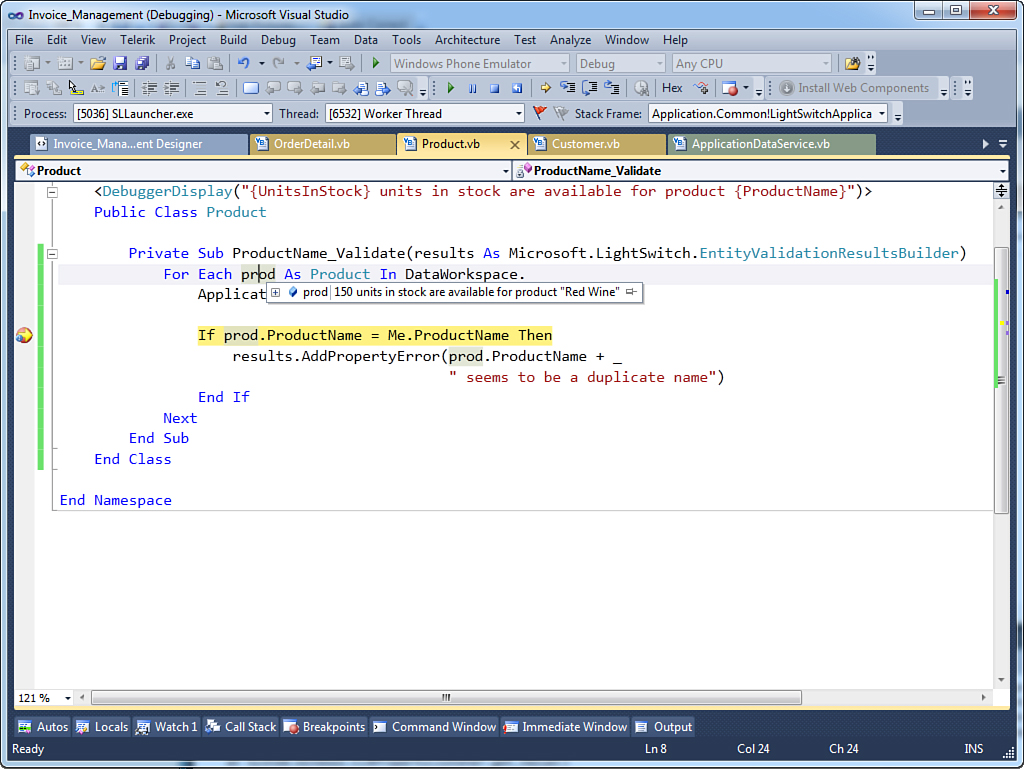
Figure 14.21. The DebuggerDisplay attribute enables you to customize Data Tips messages.
DebuggerHidden
As its name implies, DebuggerHidden prevents code from being visible to the debugger, meaning that you cannot use the debugger instrumentation against the code marked as hidden. You just add the following attribute to the code you want to hide:
<DebuggerHidden()> Public Class Product
End Class
DebuggerStepThrough
DebuggerStepThrough tells the debugger that code marked with this attribute cannot be debugged with Step Into (F11) and that it will be executed as a whole. You just add the following attribute to the code:
<DebuggerStepThrough()> Public Class Product
End Class
The DebuggerTypeProxy Attribute
Actually, the IntelliSense in the code editor shows the DebuggerTypeProxy attribute among the available ones. Although listed and usable, this attribute in LightSwitch produces no result (as instead happens in Visual Studio 2010). This is why it is not described here. If you run Visual Studio 2010, you can get information about this attribute in the MSDN documentation: http://msdn.microsoft.com/en-us/library/system.diagnostics.debuggertypeproxyattribute.aspx.
Summary
Debugging is a primary task when developing applications. The Visual Studio LightSwitch IDE offers many useful tools that can enhance the debugging experience. In this chapter, you learned about breakpoints and trace points, passing through debugging in steps. You also saw the debugger windows in action, enabling deep control over variables and objects. You also learned how to interact with the debugger using the Debug class. Near the end of the chapter, you learned how to customize your own code to take advantages of the Visual Studio debugging tools, decorating your code with debug attributes. The next part of the book is all about extensibility. You start by learning how to customize the development environment, and then you learn how to create extensions for LightSwitch.