Chapter 7. Gaps and Moving Averages
Chapter 5, “Gaps and Previous Price Movement,” examined the relationship between gaps and price movements immediately around the time of the gap. Specifically, you looked at candle colors on the day before the gap and the day of the gap. You saw that noting the color of the candle the day before a gap occurred did help determine profitable trading strategies. When you saw a black candle on Day –1 and a gap on Day 0, the returns on Day 1 tended to be positive. This was especially true for down gaps, suggesting that when downward price movement on Day –1 is followed by a down gap on Day 0, much of the downward pressure on price is exhausted and a reversal is likely.
This chapter takes a slightly longer-term view. What if the stock’s price is above (or below) its 10-day moving average on the day of the gap? How is that related to price movements after the day of the gap? Similarly, what is the impact of the stock’s 10-day, 30-day, or 90-day moving average price? Basically, this chapter considers how gaps that occur at relatively high prices compare to gaps that occur at relatively low prices.
To do this, we calculate 10-day, 30-day, and 90-day simple moving averages. For the 10-day moving average, we computed a simple moving average of the closing prices from Day –10 through Day –1. We then examined the relationship between the price on the day of the gap and the moving average of price in several ways. To explain, say that the 10-day moving average as of Day –1 was 13 and that the closing price on Day 0 (the day of the gap) was 10. In this instance, the Day 0 price would be below the 10-day moving average of 13, and the gap would be classified as occurring below the moving average.2
Table 7.1 shows the average returns for holding periods of 1, 3, 5, 10, and 30 days following the day of a down gap when the gap occurs below and above price moving average. When all 97,029 down gaps are considered, the 1-day return the day of the gap is negative. As you have seen before, when a down gap occurs, the price usually continues downward on Day 1 but quickly reverses and begins rising. What is striking about the results in Table 7.1 is this holds true for down gaps that occur below the price moving average but not for down gaps that occur above the price moving average.
Table 7.1. Returns for Down Gaps Occurring Below and Above Price Moving Average

Now look a little more closely at the down gaps that occur at prices below the moving averages. Eighty-eight percent of down gaps occur at a price below the 10-day moving average; 73% and 61% fall below the 30-day and the 90-day moving average, respectively. Thus, most down gaps occur at a below average price. Also, notice that the down gaps that occur at below average prices tend to be larger than the down gaps that occur at above average prices. For the down gaps occurring at below average prices, the 3-day return is also negative.
Fewer stocks tend to gap down at an above average price. Only 12%, 27%, and 38% of the stocks gapped down at a price above the 10-day, 30-day, and 90-day moving average, respectively. The stocks that gap down at an above average price, tend to have small gaps. Most surprisingly, Table 7.1 shows that stocks that gap down at an above average price have, on average, a positive price movement on Day 1. All three of the down gaps at above average price subgroups have positive returns for 1-day through the 30-day holding periods. These results suggest that purchasing stocks that down gap at prices above a 10-day, 30-day, or 90-day moving average would be a profitable strategy.
Now turn your attention to stocks that gap up at above average and at below average prices. Table 7.2 shows the results for these stocks. Up gaps occur 116,903 times in the sample; the average gap size is 1.11%. Returns for stocks that gap up are negative up to the 10-day holding period; thus stocks tend to reverse right after gapping up. Unlike down gaps, most up gaps occur at an above average price. In fact, 89% of up gaps occur at a price higher than the 10-day moving average. Up gaps also tend to be slightly larger if they occur at an above average price. Although all subsets of upward gapping stocks in the test have negative 1-day and 3-day returns, the absolute values of the returns for the stocks gapping up above the moving average is significantly lower than those gapping below their moving average price. This suggests more profitable results from shorting stocks that gap up below their moving average than those that gap up above their moving average. Also, the reversal from negative returns to positive returns comes much sooner for the stocks that gap up at above average prices. For example, stocks that gap up at a price above their 30-day or 90-day moving average have positive returns by the 5-day holding period.
Table 7.2. Returns for Up Gaps Occurring Below and Above Price Moving Average

Merely looking to see if the price is above or below its moving average, as you have just done, ignores the amount by which that price is greater or less than its average. Tables 7.1 and 7.2 lump stocks that gap at a price one cent above their price moving average with those that gap at a price that is twice their price moving average. To refine this categorization a bit more, we break the groups into five categories. If a gap occurs within 75% to 125% of its moving average, it is placed in the gap at an “average price” category. If a gap occurs at a price level that is 125% to 175% of the moving average, it is categorized as an “above average price” gap. Gaps that occur at a price level that is more than 175% of the moving average are classified as “extremely high price” gaps. Likewise, stocks that gap at a price that is between 25% and 75% of the moving average are classified as “below average price” gaps; gaps occurring at a price less than 25% of the moving average are referred to as “extremely low price” gaps.
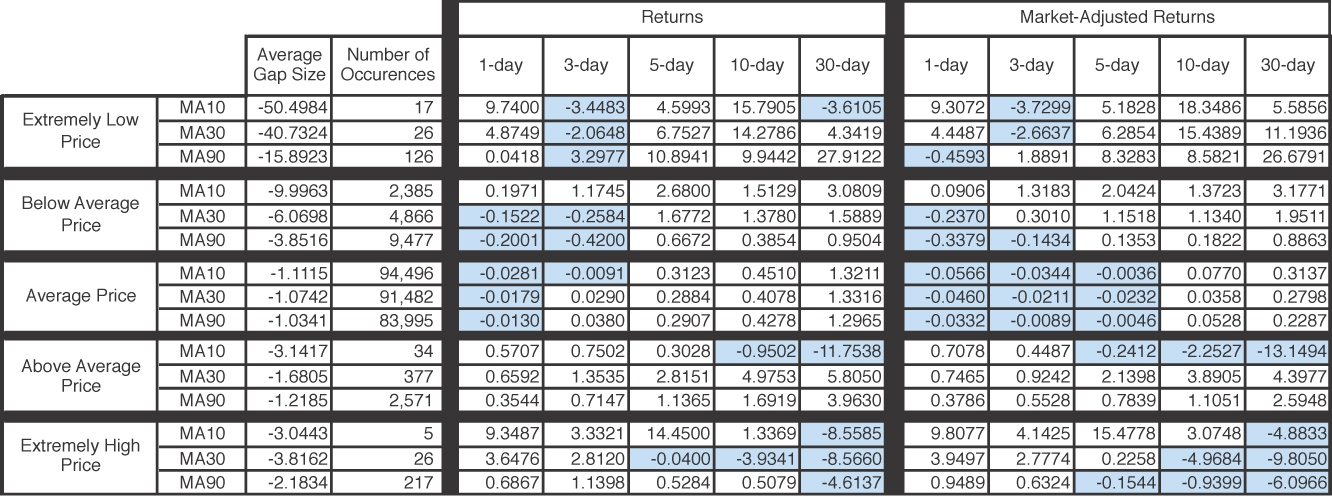
Table 7.3 contains the results for these five categories for down gaps. As you can see, most gaps occur within 75% to 125% of the moving average for the stock. Gap downs at above average and below average prices tend to be larger gaps, with the largest gap sizes occurring at the extreme prices. Looking at the average price gaps, you can see that a down gap on Day 0 is likely to be followed by downward price movement on Day 1; however, these stocks quickly reverse, leading to positive 10- and 30-day market-adjusted returns for these stocks.
Table 7.3. Returns for Gap Downs Sorted by Relative Price Level

Remember that in Table 7.1 you saw that down gaps that occurred above moving averages had positive returns out to the 30-day holding period. Tweaking the definition of “above average” a bit in Table 7.3 provides some useful information. The 1-day and the 3-day returns for stocks in the above average price and the extremely high price categories are positive, consistent with the results from Table 7.1. However, Table 7.3 warns that while these positive returns continue on average for stocks that gap down at a high price, positive returns do not continue to the 30-day holding period for all the subgroups. Stocks that gap down at extremely high prices tend to have large, negative returns by the 30-day holding period. The data in Table 7.3 suggests that traders should carefully watch stocks that have large gap downs at relatively high prices.
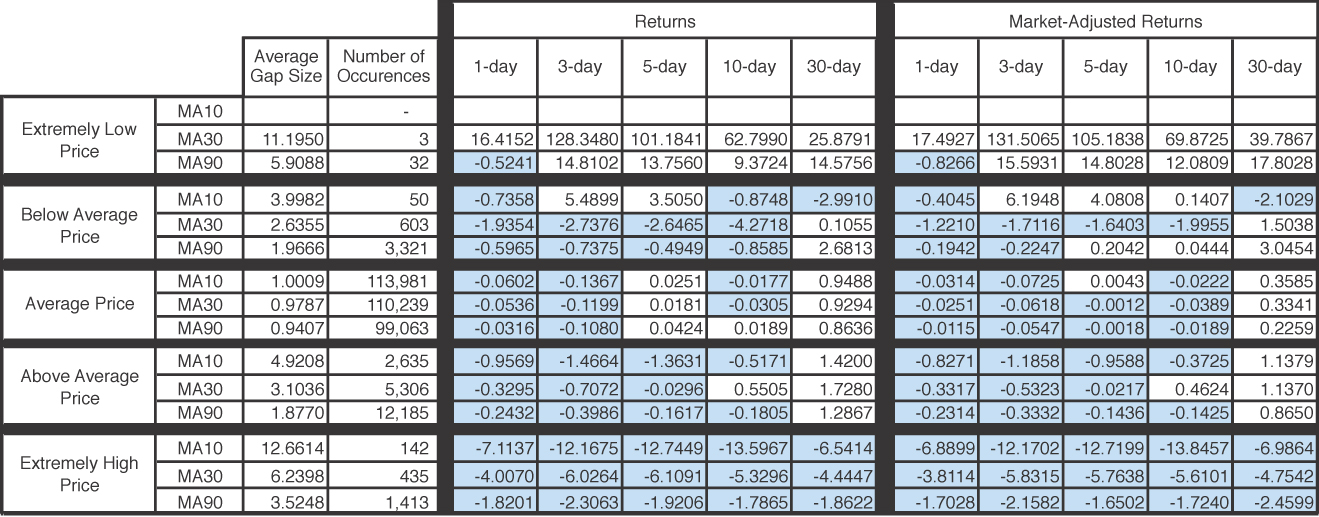
Table 7.4 presents the results for up gaps broken down into the five categories. The vast majority of up gaps occur within 75% to 125% of the moving average. Gaps that occur further away from the moving average, whether above or below, tend to be larger gaps. Looking at Table 7.4, it is striking how many negative return numbers are in the table. These results suggest that taking a long position immediately after a gap up in the price is not prudent, regardless of the price level at which the gap occurs. The one exception to this is the group of stocks that gapped up at a price less than 25% of their 30-day moving average; these stocks had astonishingly high returns. But, before you get too excited about these results, consider that there were only three occurrences of stocks gapping up at a price that was less than 25% of its 30-day moving average between 1995 and 2011. Not only is this situation rare, but also a sample size of three is not large enough from which to draw conclusions upon which to base trades.
Table 7.4. Returns for Gap Ups Sorted by Relative Price Level

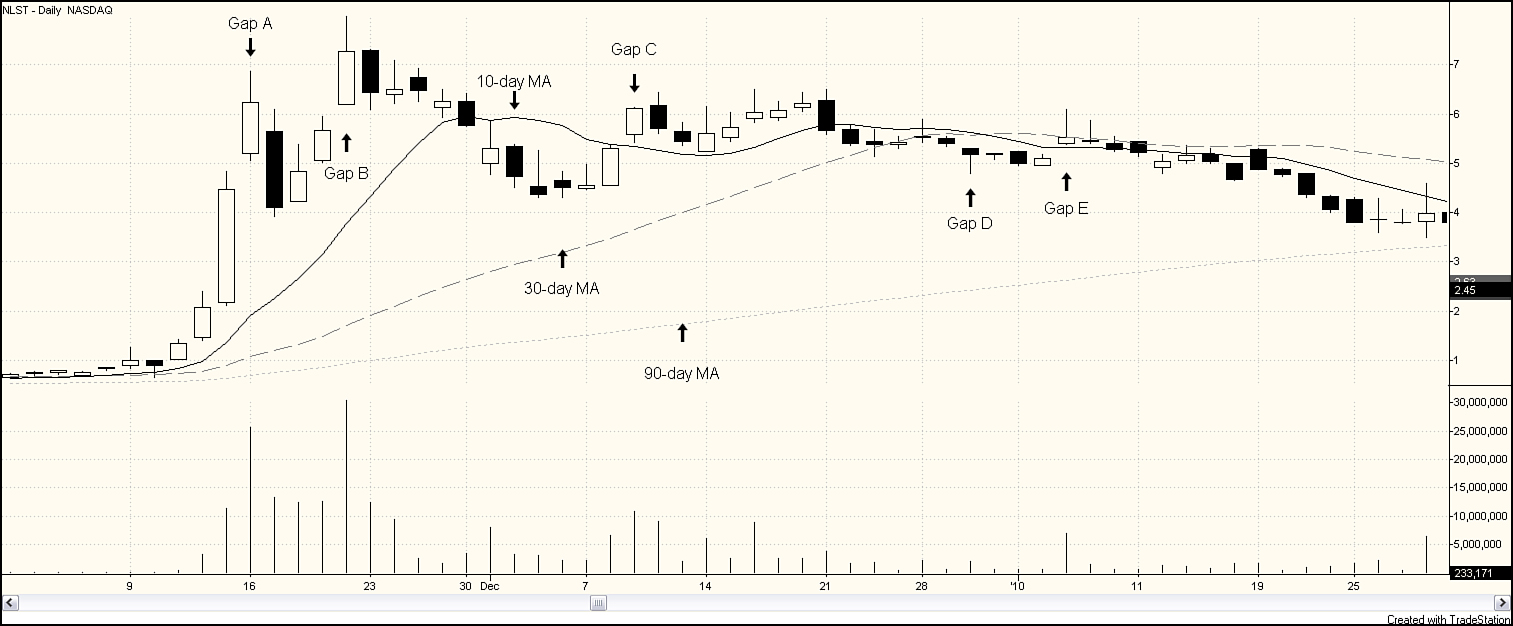
To understand a bit more about how a gap in the stock price can be related to moving averages, look at Figure 7.1. This chart is a daily candlestick chart for Netlist Inc. (NLST) over approximately 3 months. NLST designs, manufactures, and sells memory subsystems for datacenter server, high-performance computing, and communications markets. In mid-November 2009, the stock suddenly became more heavily traded. The daily volume, which had averaged below 400,000, jumped to more than 10 million on Friday, November 13, and to more than 25 million on Monday, November 16. This heavy volume can be attributed to new interest in the stock as the company announced the introduction of a new computer memory module. Not only did volume rise significantly, but price rose significantly. NLST had been trading under $1 a share for months but reached almost $5 a share on Friday, November 13. Figure 7.1 shows three moving averages, a 10-day, a 30-day, and a 90-day simple moving average. The rapidly rising price of NLST started pulling the moving averages up. The 10-day moving average (MA) moved up the most, closely tracking the price movement. The rise in the 30-day MA is much more subtle.
Created with TradeStation
Figure 7.1. Daily stock chart for NLST, November 2, 2009–January 28, 2010
On Monday, December 16, NLST gapped up. This gap, labeled Gap A in Figure 7.1, occurred above all three moving averages. This gap falls into the gap at an “extremely high price” category. Of the entire sample, this gap tops the list as the highest percentage above the 30-day moving average. It is the second highest above the 10-day moving average and the third highest above the 90-day moving average. As you have seen often happens, the price moves down the following day. After two white candles on Days 2 and 3, NLST gaps up again on Day 4, Friday, December 20. This is another gap at an extremely high price relative to the moving averages; it ranks fifth on the list of gaps relative to the 30-day moving average and on the 90-day moving average list. The following trading day, you can see another black candle. At this point NLST’s uptrend has lost its steam. By November 30, the 10-day MA has flattened out and the price falls below the moving average. On December 9, the stock gaps up again. This gap, labeled Gap C in Figure 7.1 crosses above the 10-day MA. Gap C is clearly above the 30-day and 90-day moving averages. The candle on December 9 crossed above the 10-day moving average, and NLST closed above the moving average; thus, you can classify this gap as occurring above the 10-day MA. NLST trades at approximately 6 for the next couple of weeks. Then, on December 30, Gap D occurs. This down gap is an example of a situation in which a gap is classified differently depending on which moving average is used. Gap D occurs at a below average price when the 10-day or the 30-day moving average is considered; it occurs at an above average price when the slower 90-day moving average is the criterion. Four days later another gap, labeled Gap E, occurs. This gap up occurs above the 30-day and 90-day moving averages but below the faster 10-day moving average.
So far, the analysis of trading strategies has considered the location of a gap relative to one moving average. If considering one moving average adds value to the decision, would considering two or three be even better? In other words, what if the price is not just below the 10-day moving average but is also below its 30-day moving average? Remember the gaps in NLST you just considered in Figure 7.1. Three of the gaps pictured, Gaps A, B, and C, are classified as above the 10-day, above the 30-day, and above the 90-day moving average. Gap D is included in the above 90-day moving average grouping but in the below 10-day moving average and 30-day moving average categories. Gap E is above the 10-day and 90-day moving average but below the 30-day moving average.
Looking at combinations of moving averages does seem to make a difference. Consider the results presented in Table 7.5. Of the 97,029 down gaps, 85,505 occur below the 10-day moving average and 70,474 occur below the 30-day moving average. However, only 68,203 down gaps occur below both the 10-day and the 30-day moving averages. Thus, you must consider that the gaps occurring below the 30-day moving average are not simply a subset of those occurring below the 10-day moving average; clearly, some down gaps occur below the 30-day moving average but above the 10-day moving average. Gap E in Figure 7.1 is an example of such a gap. Almost one-fourth of the down gaps that lie below the 10-day and 30-day moving averages occur above the 90-day moving average.
Table 7.5. Returns for Down Gaps Occurring Below and Above Multiple Price Moving Averages

The most stringent requirements for categorizing a gap as occurring at a below average price is the requirement that the gap lie below the 10-day, 30-day, and 90-day moving averages. Over half of all down gaps fall into this category. One interesting result presented in Table 7.5 is that the gaps that meet this stringent requirement have the largest negative 1-day return; actually, the negative return is four times larger than the negative return for the entire set of down gaps. These results reinforce the idea that down gaps that occur at below average prices should be sold short at the open of the next trading day for a short-run return.
Remember that gap downs that occur at above average prices tend to experience price reversal the next day, suggesting a long position strategy. A minority of stocks that gap down do so at above average prices. The results in Table 7.5 indicate that adding more stringent requirements, such as that the gap must occur above all three moving averages, does not add any value. Those down gaps occurring above the 30-day moving average remain the most profitable group in which to take a long position.
Now consider up gaps by looking at the results presented in Table 7.6. The sample contains 116,903 up gaps with the vast majority occurring above the average price. Eighty-nine percent of the up gaps occur above the 10-day moving average. Even 61% of the gaps meet the more stringent requirement of occurring above all three moving averages. Thirty-one percent of up gaps occur below the 90-day moving average, but of these gaps, approximately 79% occur at a price that is above the 10-day and the 30-day moving averages.
Table 7.6. Returns for Up Gaps Occurring Below and Above Multiple Price Moving Averages

Although Table 7.6 gives some additional information of the incidence of up gaps occurring at relatively high and low prices, it unfortunately does not give much additional information regarding the profitability of potential trading strategies. You have repeatedly seen that up gaps are followed by negative 1-day and 3-day returns. Refining the classification a bit more doesn’t alter those results. You also don’t see a pattern of a different magnitude of returns when you combine two or three moving averages.
Summary
This chapter focused on the impact the price at which a gap occurs relative to the average price for the stock has on the profitability of trading strategies. Most up gaps occur at above average prices, and most down gaps occur at below average prices. The vast majority of gaps occur within a 75% to 125% range of the stock’s price moving average. Some gaps, however, do occur at extremely high and extremely low price levels.
A consistent result throughout this chapter has been that stocks that gap down at above average prices tend to reverse price direction immediately. This suggests that purchasing a stock that gapped down on Day 0 at an above average price at the opening the following day, Day 1, will, on average, be a profitable trading strategy.
Stocks that gap up tend to have negative returns immediately following the gap. These negative returns tend to occur for a longer period of time for the stocks that gap up at relatively low prices. Stocks that gap up at a price below their 10-day, 30-day, or 90-day moving average still have negative returns at the 10-day holding period. By the 30-day mark, these returns have become positive.
Endnotes
1. Kirkpatrick, Charles and Julie Dahlquist. Technical Analysis: The Complete Resource for Financial Market Technicians. Upper Saddle River, NJ: Pearson Education, Inc., 2011.
2. On the rare occasion that the current price was exactly equal to the moving average, the current price was classified as above the moving average. This happened occasionally when using a 10-day moving average but was much less frequent when using the longer 30-day and 90-day moving averages. The number of observations gapping above and below a given length moving average does not always sum to the total number of gaps observed because some gaps occurred when a stock was newly included in the database and did not have enough previous price data to calculate a moving average.


