
6. Capturing Shopping Dynamics in Store
Overview
Background
POPAI launched the third phase of the research after engaging senior researchers from leading brand marketers, retailers, and agencies convened to establish a strategy and develop a plan for building a more robust level of understanding of retail marketing. Although the group viewed proof of placement and audience quantification as necessary components for integrating retail marketing into media planning, the group wanted to move beyond audience quantification to measure and understand the actual interaction of shoppers with marketing material and messages in stores and their sales impact. The goal was to move beyond the traditional metrics of audience, return on investment, and message effectiveness to develop new measures that included engagement and a retail marketing evaluation model. The group designated this project as the Marketing at Retail Initiative (MARI) and defined the specific objectives and work plan for testing and developing the program to execute its goals.
The working group detailed its vision in a planning document published in May 2005: “…long-term goal for driving a paradigm shift to build understanding of and a common language for the at-retail marketing space so that practitioners are able to implement an integrated, media-neutral planning approach and measure ROI on the same terms as traditional media….”1
In the view of the committee, the direction for MARI represented a logical progression in thought for maximizing retail space productivity by elevating cooperation among all the key constituents: “The overview of the current project proposes that previous major retail efforts to date have been focused on NCR (increasing front-of-the-store productivity) and ECR (increasing back-of-store efficiency) while this project is focused on ICR—Intelligent Consumer Response (increasing productivity in the core, middle-of-the-store, where shopper decisions are made).”2
NCR→ECR→ICR
The group believed that the successful implementation of the project would pay tremendous dividends for all retail participants: Retailers would optimize the productivity of their most precious fixed asset—retail space; agencies and brand marketers would gain better efficiency for their marketing expenditures by optimizing their media mix and improving their retail execution.
As MARI developed, a key goal was to supplement the audience metrics of a syndicated service by measuring the number of shoppers who actually saw marketing at retail programs and then interacted with them. The addition of these important data points would lay the foundation for the development of a best-practices model for use by all participants. In this way, MARI was not a replacement for syndication but a valuable adjunct providing access to deeper insights into the dynamics at play in retail stores:
• How many come in (Syndication and MARI)
• How many go past (Syndication and MARI)
• How many see (MARI)
• How many interact with (MARI)
• How many purchase (Syndication and MARI)
The project focused on establishing a worldwide, standardized measurement of shopper engagement so that for every item of retail marketing material presented in store, we could measure the shoppers who passed the item, saw the item, engaged with the item, and then purchased the item. The retail marketing evaluation model would take IRPs as a starting point and measure effectiveness in terms of both engagement and purchase:
IRP→Seen→Impact→Purchased
As a part of this execution, the project would establish a global industry standard of measurement for
• Shopper profile
• Reach
• Visibility
• Frequency
• Presence
In doing so, the project would also deliver important learning to be applied toward a best-practices model for developing effective marketing at retail campaigns while also highlighting opportunities for further exploration and development.
Market Tests
Proof-of-concept testing for MARI was completed in two phases: a December 2006 test in the United Kingdom and a spring 2007 test in the United States. The United Kingdom test covered Morrison’s stores, whereas the United States test tracked four different retailers. Participants in the United Kingdom study included brand marketers Coca-Cola, Diageo, and Unilever; the United States program included Anheuser-Busch, Frito-Lay, Hershey’s, McKee Foods, and Pepsi from the brand standpoint; and British Petroleum, Safeway, 7-Eleven, and Walgreens as retail participants. Research was directed by the MARI Advisory Council (MAC) led by Don Whetstone, senior director, Merchandising Research at Walgreen Company, and was conducted by Sheridan Global Consulting. Beyond the sponsored sections, data was captured for an additional 421 categories covering the entire store in each location.
Although definitions and classifications continue to evolve, marketing material was broken into 37 classifications as follows:3
• Branded Counter Display—Permanent
• Branded Equipment—Permanent
• Branded Shelf Equipment—Permanent
• Bus Stops/Banners/Fins—Permanent
• Case/Stack Displays—Temporary
• Ceiling Hanging Boards—Temporary
• Coupon Tear Pad/Holder—Temporary
• Digital Signage/In-Store TV—Permanent
• Dump Bin Wraps—Temporary
• Dump Bins—Permanent
• Dump Bins—Temporary
• Easel Cards—Temporary
• Floor Displays (Carousels)—Permanent
• Floor Graphics—Temporary
• Gondola end promotions—Temporary
• Gondola Header Boards—Temporary
• Inflatable/Moveable—Temporary
• Interactive Displays—Permanent
• Manufacturer Produced Signage—Permanent
• Neck Hangers/Collars—Temporary
• Pallet Displays—Temporary
• Pole Top Displays—Temporary
• Premium Displays—Permanent
• Retail Counter Equipment—Permanent
• Retailer Produced Signage—Permanent/Temporary
• Shelf Strips—Temporary
• Side Kicks/Parasite Units—Temporary
• Stack Cards—Temporary
• Standees/Free-Standing Unit—Temporary
• Stand-Alone Chiller
• Trolley Advertising—Temporary
• Walk-Around Displays—Permanent
• Wall Displays—Temporary
• Window Sticker—Temporary
• Wobblers—Temporary
To gather the necessary data, Sheridan Global Consulting utilized five elements:4
• A retail audit: A precise accounting of all marketing at retail material by store location, type of execution, and message.
• DigiTrack software: A proprietary program used to record, measure, and analyze individual shopper behavior, including the shopper’s navigation of the store, speed, areas of the store visited, and interaction with retail marketing material and messages.
• Prescreener questionnaire: Recruitment of 100 regular shoppers in each store and collection of detailed demographic information. This data was entered into the DigiTrack database along with other information to provide additional levels of analysis to supplement store observations.
• PolyTrack video analysis: The placement of fixed video cameras and networked digital video recorders. The recorded information was incorporated into the DigiTrack program database to support detailed traffic flow analyses, total store demographic summaries, and category shopping behavior.
• ClipCam technology: Specially designed microcameras that were supplied to shoppers as plain lens glasses or fitted to the shopper’s own glasses. These ClipCams were connected to a high-resolution digital video recording system and added to the DigiTrack database to capture a detailed record of each shopper’s behavior in the store including marketing material seen, interactions with marketing material, and actual purchases.
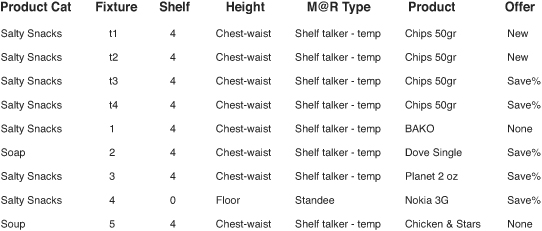
The in-store data collected included the physical fixture, shelf position, height of marketing at retail material, type of material presented, offer, and number of times the execution was repeated. In Figure 6.1, you can see that both BAKO and Campbell’s Chicken and Stars soup presented no offer to the shopper and that the Dove soap offer was presented twice with identical messages and executions in the same location (see Figure 6.1).5
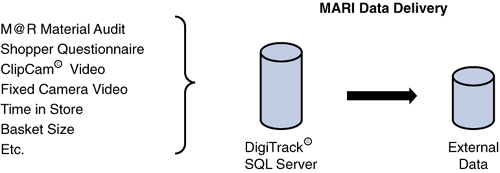
The retail marketing expressions in the four retail stores totaled 14,475, and the research team analyzed 33,704 shopper journeys, representing 487,865,400 potential shopper interactions with marketing material. Data was collected on-site from a variety of sources. Local store information was collected on DigiTrack SQL servers in each store and then forwarded to a central location for analysis (see Figure 6.2).6
Study Results
The proof-of-concept tests validated the methodology used and provided a series of media metrics beyond IRPs that provide retailers, brands, producers, and agencies with tools to measure shopper engagement with retail marketing material. Together with audience delivery measures, these tools provide a basis for increasing total store productivity, tracking program performance, and improving results for future campaigns.
Three new marketing at retail metrics were developed in the course of data analyses: impact ratio, effectiveness ratio, and engagement factor.
Impact Ratio
Impact ratio expresses the correlation between the shoppers who passed the retail marketing material (those who were in a position to see the material) versus the shoppers who actually saw the material as they shopped the store:7
Saw/Passed = Impact Ratio
For example, if 100 shoppers passed an endcap and 50 shoppers saw the marketing at retail material, the impact ratio would be 50 percent (50 / 100 = 50%). MARI technology, along with the associated algorithms that were developed, makes it possible to calculate the impact ratios for each individual item of retail marketing by shopper characteristic and/or shopper mission.
Effectiveness Ratio
The effectiveness ratio refines the impact ratio to reflect the reach of a specific retail marketing expression against the total store audience:8
Saw/Size of Audience = Effectiveness Ratio
Continuing with our previous example, 500 shoppers entered the store and 50 shoppers saw the endcap marketing material, delivering an effectiveness ratio of 10 percent (50 / 500 = 10%).
Engagement Factor
The engagement factor measures the actual engagement of shoppers with the marketing at retail material presented:9
Engaged/Saw = Engagement Factor
If 50 people saw the endcap marketing material and 20 engaged with the material presented, the engagement factor would be 40 percent (20 / 50 = 40%). Sheridan’s analyses of the data revealed a direct, measurable response to retail marketing stimuli that preceded purchase decisions when engaged shoppers ceased scanning to fixate on an object. This visual engagement was often accompanied by additional behavior including touch, pick-up, comparison to alternatives, and so on.
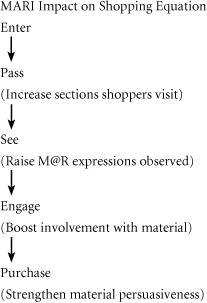
Shopping Equation
The MARI studies resulted in an expression of the shaping behavior within the retail shopping equation as:
Enter→Pass→See→Engage→Purchase
The definition and measurement of these interim steps enables practitioners to increase their knowledge and improve future campaigns by identifying and isolating the points at which the breakdown between potential shopper and purchase occurs.
Conversion Metrics
Using data from the MARI study, we can now analyze conversion against each step in the shopping equation so that closure can be measured against the traffic in the aisle, the number of people who saw the retail marketing material, or the audience that engaged with the presentation.
Purchased / Passed = Traffic Conversion
If 10 shoppers purchase an item against the 100 who entered the aisle, our traffic conversion is 10 percent (10 / 100 = 10%).
Purchased / Saw = Impact Conversion
Considering our conversion as a subset of the impact ratio for our retail campaign, we can track our performance as 10 purchases against the 50 shoppers who saw the campaign delivering a 20 percent conversion (10 / 50 = 20%).
Purchased / Engaged = Engagement Conversion
Finally, we can measure our ability to move from engagement to purchase by calculating the percentage of shoppers who consummated a transaction after engaging with the display. In this case, our conversion would be 50 percent (10 / 20 = 50%).
Retail Marketing Ratios
The added level of detail and precise measurement of shoppers’ behavior at each step of the shopping process gives us more robust detail on our effectiveness at each critical juncture. We can now measure our performance in terms of our impact ratio, effectiveness ratio, engagement factor, and conversion. Further, we can track our performance at any level of detail for any individual element and any combination of elements, including store, location, execution, height, message, and so on.
Item Tracking
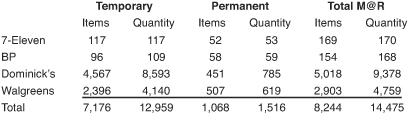
Items were recorded both by unique expression and frequency of presentation so that the study included the repetition of the same message in the same location. The following results shown in Figure 6.3, for example, that in 7-Eleven stores, virtually every presentation of retail marketing material was unique, whereas at Dominick’s, 46 percent of the marketing expressions were duplicative. In total, the average frequency for repeating a message in the same location was 1.8 times. Shelf talkers were the overwhelming choice for type of execution, accounting for almost 78 percent of the retail marketing activity in the stores measured with an average frequency of 1.87 percent (see Figure 6.3).10
Examples of Retail Marketing Ratios
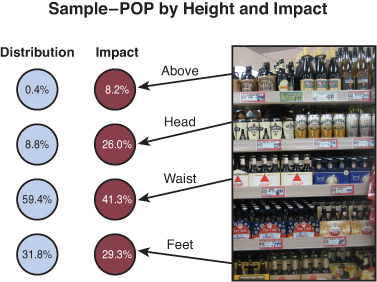
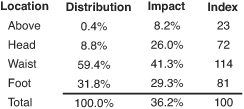
Sheridan Global Consulting traced the height of all retail marketing and found significant variance between the distribution of the material and its impact with shoppers. In general, the messages at waist level were the most prolific executions (59.4% of the total) and also the most effective, registering a 41.3 percent impact ratio. Conversely, overhead signage accounted for 0.4 percent of the total executions, achieving an 8.2 percent impact ratio (see Figure 6.4).11
Across the stores measured, retail marketing executions at waist level indexed at 114 versus 81 at foot level, 72 at eye level, and 23 above (see Figure 6.5).12
Figure 6.5 Height Effectiveness Index
When we first saw these results, we were somewhat taken aback. One of the retail adages from time immemorial held that you placed the things you wanted shoppers to see and buy (generally high-margin items) at eye level, and things you wanted to minimize at lower levels on the shelf. Thus, you would place tennis rackets (high margin) at eye level and tennis balls (low margin) on the base shelf. At first, these measurements seemed to conflict with this time-honored strategy.
As we analyzed the data further, we found that many retailers had executed this strategy so broadly that the key brands tended to be relegated to the lower shelves, whereas private-label products predominantly occupied higher shelves.
Shoppers were not wandering through the store in a depressed frame of mind with downward-cast eyes; they were looking for brands, and these brands also happened to support their products with more marketing material than the private-label items.
As we work through the shopper models in the next section and the tools for optimizing retail marketing programs, we expand on why this phenomenon occurs and how marketers can use this insight to their advantage.
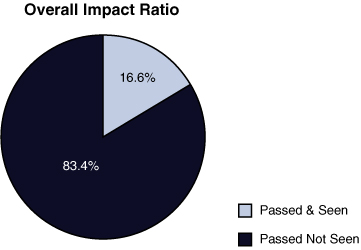
The overall impact ratio across all stores was 16.6 percent (see Figure 6.6). Shoppers were exposed to an average of 1.5 pieces of marketing material every second they were in the store, and engaged with a display every 4.3 seconds. Floor graphics and pallet displays had the highest impact at 34 percent, whereas temporary wall displays registered the lowest impact at 1 percent.13
Figure 6.6 Overall Impact Ratio
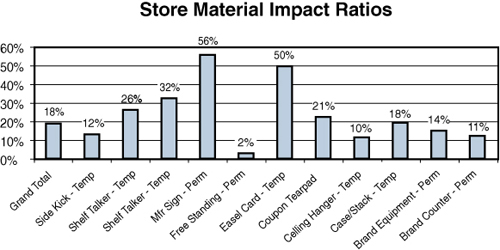
With detailed classification of the material at retail and precise tracking of shopper journeys through, and interactions within, the store, we can measure all marketing at retail ratios at any desired level. In store A, shown in Figure 6.7, the overall impact ratio was 18 percent. However, permanent manufacturer-provided signage achieved a high impact ratio of 56 percent, whereas the permanent free-standing displays registered only 2 percent.14
Figure 6.7 Store Material Impact Ratios
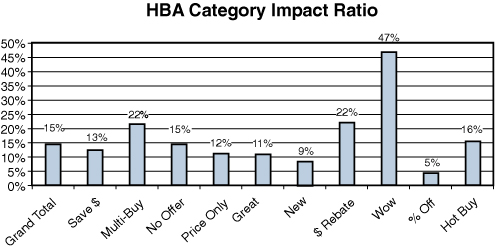
Similarly, we can break out the impact of messages for the entire store or any level of within the store desired (see Figure 6.8). In the health and beauty aids category (HBA), “Wow” was very effective (47 percent) versus a low “for percentage off of” 5 percent and a 15 percent category average.15
Figure 6.8 HBA Category Impact Ratio
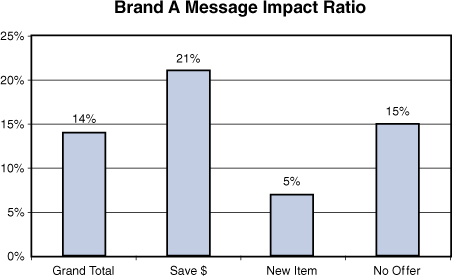
The analyses can be continued down to the brand level where, as shown in Figure 6.9, brand A achieved the highest impact (21 percent) with a dollar savings message against a 14 percent brand average and 7 percent “New Item” ratio.16
Figure 6.9 Brand A Message Impact Ratio
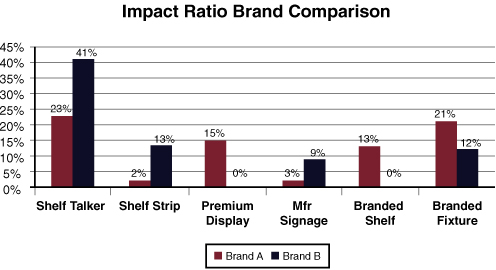
Continuing the analyses further, retailers can also compare brands in the same category, as shown in Figure 6.10, where performance varied significantly between brands utilizing the same type of material.17
Figure 6.10 Impact Ratio Brand Comparison
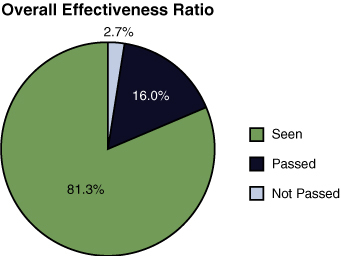
Effectiveness ratios can also be tracked at multiple levels. In the stores studied, the overall effectiveness ratio was 2.7 percent. Shoppers did not visit 81.3 percent of the store aisles. Of the 18.7 percent of the aisles visited, shoppers saw 16.6 percent of the marketing material presented; that is, 18.7% ×16.6% = 2.7% (see Figure 6.11).18
Figure 6.11 Overall Effectiveness Ratio
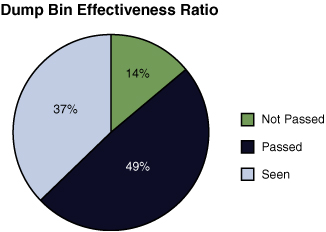
Likewise, we can analyze results by execution; that is, dump bins, with their location predominantly in main aisles, are passed by 86 percent of shoppers and are seen by 37 percent of those entering the store (see Figure 6.12).19
Figure 6.12 Dump Bin Effectiveness Ratio
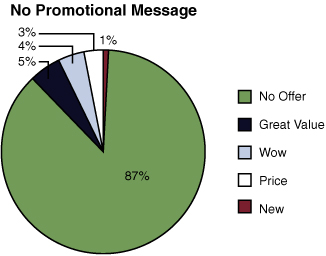
We can also track message effectiveness with promotion or without. In Figure 6.13, a brand message, categorized as no offer, significantly outscored all other options, delivering 87 points against a next highest score of 5 percent (see Figure 6.13).20
Figure 6.13 No Promotional Message Effectiveness Ratio
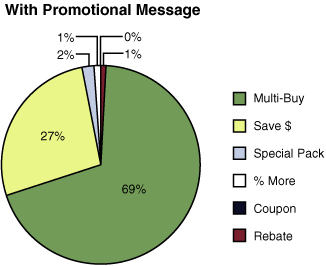
When promotional messages are considered as a group, multipack offers outscored a specific dollar savings 69 percent to 27 percent, with all other messages trailing significantly (see Figure 6.14).21
Figure 6.14 Effectiveness Ratio With Promotional Message
As in the PRISM Phase Two project, the generation of detailed traffic flow analyses was enormously beneficial. The knowledge of how shoppers navigate the store and which sections they visit is not generally collected or tracked and provided immediate benefit, especially to the retail participants. During the test period, 33,704 shoppers entered the store. Their individual and collective journeys were evaluated by day, day part, gender, and age. The analyses of shopper flow resulted in a traffic pattern map that showed the relative volume of shoppers for each area of the store, so that studies’ participants had an accurate view of which areas were visited and how traffic flowed throughout the store.22
Potential Applications
MARI offers many potential benefits for all retail participants. Brand marketers can increase the effectiveness of their marketing expenditures and optimize their budgets by understanding the reach and effectiveness of each individual piece of material and the interaction between elements in an entire campaign for a store, a section, against competitors, by type of display, location of display, and message communicated. Each element can be studied separately or in concert with others. If desired, differences between day parts and within various demographic segments can be isolated and explored for tighter targeting.
In addition to the preceding brand benefits, retailers can also use the knowledge to increase space productivity in their stores, boost their operational efficiency, and build the shopping basket size. By identifying cold spots within their stores, retailers can devise strategies to move traffic through more parts of the store, with the increased traffic resulting in more items purchased. Understanding what works and does not work with the necessary specificity can allow retailers to more intelligently deploy their assets against effective programs.
Agencies and producers can reap benefits in more intelligently planning, targeting, monitoring, measuring, and refining campaigns for their clients. Sales results can be enhanced as they integrate marketing at retail into their media plans, with demographic targeting available as an option. The assessment of the effectiveness of, and interplay between, various marketing elements can enable agencies to evaluate and analyze the performance of complete programs and the components within them, so they can refine future marketing campaigns. The ongoing use of marketing at retail ratios can build the knowledge base, leading to the establishment of important client benchmarks for each stage of the shopping equation.
Most important, shoppers can reap important benefits from improvements in store layout, design, and presentation. The net result can be a store environment that offers more shopper efficiency. Together with the enhanced communication that comes from data analyses, the shopper can do less work in-store, resulting in greater shopping satisfaction.
Recap
Building on the studies completed in phases one and two, the MARI research deepened the exploration of retail marketing in important ways by
• Expanding shopper screening to include intent and demographics
• Tracking the height of each piece of retail marketing material
• Surveying the placement of each piece of marketing material to track duplicative executions
• Measuring the shopper interaction with retail marketing expressions for both seeing and engaging
• Identifying where an item was purchased as opposed to only whether an item was bought
These efforts enable us to map the path of the shopper along a shopping equation that begins with store entry and concludes with the final purchases made. The analyses of the interactions at each step in this process yields important insight into the opportunity areas in each phase. The goal of every participant in retail is to get one more item in the shopping basket. The data from MARI helps us identify how we can achieve this goal by improving our effectiveness at each step:
Armed with detailed knowledge of shopper behavior, our task becomes immeasurably easier. As Martin Kingdon, managing director of Sheridan Global Consulting, rightly concluded.
“If we know
• What engages the shopper
• Whom we engage
• To what degree we engage them
• Where we engage them and
• For how long they are engaged
We can make educated guesses to why and intelligently recommend actions.”23
In addition to validating the test methodology, the MARI proof-of-concept test yielded knowledge about many other areas of the shopping experience for further exploration in the next stage of research. Some of these learnings include
• Shopping rate—Average speed in store
• Shopping length—Average time in store
• Orientation—Time in store until first display seen
• Commitment—Time to first purchase
• Frequency—Number of times same message is observed
• Gender differences
• Traversing—Proportion of shoppers passing through versus shopping a category
• Mapping—Understanding secondary and tertiary involvement with marketing at retail presentations
• List impact—Difference between list and memory shoppers
• Couponing—Effectiveness of in-store offers in changing traffic patterns
As we finalize this manuscript, the second stage of the ongoing MARI research is preparing to launch in the field.
Summary
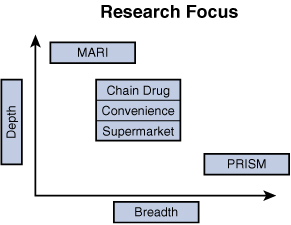
With the constant adjustments to planning and execution that come with new ventures that provide knowledge that sometimes confounds expectations and upends the conventional wisdom, research into the world of retail marketing has significantly evolved over the 11 years of industry field research. From channel studies, through syndication pilots, to a proof-of-concept for the intense study of shopper behavior in store, the industry collectively explored all the elements that contribute to retail marketing success. Studies have been broadly directed at the dynamics within a distribution channel, tightly centered on specific measures across broad distribution, and immersively focused on shopper behavior at retail. They are all linked in growing our knowledge base, and together they provide powerful learnings while also charting a course for future development here and in other markets around the world.
Figure 6.15 depicts the focus of each of the research projects completed. MARI was deeply focused on a number of elements in a small cluster of retail locations. The channel studies explored a significant number of stores in individual channels with an ever-expanding list of activity to be measured and analyzed. PRISM concentrated on a defined set of measurements but worked to execute those measurements broadly against a multitude of channels and locations within each.
As valuable as the syndicated research is for expanding the base of industry knowledge, it does not obviate the need for continuing proprietary research. Although industry research provides stand-alone insights, its real power lies in its integration with the specific information and understanding gained from the research conducted by individual brands, retailers, and agencies about their specific strengths, weaknesses, and the attendant opportunities. Both industry and proprietary research provide distinctly unique areas of market intelligence. When the two are successfully combined, the result is an added depth of perspective that can enhance the strategy for the development of new opportunities and a greater level of retail success.
The Retail Marketing Model Shifts
The traditional marketing mix is under profound stress. Howard Schultz, the CEO of Starbucks, went so far as to exclaim, “Traditional marketing and brand-building have become obsolete.”24 In our new reality, successful marketers will adopt a new model that drives increased efficiency and optimizes marketing expenditures across all media options. They will use the information and enlightenment from the last decade’s research initiatives to guide their planning and execution.
The shopper is now firmly in control—she is empowered to find what she wants when she wants it, and she expects to do this quickly and efficiently. The October 2007 GMA Study by Deloitte Consulting observed, “Consumer experts say about 70% of purchase decisions are made in grocery stores…what little shreds of brand loyalty and awareness consumers still have, get left behind the minute they step through that automatic door.”25 To ensure survival and success, each member of the retailing community must access and apply all the learning available from the research to date and aggressively work to expand the information available.
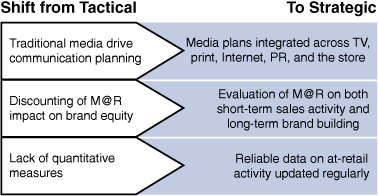
Today we are in the midst of a dramatic shift in retail marketing that will result in the elevation of discourse from the tactical to the strategic. Figure 6.16 demonstrates some of the major shifts that accompany the integration of retail marketing into media planning. These changes, driven by the availability of regularly provided reliable data, include the evaluation of retail campaigns against both short-term sales development and long-term brand-building.
Figure 6.16 Retail Marketing Discourse Shift
These shifts imply that retail marketing becomes another option in the media arsenal, with the specific execution chosen for its applicability against the target in the selected channel, much as radio or television programming is chosen to reach a desired audience (see Figure 6.17).
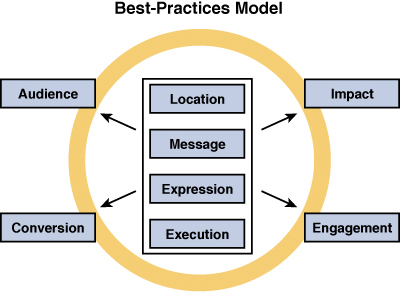
The research leads us to a new best-practices model in which four key elements of retail marketing implementation are tracked across four measures. The specific marketing program is considered in terms of its location in the store, the message it delivers in that location, the expression the marketing takes both in type of marketing presented and the creativity incorporated into the design, and finally the level of execution or retail placement achieved. These components of the retail program are then evaluated against the audience delivered, the impact achieved, the level of shopper engagement generated, and their closure rate (see Figure 6.18).
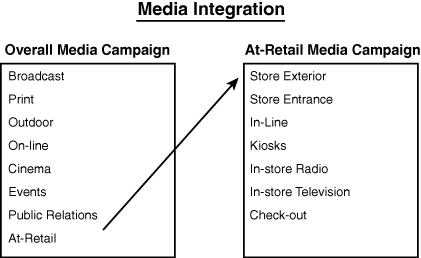
Figure 6.18 Best-Practices Model
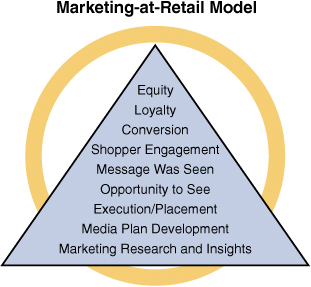
Our new best-practices model in Figure 6.19 supports this model for retail marketing, in which the marketing insights generated from syndicated and proprietary research are incorporated into media plan development. The resulting programs are placed in-store using knowledge from previous campaigns to improve the impact of each successive placement. Each crucial step in the buying process is measured from compliance to opportunity to see (Impact), to shopper engagement (Engagement Factor), to conversion, culminating in brand loyalty and increased brand equity.26
Figure 6.19 Retail Marketing Model
Endnotes
1. Author’s notes (Washington DC, May 2005).
2. Ibid.
3. Martin Kingdon, MARI Measuring Shopper Engagement (Alexandria, VA: POPAI 2007), page 15.
4. Ibid., 7.
5. Ibid., 21.
6. Ibid., 3.
7. Ibid., 3.
8. Ibid., 3.
9. Ibid., 10.
10. Ibid., 22.
11. Ibid., 22.
12. Ibid., 14.
13. Ibid., 13.
14. Ibid., 14.
15. Ibid., 14.
16. Ibid., 13.
17. Ibid., 16.
18. Ibid., 17.
19. Ibid., 17.
20. Ibid., 18.
21. Ibid., 18.
22. Author’s notes (January 2007).
23. Martin Kingdon, POPAI Johannesburg, South Africa Marketing at Retail Conference, September 2008.
24. Jeremy Dann, “How to Find a Hit as Big as Starbucks,” Business 2.0. (May 2004) http://money.cnn.com/magazines/business2/business2_archive/2004/05/01/368250/index.htm.
25. Deloitte Consulting, “Grocery Manufacturers Association Study” (October 2007) http://www.mediapost.com/publications/?fa=Articles.printFriendly&art_aid=69231.
26. Author’s notes (December 2006).